Sample Category Title
Euro Subdued As Investors Look For Cues
EUR/USD continues to have a quiet week. Currently, the pair is trading at 1.1751, down 0.01% on the day. On the release front, there are no German or European indicators on the schedule. In the US, the focus is on employment numbers, with the release of Preliminary Nonfarm Productivity and Preliminary Unit Labor Costs. On Thursday, there are two key events – PPI and unemployment claims.
With the eurozone continuing to show solid growth in 2017, the ECB's quantitative easing program (QE) is coming under closer scrutiny. The scheme is scheduled to end in December, although this is not a drop-dead date – the ECB has been careful to state that QE could be extended “if necessary”. The ECB hold its next policy meeting in September 7, and there is a strong possibility that the bank will make an announcement regarding tapering QE, which could start in early 2018. The problem facing policymakers is that despite a stronger labor market and improved growth, inflation levels remain stubbornly low, as the ECB's inflation target of 2% has proven overly optimistic. The ECB is well aware that any talk of tighter policy could send the euro higher, as was the case in June, when investors snapped up euros after Mario Draghi made some hawkish comments at a meeting of central bankers. As far as interest rate moves, the ECB is unlikely to raise rates until its tapering process is well under way, meaning we're unlikely to see any rate moves before the second half of 2018.
While the euro is enjoying a revival, it's been the opposite story for the US dollar. Paralysis in Washington is weighing on the greenback, as Donald Trump's antics and inability to pass healthcare legislation has increased political risk in the US. As well, the Federal Reserve's monetary policy remains unclear. Earlier this year the Fed strongly hinted that it planned to raise rates three times in 2017, but has only pressed the rate trigger twice. In June, Fed Chair Janet Yellen shrugged off low inflation, saying that it was due to “transient” factors, leaving the impression that the Fed still planned one final hike. However, inflation has not improved and the Fed has changed its tune. Last week, St. Louis Federal Reserve President James Bullard said he opposed further Fed hikes, warning that another hike would actually delay inflation from hitting the Fed's target of 2%. The markets have become more skeptical about a rate hike in December, as the odds have fallen to 33%, compared to 43% a week ago.
Forex Technical Analysis: EUR/USD, USD/JPY, GBP/USD
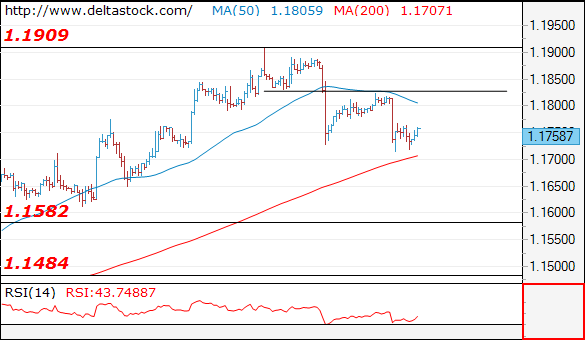
EUR/USD
Current level - 1.1758
The test at 1.1825 has failed and the pair reached a new low at 1.1713. The outlook remains negative, for an attack of 1.1650-1580 area. Minor intraday resistance lies at 1.1780.
| Resistance | Support | ||
| intraday | intraweek | intraday | intraweek |
|
1.1780 |
1.1909 |
1.1650 |
1.1580 |
|
1.1825 |
1.2000 |
1.1580 |
1.1480 |
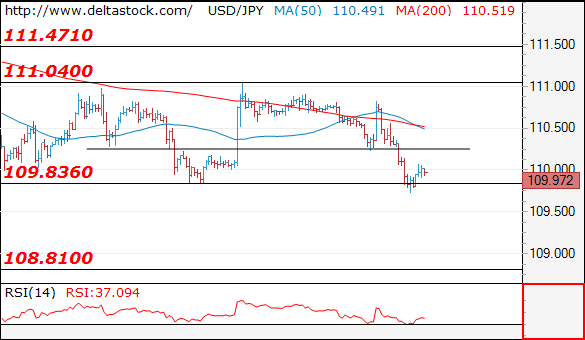
USD/JPY
Current level - 109.97
The slide through 110.25 signals a renewal of the general downtrend and the outlook is bearish, for a depreciation towards 108.80. Initial intraday resistance lies at 110.25.
| Resistance | Support | ||
| intraday | intraweek | intraday | intraweek |
|
110.25 |
112.20 |
109.80 |
109.80 |
|
111.04 |
114.50 |
108.80 |
108.10 |
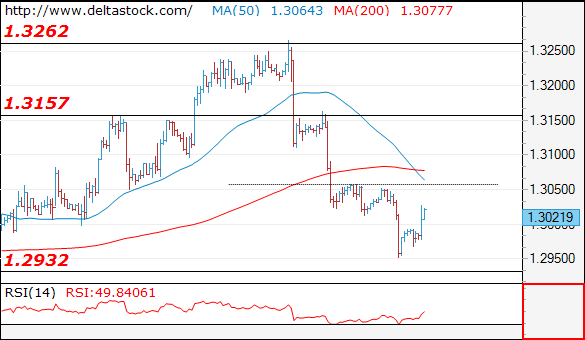
GBP/USD
Current level - 1.3021
The recent low at 1.2950 should be enough for a completion of the downtrend from 1.2360 and the intraday bias is positive above 1.3000, for a break through 1.3050, towards 1.3160.
| Resistance | Support | ||
| intraday | intraweek | intraday | intraweek |
|
1.3050 |
1.3260 |
1.3000 |
1.2930 |
|
1.3100 |
1.3500 |
1.2930 |
1.2810 |
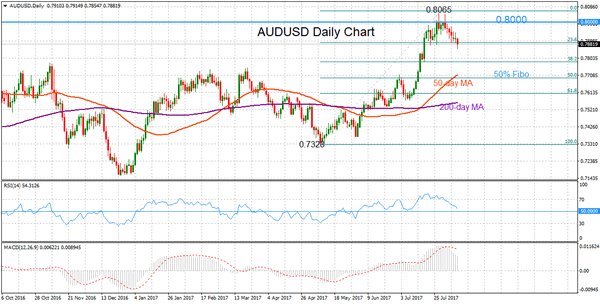
AUDUSD Retreats From Multi-Year Highs Below Key 0.80 Level, Downside Risk Increases
AUDUSD declined after testing a fresh multi-year high of 0.8065 on July 27. The pair struggled to sustain gains above the key 0.8000 psychological level. The market was overextended on the daily chart as indicated by the RSI which rose above 70 into overbought territory.
Momentum signals have shifted to the downside – RSI and MACD are sloping down, suggesting that AUDUSD will most likely have trouble progressing significantly higher at this point. Major resistance is now at 0.8000. Clearing the 0.8065 peak would see a resumption of the recent uptrend.
The level at 0.7888 held as support for the past three weeks and is currently being tested. It is the 23.6% Fibonacci retracement level of the rise from 0.7328 to 0.8065. A daily close below it would likely mean further slippage towards 0.7781 – the 38.2% Fibonacci and July 18 low. From here, the 50% Fibonacci at 0.7695 is expected to provide support. Reaching this level would bring the longer-term market structure to neutral from the current bullish picture.
The overall technical landscape remains bullish. The crossover of the 50-day with the 200-day moving average on July 14 gave a bullish signal. RSI and MACD are in bullish territory. Meanwhile, the short-term bias is neutral to bearish. While downward momentum is increasing (as the RSI and MACD indicators decline), clearer signals are needed to determine the outlook for AUDUSD.
Safe-Haven Assets Gain On Escalating US-North Korea Geopolitical Turmoil
Geopolitical woes between the US and North Korea escalated overnight following announcements by the presidents of both countries. In response, safe-haven assets such as the yen, Swiss franc and gold strengthened overnight. The dollar index was moderately down ahead of European trading. The escalating situation commanded the news flow during the Asian session, overshadowing other economic developments of significance for forex markets.
North Korea announced that its leader Kim Jong Un was weighing a possibility to strike the US Pacific territory of Guam as a response to Donald Trump’s earlier comments that any threats made by North Korea will be met 'with fire and fury like the world has never seen'. Trump’s remarks were provoked by Pyongyang’s threats of 'physical' retaliation for new sanctions imposed by the United Nations and vocally supported by the US and South Korea. In the wake of new developments, the dollar index weakened, giving up on some of the strong gains following an upbeat JOLTS report yesterday. US job vacancies increased by 6.163 million in June instead of 5.775 million expected, exceeding the previous mark of 5.702 million and recording a multi-year high. The dollar index soared to 93.88 in yesterday’s late session but retreated to 93.62 this morning.
During the Asian session, the yen, considered a safe-haven, strengthened against the greenback, with the dollar/yen pair last trading at 110.03. The Swiss franc, another currency that has the same safe-haven appeal as the yen in times of geopolitical anxiety, strengthened with the dollar falling to 0.9688 francs. For the same reason, gold rose to $1,265.55 an ounce during late Asian session trading.
The Australian dollar weakened against its US counterpart. Aussie/dollar was last trading at 0.7891. The kiwi weakened as well under additional pressure ahead of the Reserve Bank of New Zealand meeting tomorrow. The bank is expected to be dovish about its monetary policy outlook. Kiwi/dollar was last trading at 0.7315.
The euro was slightly up against the US dollar to last trade at 1.1754, though the single currency has plunged from the highs of 1.1909 achieved last week following reports showing a strong labor market in the US.
Sterling recovered from yesterday’s low of $1.2952 to trade at $1.3018 ahead of the European session. The pound has been negatively impacted by tepid consumer spending. UK retail sales rose 0.9% annually in July, down from 1.2% the prior month. While the figure came in above expectations of 0.6% gain, it still got investors worried as UK consumers cut back on discretionary spending and budgeted for a more pricey food basket.
Weakness in oil prices continued for the third day as concerns persist over OPEC cuts. The Energy Information Administration (EIA) is due to report its crude oil inventories later in the session. WTI was last trading at $49.10 a barrel while Brent was at $52.00.
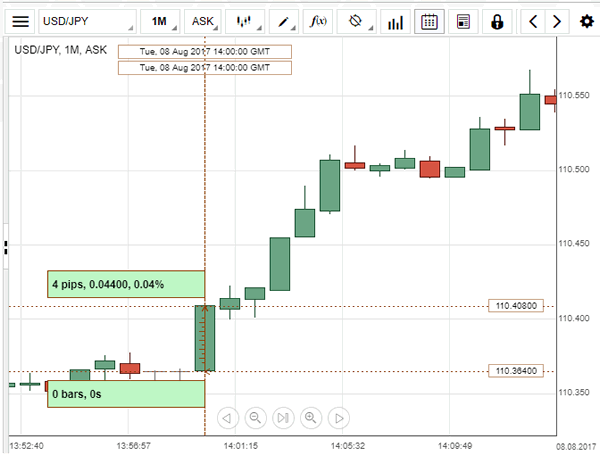
USD/JPY: JOLTS Job Openings
The US job openings report showed a record-high figure, which resulted in the instant advance of the USD/JPY currency pair. Strong figures supported the appreciation of the Greenback against the Yen, which marked a 0.04% increase to be seen trading above the 110.40 level. The Labour Department released its Job Openings and Labour Turnover Survey, or JOLTS, which revealed that the number of job openings jumped 461K to a seasonally adjusted 6.16M, following the preceding month's upwardly revised figure of 5.70M. The better-than-expected data bolstered optimism over the future of the labour market, as the gap between hiring and job openings indicated qualified workers' shortages, which would sustain upward pressure on pay growth.
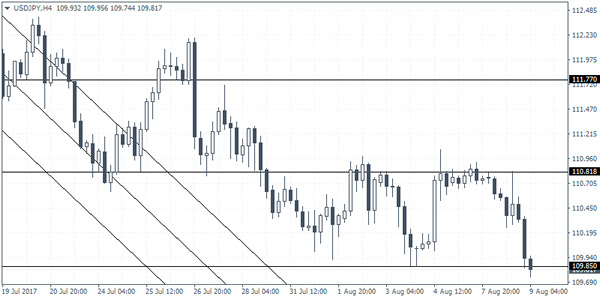
USDJPY Intraday Analysis
USDJPY (109.81): The USDJPY failed to breakout past the 110.80 resistance level. This resulted in some downside in prices. Currently, USDJPY is seen retesting the previous lows formed near 109.85 levels. This is a support level that was previously tested. We could, therefore, expect to see some reversal at this support level followed by an upside move in prices. However, in the near term, USDJPY could remain range bound within 110.81 and 109.85 levels of resistance and support.
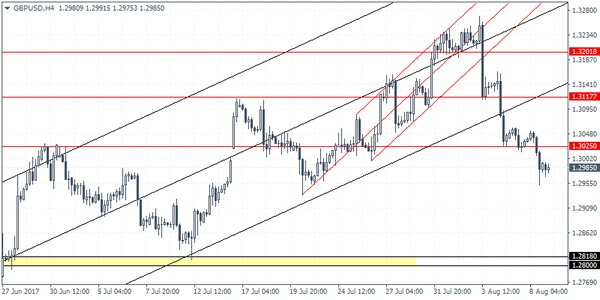
GBPUSD Intraday Analysis
GBPUSD (1.2985): The British pound closed on a bearish note below 1.3025 level of support yesterday. This would suggest further downside in the cable. In the near term, we can expect to see price action consolidate near the resistance level at 1.3025 which could be tested. The next main support for GBPUSD comes in at 1.2818 - 1.2800. This would mark a strong decline in the currency pair. So far, price action in GBPUSD has been falling in a step fashion. Resistance levels are seen at 1.3025 and 1.3177.
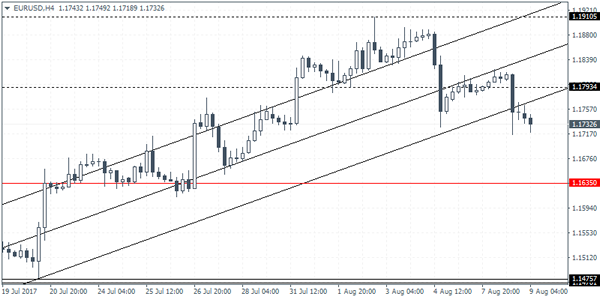
EURUSD Intraday Analysis
EURUSD (1.1732): The EURUSD closed bearish yesterday after price action formd an outside bar. A continued decline in the currency pair coould see further downside being confirmed. The brief reversal to 1.1793 saw price action break down strongly. Support is seen at 1.1635 currently which remains the strong downside target in prices. To the upside, any reversals will once again be met with the resistance at 1.1793. Any upside in the currency pair will need to see price action break past this resistance level.
RBNZ Monetary Policy Meeting In Focus
The US dollar continued to post some gains yesterday across the board. However, the gains were limited with the Japanese yen staying firm. The gains in the yen came about due to ongoing escalating tensions from North Korea which kept investors appetite in check.
The US President Trump, in response to North Korea's actions, said that the United States would respond with "fire and fury." The economic data released yesterday included the German trade balance data which widened more than expected. Earlier today, inflation data from China showed that consumer prices rose 1.4% on the year. This was less than the forecast of a 1.5% increase. Producer prices index was also seen rising at a softer pace of 5.5%
Looking ahead, the markets will be focusing on the RBNZ's meeting coming up later this evening. No changes are expected to the interest rates at today's meeting. Canada will be releasing the building permits figures.
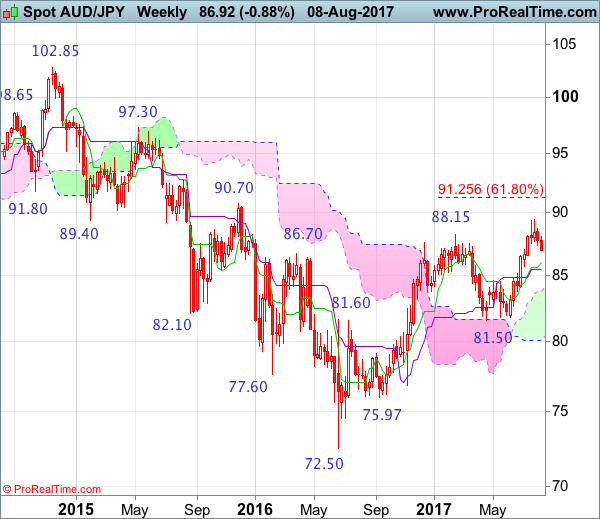
AUD/JPY Candlesticks and Ichimoku Analysis
Weekly
• Last Candlesticks pattern: Shooting star
• Time of formation: 13 Mar 2017
• Trend bias: Down
Daily
• Last Candlesticks pattern: Bearish engulfing pattern
• Time of formation: 16 Feb 2017
• Trend bias: Near term down
Although the Australian dollar edged higher to 89.40 late last month, the subsequent retreat suggests consolidation below this level would be seen and pullback to 0.8700 is likely, however, reckon downside would be limited to 86.50-60 and renewed buying interest should emerge around 86.00-10, bring another rise later, above 88.70 would suggest the pullback from 89.40 has ended, bring retest of this level first. Once this recent high is penetrated, this would confirm medium term upmove from 2016 low of 72.50 is still in progress and extend further gain to psychological resistance at 90.00, then towards previous chart resistance at 90.70.
On the downside, whilst initial pullback to 87.00-10 is likely, reckon downside would be limited to 86.60-65 and support at 85.70 should hold, bring another rise later. A daily close below support at 85.70 would suggest top has been formed, brig retracement of recent rise to 85.40-50, then 85.00, however, reckon the upper Kumo (now at 84.85) would limit downside and price should stay above the lower Kumo (now at 84.36), bring rebound later.
Recommendation: Buy at 85.75 for 88.00 with stop below 84.75.
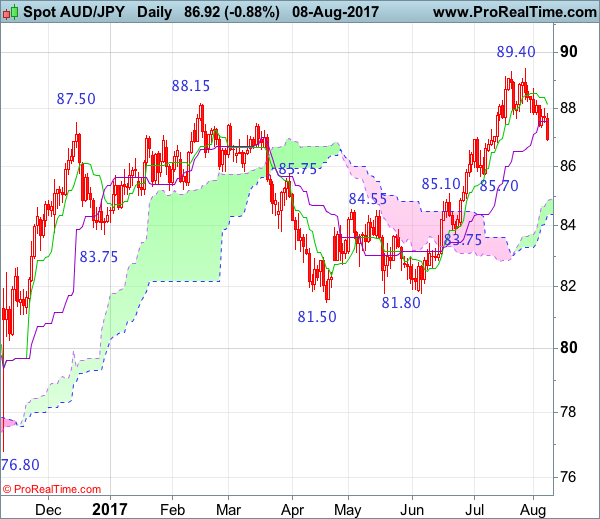
On the weekly chart, aussie’s retreat after rising to 89.40 formed a shooting star and the subsequent black candlestick suggests a minor top is possibly formed, hence consolidation below this level would be seen for correction to 87.00, then 86.50-60, however, reckon downside would be limited to the Tenkan-Sen (now at 86.01) and bring another rise later. Above 88.70 would bring retest of 89.40. A break above there would confirm medium term upmove from 72.50 low (formed back in 2016) is still in progress and extend headway to psychological resistance at 90.00, then test of previous resistance at 90.70, however, overbought condition should limit upside to 91.50-60 and price should falter below another previous chart resistance at 92.70, bring correction later.
On the downside, although initial pullback to 87.00, then 86.50-60 cannot be ruled out, reckon the Tenkan-Sen (now at 86.01) would limit downside and bring another rise later. Below the Kijun-Sen (now at 85.46) would suggest a temporary top is formed instead, bring retracement of recent rise to 85.00, then 84.60-65, however, still reckon the upper Kumo (now at 83.70) would remain intact.