Sample Category Title
XAU/USD Analysis: Increases volatility
Fundamental changes form the US Dollar side have taken place in the financial markets. As a result, the price of the yellow metal has changed. In general, the JOLTS Job Openings data was released at 14:00 GMT on Tuesday and revealed such a high number, compared to the average market forecast, that the Greenback jumped. Due to that move the pair sort of reached the lower trend line of the recently adjusted descending channel pattern. Afterwards a rebound took place and the metal was already at the upper trend line of the channel down pattern on Wednesday morning. It still had to be seen whether the metal bounces off the resistance and a short term decline begins or the surge continues. The outcome will be possible to forecast as the bullion moves away from the trend line.
AUD/USD: Westpac Consumer Sentiment
Australian consumer sentiment fell to the weakest level since the Great Financial Crisis in August, contributing to the decline in the AUD/USD currency pair. The Aussie fell against the US Dollar to be traded below the 0.7883 mark on Wednesday's morning. The Westpac-Melbourne Institute revealed that its Consumer Confidence Index dropped 1.2% in August, following a 0.4% increase registered in the prior month. Moreover, consumer sentiment weakened for the third time in the last four months amid higher pressures on households' finances and concerns about interest rate hike. However, Westpac forecasts that the Reserve Bank of Australia would keep rates on hold in 2018, due to expectations for insufficient economic growth and low inflation.
Trade Idea: GBP/USD – Sell at 1.3090
GBP/USD – 1.3040
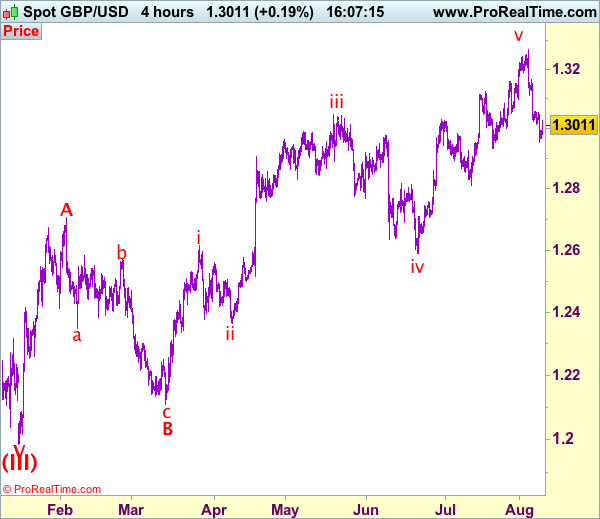
Recent wave: Wave V of larger degree wave (III) has ended at 1.1986 and major correction has commenced from there for gain to 1.3000 and 1.3140-50
Trend: Near term up
Original strategy :
Sell at 1.3150, Target: 1.2980, Stop: 1.3210
Position: -
Target: -
Stop: -
New strategy :
Sell at 1.3090, Target: 1.2890, Stop: 1.3150
Position: -
Target: -
Stop:-
Although cable has recovered after falling to 1.2953 yesterday, suggesting minor consolidation above this level would be seen and recovery to 1.3055-60 cannot be ruled out, however, reckon upside would be limited to 1.3090-00 and bring another decline later, below said support at 1.2953 would extend the fall from 1.3269 top for retracement of recent upmove to previous support at 1.2933, break there would extend weakness to 1.2890-00 before rebound.
In view of this, would be prudent to sell cable on subsequent recovery as previous support at 1.3112 should turn into resistance and cap upside. Only break of indicated resistance at 1.3165 would defer and suggest first leg of decline from 1.3269 has ended instead, risk a strong rebound to 1.3200, however, price should falter well below said resistance and bring another decline later.
Our preferred count on the daily chart is that cable's rebound from 1.3500 (wave (A) trough) is unfolding as a wave (B) with A ended at 1.7043, followed by triangle wave B and wave C as well as wave (B) has ended at 1.7192, the subsequent selloff is the larger degree wave (C) which is still unfolding with minor wave (III) of larger degree wave 3 ended at 1.1986, hence wave (IV) correction is in progress which could either be a triangle wave (IV) of a complex formation but upside should be limited to 1.3500 and price should falter well below 1.4000, bring another decline in wave (V) of 3 for weakness to 1.1500, then 1.1200.
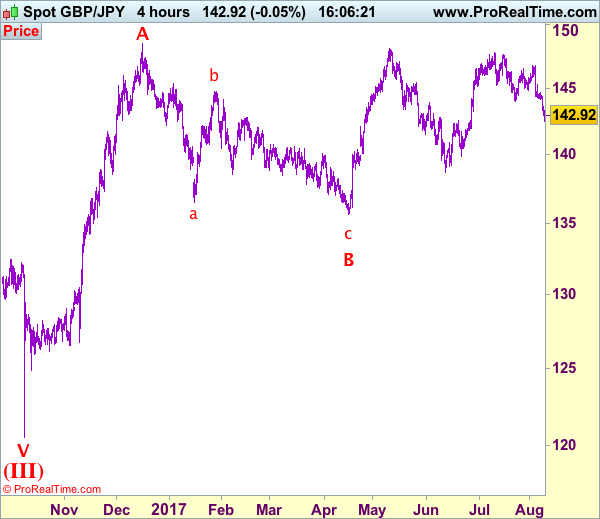
Trade Idea: GBP/JPY – Sell at 143.60
GBP/JPY - 142.80
Recent wave: Medium term low formed at 120.50 and (A)-(B)-(C) major correction has commenced with (A) leg ended at 148.45, hence wave (B) is unfolding for retreat to 131.00-10.
Trend: Near term up
Original strategy:
Sell at 145.50, Target: 143.50, Stop: 146.10
Position: -
Target: -
Stop: -
New strategy :
Sell at 143.60, Target: 141.60, Stop: 144.20
Position: -
Target: -
Stop:-
As sterling’s decline has accelerated especially after the break of previous support at 144.05 (now resistance), adding credence to our view that the decline from 147.75 top is still in progress, hence bearishness remains for this decline to extend weakness to 142.00-10, however, near term oversold condition should prevent sharp fall below 141.50 and price should stay above 141.00, bring rebound later.
In view of this, would not chase this fall here and would be prudent to sell sterling on recovery as 143.50-60 should limit upside and bring another decline later. Above previous support at 144.05 would defer and suggest a temporary low is formed instead, risk a stronger rebound to 144.40-50 but price should falter below resistance at 145.30, bring another decline later.
Our preferred count is that larger degree wave V with circle is unfolding from 251.12 with wave (I) 219.34, (II): 241.38 and wave (III) is subdivided into 1: 192.60, 2: 215.89 (23 Jul 2008) and wave 3 ended at 118.87 earlier in 2009. The correction from there to 162.60 is wave 4 which itself is a double three and is labeled as first a-b-c ended at 151.53, followed by wave x at 139.03, 2nd a ended at 162.60, 2nd b at 146.75 and 2nd c leg of wave 4 ended at 163.00. Therefore, the decline from 163.00 to 116.85 is now treated as wave 5 which also marked the end of larger degree wave (III), hence wave (IV) major correction has commenced for retracement of the wave (III) from 241.38 and upside target at 183.95-00 (50% Fibonacci retracement of the wave (II) from 241.38) had been met, a drop below 160.00 would suggest wave (IV) has ended at 195.85, bring decline in wave (V) for initial weakness to 130 (already met) and 120.
Trump Triggered Text Book Trade | Aussie Under Trouble After Consumer Data
'Fire & Fury' Faces Risk-Off
Aussie Lost Its Momentum
RAND Sell-Off Continues
'Fire & Fury' Faces Risk-Off
The geopolitical tensions have prompted a risk-off trade amid investors. President Trump's comments about North Korea have created nervousness and the fear is if the president really means what he said 'fire and fury'. The typical text book trade is that investors rush for the safe haven hence we have experienced a bounce for the gold price. A couple of days ago, we did mention that the gold price could also stem its losses if the tensions escalate around North Korea.
The Chinese inflation data was tucked under the shadow of President Trump's 'fire and fury' phrase. Although it is worth mentioning that the inflation number was a little softer and this means the spill over effect is going to echo the same message in other major economies.
Aussie Lost Its Momentum
The Aussie benefited from the dollar weakness but the rebound in the dollar got the Aussie in trouble. The Australian business confidence was much healthier yesterday which presents a more optimistic scenario for the uptrend to resume. The weak consumer sentiment reading broke the Aussie rally further. But it is the RBNZ which is going to face all the flash lights, and fear of disappointment is always there. Traders are expecting no reaction from the bank. We are expecting the bank to come with their dovish or less hawkish tone because of the deterioration in the economic data but a lot of impact of that is already baked into the Kiwi.
RAND Sell-Off Continues
The South African Rand is punished by investors as president Jacob Zuma narrowly survived a vote of no confidence in the parliament. His victory triggered many stop losses as it was expected that he will not survive. We expect the rand to underperform against the dollar. In other words, the overly optimistic trade is over for now.
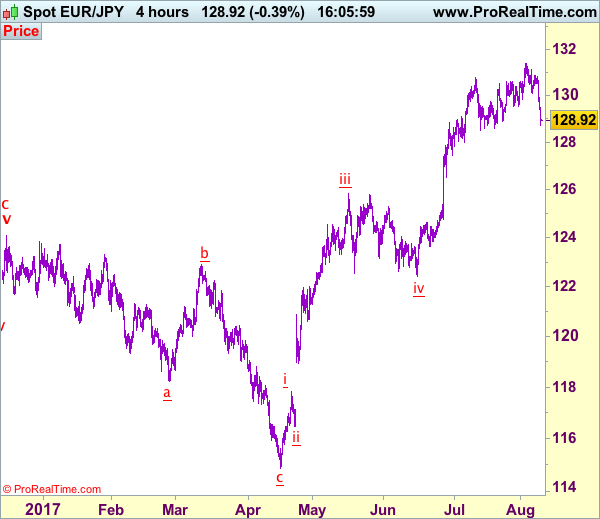
Trade Idea: EUR/JPY – Sell at 129.50
EUR/JPY - 128.73
Recent wave: wave v of (C) ended at 94.12 and major correction in wave A has ended at 149.79
Trend: Near term up
New strategy :
Sell at 129.50, Target: 127.50, Stop: 130.10
Position: -
Target: -
Stop:-
Euro’s decline gathered momentum after breaking support at 130.09 (now resistance), signal top has been formed at 131.40 last week and consolidation with downside bias is seen for this move to extend weakness to previous support at 128.49, break there would add credence to this view and extend this fall from 131.40 for retracement of early upmove to 128.00, then towards previous support at 127.44, however, near term oversold condition should limit downside to 127.00.
In view of this, we are looking to sell euro on recovery as 129.40-50 should limit upside and bring another decline. Only break of said previous support at 130.09 would abort and suggest low is formed instead, bring a stronger rebound to 130.50-60 but price should falter below resistance at 131.12 and bring another decline later.
Our latest preferred count is that wave (ii) is ABC-X-ABC which ended at 123.33 and wave (iii) is unfolding with wave iii ended at 100.77, followed by wave iv at 111.57 and wave v as well as the wave (iii) has ended at 97.04, followed by wave (iv) at 111.43 and wave (v) has ended at 94.12 which is also the end of the larger degree v, this also implied the major wave (C) has also ended there, hence major correction has commenced from there with (A) leg unfolding in its lower degree wave c which has possibly ended at 145.69. Under this count, A-B-C wave (B) has commenced with A leg ended at 136.23, wave B at 143.79 and wave C has possibly ended at 149.79.
Our larger degree count is that the decline from 139.26 is wave (C) and is sub-divided into a diagonal triangle i-ii-iii-iv-v with wave i - 105.44, wave ii- 123.33, wave iii - 97.03, wave iv - 111.43, followed by the final wave v as well as the end of wave (C) at 94.12, this also mark the bottom of larger degree wave B. Under this count, major rise in wave C has commenced as an impulsive wave with minor wave III ended at 145.69, wave V is still in progress for further gain to 150.00. Having said that, this so-called wave V could well be the first leg of larger degree 5-waver wave C and this wave C should bring at least a retest of wave A top at 169.97 (July 2008).
DAX Slips On North Korea Tensions
The DAX index is down considerably in the Wednesday session. Currently, the DAX is trading at 12,787.00, down 0.86% on the day. On the release front, it is a quiet day, with no German or Eurozone events. There are no major indicators until Friday, when Germany and the US release inflation reports.
Global stock markets are down on Wednesday, in response to rising tensions between the US and North Korea. The renegade state has reacted furiously to new sanctions imposed by Washington, and has threatened to attack Guam, which is a major US military base. President Donald Trump is taking a tough line on North Korea, and has promised that any aggression from North Korea will be met with “fire and fury.” With Trump and North Korean President Kim Jong-un on a possible collision course, risk appetite has decreased, as investors have snapped up gold, a traditional safe-haven asset.
German indicators started off the week on a sour note, as Industrial Production recorded a sharp decline of 1.1%. However, there was better news on Tuesday, as the trade surplus rose to EUR 21.2 billion, its highest level in 2017. Last week’s indicators were solid and continue to point to an expanding German economy. Retail Sales jumped 1.1%, its second-highest gain in 2017. Factory Orders gained 1.0%, while unemployment claims dropped 9 thousand – the employment indicator has declined every month in 2017, except one. Although manufacturing and services PMIs dipped in July, both are well over the 50-level, indicative of expansion. Are the strong German numbers too much of a good thing? Some analysts think so, and are cautioning that the German economy is in danger of overheating. Still, there’s no arguing that the eurozone economy has received a boost from the robust German economy. Eurozone GDP gained 0.6% in the second quarter, up from 0.5% in the previous quarter. As well, Eurozone Retail Sales gained 0.5%, marking a 4-month high.
While the euro has posted impressive gains of late, it has been the opposite story for the US dollar. Paralysis in Washington is weighing on the greenback, as Donald Trump’s antics and inability to pass healthcare legislation has increased political risk in the US. As well, the Federal Reserve’s monetary policy remains unclear. Earlier this year the Fed strongly hinted that it planned to raise rates three times in 2017, but has only pressed the rate trigger twice. In June, Fed Chair Janet Yellen shrugged off low inflation, saying that it was due to “transient” factors, leaving the impression that the Fed still planned one final hike. However, inflation has not improved and the Fed has changed its tune. Last week, St. Louis Federal Reserve President James Bullard said he opposed further Fed hikes, warning that another hike would actually delay inflation from hitting the Fed’s target of 2%. The markets have become more skeptical about a rate hike in December, as the odds have fallen to 34%, compared to 43% a week ago.
Aussie Dollar Riding Downtrend Channel Vs US Dollar
Key Highlights
- The Aussie Dollar failed to hold the 0.8000 level against the US Dollar and moved down.
- The AUD/USD pair is currently following a descending channel with resistance at 0.7900 on the 4-hours chart.
- Australia's Home Loans in June 2017 increased by 0.5%, less than the forecast of 1.5%.
- Australia's Westpac Consumer Confidence for August 2017 declined 1.2%, compared with the last +0.4%.
AUDUSD Technical Analysis
The Aussie Dollar after an impressive run towards 0.8060 against the US Dollar formed a medium-term top. The AUD/USD pair declined lately and currently riding a downtrend channel with support at 0.7850.
Looking at the 4-hour chart, there is a descending channel with resistance at 0.7900. The pair is trading well below the 0.8000 handle the 100 simple moving average (H4), which is a bearish sign.
On the upside, the channel resistance is near the 50% Fib retracement level of the last decline from the 0.7942 high to 0.7853. Therefore, the 0.7890-0.7900 area is a major hurdle an upside move.
On the downside, the pair is trading near a crucial pivot of 0.7870-0.7850. The mentioned levels are key supports, but buyers need to take the pair above 0.7900 for a bounce back.
Overall, the pair may correct higher, but it won't be easy for AUD/USD to close above 0.7900.
Australia's Home Loans
Recently in Australia, the Home Loans figure for June 2017 was released by the Australian Bureau of Statistics. The market was aligned for an increase of 1.5% compared with the previous month.
However, the actual result was disappointing, as the increase in loans was 0.5%. On the other hand, the last reading was revised up from +1% to +1.1%. The worst part was a decline of 0.9% in investment housing commitments.
The report added that:
In trend terms, the number of commitments for the construction of dwellings rose 1.9% and the number of commitments for the purchase of new dwellings rose 1.3%, while the number of commitments for the purchase of established dwellings fell 0.5%.
The AUD/USD pair recovered a few pips during the past two sessions, but faces a major hurdle on the upside at 0.7900-0.7910.
Today's NY session will see the release of the Non-farm Productivity (Q2 2017) (Prelim) by the Bureau of Labor Statistics of the US Department of Labor. The forecast is +0.7% compared with the last 0%. The Unit Labor Cost is forecasted to increase by 1.2% in Q2 2017 (Prelim), less than the last +2.2%.
Trade Idea: AUD/USD – Target met and stand aside
AUD/USD – 0.7873
Recent wave: Wave 5 ended at 1.1081 and major correction has commenced for fall to 0.7000 and then towards 0.6500-10
Trend: Near term up
Original strategy :
Sold at 0.8030, met target at 0.7880
Position: - Short at 0.8030
Target: - 0.7880
Stop: -
New strategy :
Stand aside
Position: -
Target: -
Stop:-
As aussie has fallen again after brief recovery to 0.7943, adding credence to our bearishness and our short position entered at 0.8030 finally met our downside target at 0.7880 (with 150 points profit), outlook remains mildly bearish for the erratic fall from 0.8066 top to bring retracement of recent rise in wave iv, hence weakness to 0.7839 (previous resistance tuned support) is likely, however, downside should be limited to 0.7786 and price should stay well above wave i top at 0.7712.
As we have taken profit on our short position entered at 0.8030, would not chase this fall here and would be prudent to stand aside for now. On the upside, expect recovery to be limited to 0.7940-45 and bring another decline later. Only break of indicated resistance at 0.7980 would suggest low is formed, bring a stronger rebound to 0.8000, then towards 0.8043 resistance, break there would signal the pullback from 0.8066 top has ended instead, bring retest of this level first. We are keeping our latest bullish count that recent impulsive waves is unfolding as (1 2, (i)(ii), i ii) and may extend headway towards 0.8150.
On the 4-hour chart, the move from 0.8066 is the wave 5 with i: 0.8860, ii: 0.8315, wave iii is an extended move ended at 1.0183, iv: 0.9706 and wave v has ended at 1.1081 (also the top of entire wave 5). The subsequent selloff is the major correction which is unfolding as ABC-X-ABC and 2nd A leg has ended at 0.8848, followed by a-b-c wave B which ended at 0.9758, hence, 2nd C wave is now in progress and indicated downside target at 0.7000 and 0.6950 had been met, so further fall to 0.6710-20 cannot be ruled out.

Foreign Exchange Market Commentary: EUR/USD, USD/JPY, GBP/USD, GOLD, WTI CRUDE, DJIA, FTSE100, DAX
EUR/USD
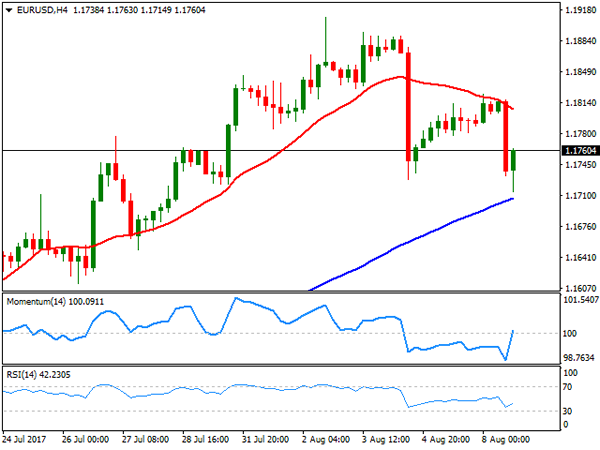
After a dull start to the day, the greenback gather upward momentum against all of its major rivals after Wall Street's opening, with EUR/USD's decline extending down to 1.1714 before bouncing to settle around 1.1760. The US released some minor macroeconomic figures, all of them encouraging. The NFIB Index of Small Business Optimism rose 1.6 points to 105.2 in July, above June's 103.6, whilst the IBD/TIPP Economic Optimism for August climbed to 52.2 above previous 50.2, also above the 12-month average of 51. Additionally, the number of jobs´ openings increased to 6.163 million in June, beating expectations and at an all time high. Dollar's gains were exacerbated by thin trading conditions, with the currency ending the day mixed across the board.
The EUR/USD pair has bounced from a critical static support the 2015 yearly high which was set at 1.1713, and the 4 hours chart shows that it stands now well below a bearish 20 SMA, after the indicator contained advanced all through the day. Technical indicators in the mentioned time frame have bounced with different strength with the Momentum heading higher around its mid-line, but the RSI indicator holding near oversold levels, indicating that the risk remains towards the downside, particularly if the mentioned support gives up. A break below the mentioned level will open doors for a steeper correction, although seems unable that the dollar could advance much more ahead of Friday's inflation release in the US.
Support levels: 1.1715 1.1680 1.1630
Resistance levels: 1.1785 1.1820 1.1860
USD/JPY
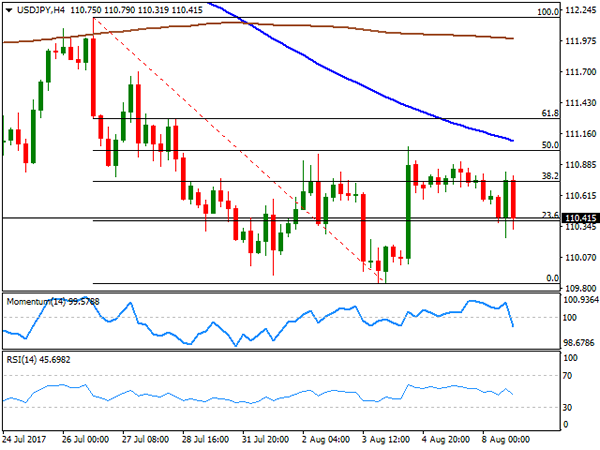
The USD/JPY pair ended the day in the red around 110.40, having quickly reverted an advance up to 110.82, this last triggered by strong US employment data, as the number of open jobs reached a record high of 6.16 million at the end of June, up 461,000 from May and exceeding the expected 5.6 million. Anyway, the pair resumed its decline afterwards, retaining the bearish bias seen over the last few weeks. The pair keeps trading within Fibonacci levels, trapped most of this Tuesday between the 23.6% and the 38.2% retracement of the latest daily decline between 112.18 and 109.84, with scope to test this last on a break below the daily low of 110.24. Technical readings in the 4 hours chart support such decline as the 100 SMA extended its slide above the current level, now around 111.10, while the Momentum indicator entered bearish territory with a strong bearish slope and the RSI indicator resumed its slide after failing to surpass its mid-line, currently at 46.
Support levels: 110.25 109.85 109.50
Resistance levels: 110.70 111.05 111.40
GBP/USD
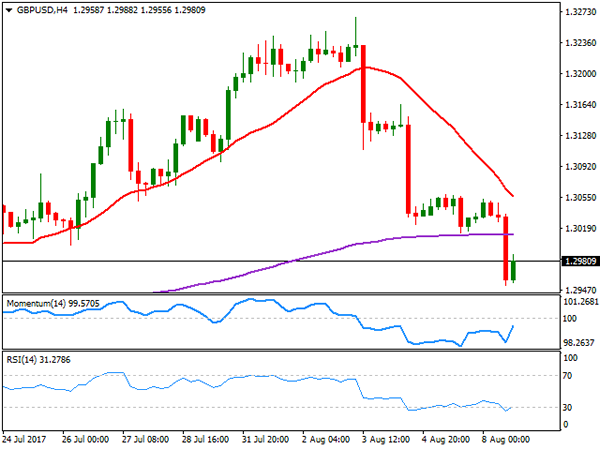
The GBP/USD pair plunged to 1.2952, as a bout of dollar's buying affected the most a weakened Pound, further extending after the pair broke the critical 1.3000 support. There were no macroeconomic releases in the UK, but the Sterling became vulnerable by the end of last week, when the BOE decided to remain on-hold, and somehow suggested that a rate hike for this year is out of the table. Adding to the bearish case of the British currency is the uncertainty surrounding Brexit, with negotiations being slow and painful, and with no signs of progress. From a technical point of view, the pair has scope to fall further as long as it holds now below the mentioned psychological level, and as long as news coming from the US don't result disappointing. In the 4 hours chart, the price settled below its 200 EMA for the first time in almost a month, while the 20 SMA accelerated its decline above the current level, now reinforcing the static resistance area around 1.3060. Technical indicators in the mentioned chart have managed to bounce from oversold readings, rather reflecting the late recovery than suggesting downward exhaustion, still holding within negative territory, limiting therefore chances of a recovery.
Support levels: 1.2965 1.2920 1.2880
Resistance levels: 1.3005 1.3030 1.3060
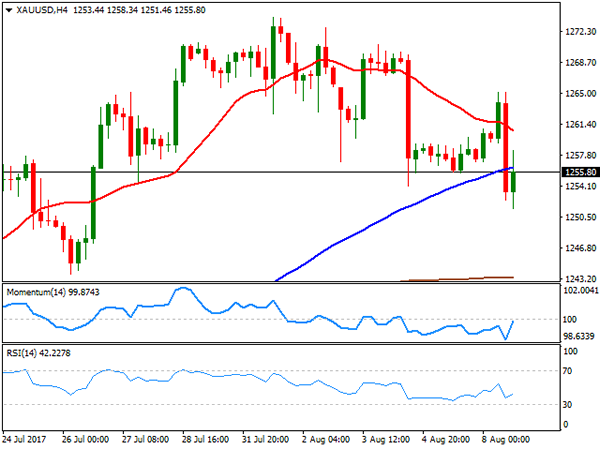
GOLD
Spot gold settled at $1,255.79 a troy ounce, the lowest in two weeks, as the market decided to give the greenback a vote of confidence after another solid local employment report, as the number of jobs' opening hit a record high in June. The figure came after a solid US employment report for July, and should keep the Fed in the tightening path, although no rate move is expected for September. The daily chart for gold indicates and increasing bearish potential, although further confirmations are required, as technical indicators are now hovering around their mid-lines, with diminished downward strength, whilst the price settled around its 20 DMA after briefly falling below the 100 DMA. In the 4 hours chart, the price settled below both, the 20 and 100 SMAs, with the shortest gaining bearish traction, in line with further declines, whilst technical indicators have managed to bounce within negative territory, still unable to re-enter bullish ground.
Support levels: 1,251.46 1,243.75 1,235.22
Resistance levels: 1,260.10 1,267.60 1,274.05
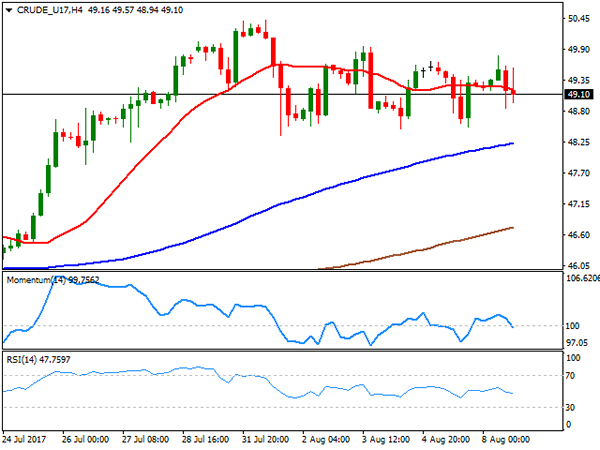
WTI CRUDE OIL
West Texas Intermediate crude futures settled at $49.10 a barrel, down for a second consecutive day, reverting early gains on news indicating that some OPEC producers increased their output in July, with crude oil exports from the OPEC reaching a record high in July mostly due to Nigeria and Libya exports, both exempt from the agreement to limit production. Further weighing on the commodity were news showing that Libya's biggest oil field, Sharara, came back online after a short interruption on Monday. Ahead of the release of US stockpiles data, the commodity remains within a consolidative phase below the key 50.00 level, with the daily chart showing that technical indicators are retreating within positive territory, as the price remains trapped between its 100 and 200 SMAs. In the shorter term, and according to the 4 hours chart, the technical stance is neutral-to-bearish with the price a few pips below a directionless 20 SMA and technical indicators heading modestly lower within neutral territory.
Support levels: 48.50 47.90 47.20
Resistance levels: 49.65 50.20 50.85
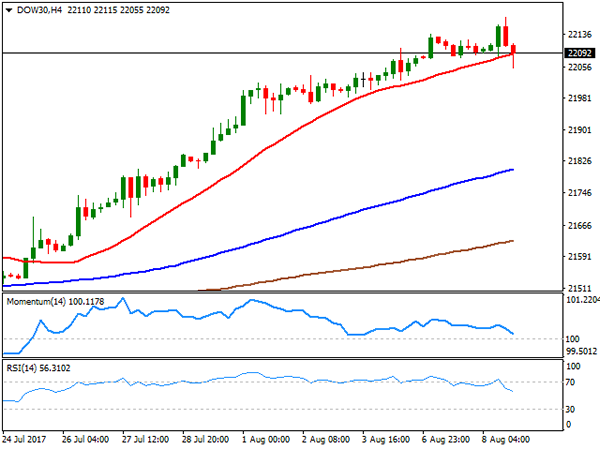
DJIA
Having struggled around their opening levels for most of the day, US indexes finally turned south and closed in the red, amid a stronger dollar, and with healthcare and material stocks leading the way lower. The Dow Jones Industrial Average turned red after nine record closes, settling at 22,85.34, down by 33 points, while the Nasdaq Composite shed 13 points to 6,370.46. The S&P closed 6 points lower, at 2,474.92. Within the Dow, Apple was the best performer, adding 0.86%, followed by Chevron that added 0.61%. Leading decliners was El du Pont, down 0.84%, followed by Merck that shed 0.82.%. From a technical point of view, the daily chart shows that the index remains far above all of its moving averages that remain bullish, while technical indicators began correcting lower, still within overbought territory. In the 4 hours chart, the index settled a few points below its 20 SMA, whilst technical indicators have extended their declines within positive territory, now about to enter negative territory, supporting a bearish extension for this Wednesday that anyway will be seen as corrective after the latest record rally.
Support levels: 22,055 22,001 21,967
Resistance levels: 22,055 22,080 22,137
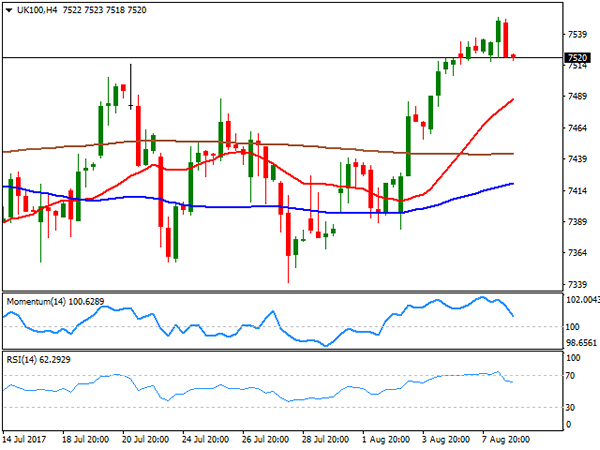
FTSE100
The FTSE 100 continued advancing this Tuesday, up 10 points to end at 7,542.73, not far below its previous record close of 7,547. A weaker Pound kept mood high among local investors, even despite earnings reports were not that encouraging. Paddy Power Betfair led decliners for a second consecutive day, down 4.11% after the bookmaker said it had suffered from "adverse sports results" in recent months, followed by InterContinental Hotels Group, down 3.99% on the day after reporting a slowdown in revenue growth. Taylor Wimpey, on the other hand, was the best performer, adding 1.93%. The index retreated in after hours trading following a late decline in US equities, heading into the Asian opening around 7,514, and with the daily chart showing that technical indicators turned lower within positive territory, as the index remains above its moving averages, these lasts, limiting chances of a steeper decline. In the 4 hours chart the index is also holding above all of its moving averages, with the 20 SMA retaining a strong bullish slope, yet technical indicators have turned sharply lower from overbought levels and are currently approaching their mid-lines, suggesting the index may extend its decline this Wednesday.
Support levels: 7,487 7,440 7,392
Resistance levels: 7,540 7,572 7,600
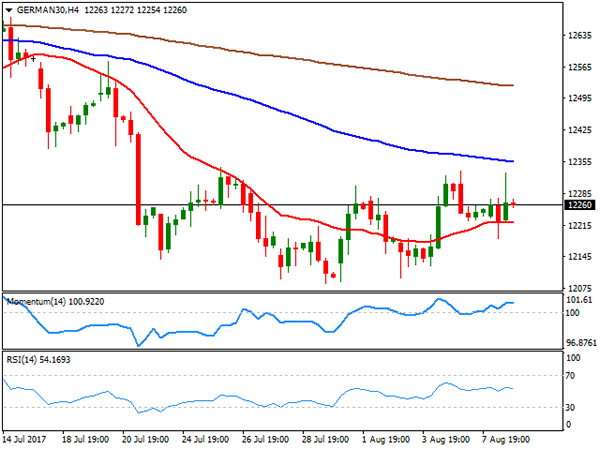
DAX
European equities trade mostly in the red, but the German DAX managed to shrug off the negative tone and settled at 12,292.05, up 35 points or 0.28%. Mood was undermined by poor Chinese and German trade data, as despite both economies presented wider-than-expected surplus, a decline in exports and imports triggered an alert. Helping European indexes to recover ground was EUR's weakness at the end of the session. Within the DAX, Continental was the best performer, adding 2.12%, followed by E.ON, still on the positive track and up by 1.91%. Banks gave back their Monday's gains, with Commerzbank leading decliners, down 1.29% and Deutsche Bank ending the day 0.58% lower. The index retains a negative tone according to the daily chart, as a bearish 20 DMA keeps capping advances, whilst technical indicators remain within negative territory, although lacking directional strength. In the 4 hours chart, the index settled above a horizontal 20 SMA but still below bearish 100 and 200 SMAs, whilst technical indicators also lack directional strength, but stand above their mid-lines.
Support levels: 12,210 12,174 12,128
Resistance levels: 12,275 12,323 12,381