Sample Category Title
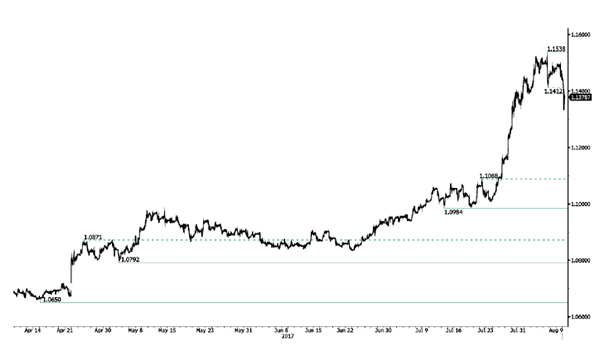
EUR/CHF Elliott Wave Analysis
EUR/CHF : 1.1327
EUR/CHF: Major wave 5 trough ended at 0.8426 and correction has commenced from there for subsequent gain towards 1.1400-1.1500.
Although the single currency extended recent rally to 1.1538 late last week, the subsequent sharp retreat suggests a minor wave iii has ended there, hence 1-2 weeks of consolidation below this level would take place in some form of wave iv, hence mild downside bias is for correction to 1.1250, however, reckon downside would be limited to 1.1185-90 (50% Fibonacci retracement of 1.0833-1.1538) and bring rebound later (tentatively minor b leg of wave iv) back to 1.1400, however, price should falter well below 1.1538 wave iii top, bring another corrective decline in c leg of wave iv later this month.
To recap our preferred count, the decline from 1.6828 (end wave (B)) is labeled as the beginning of wave (C) which should unfold as an impulsive move with 1: 1.5326, 2: 1.6377 and wave 3 is sub-divided into (i): 1.4300, (ii): 1.5880 and wave (iii) is still unfolding with (1): 1.4577, (2): 1.5448 and wave (3) is an extended 3rd with i: 1.5006, ii: 1.5383, wave iii: 1.3073, then wave iv ended at 1.3925 and wave v at 1.3073, wave (4) ended at 1.3925 and wave (5) has ended at 1.2765 which also marked the low of wave (iii) and wave (iv) has ended at 1.3835 and wave (v) as well as larger degree wave 3 has ended at 1.0075. The selloff from 1.2650 signals wave 4 has ended there and we are taking a view that the wave 5 could also have ended 0.8426, hence consolidation is seen with mild upside bias for rebound to 1.1000 first (already met), then towards 1.1400.
On the downside, whilst initial corrective fall to 1.1185-90 is likely, reckon downside would be limited and euro should stay well above 1.1100-05 (61.8% Fibonacci retracement of 1.0833-1.1538), bring upmove in wave v later (probably in late Q3). Only a drop below previous resistance at 1.0988 (wave i top) would abort and signal recent upmove has ended, bring correction to 1.0950, then 1.0900 but support at 1.0833 should remain intact.
Recommendation: Buy again at 1.1200 for 1.1400 with stop below 1.1100.
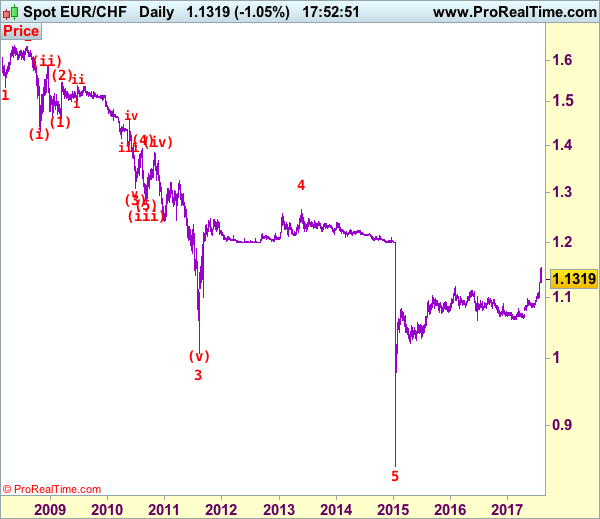
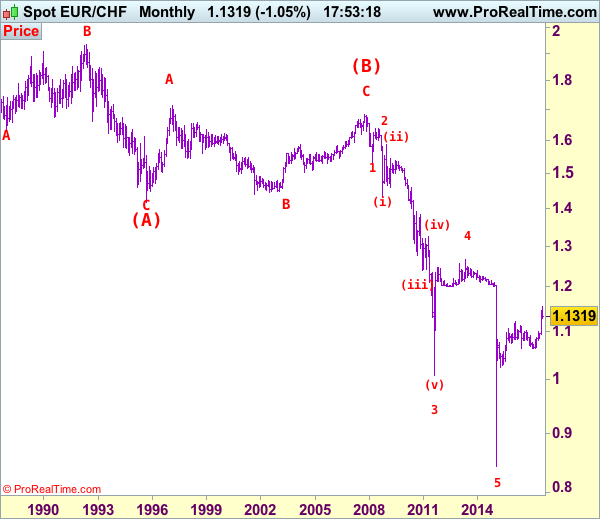
The long-term downtrend started from 1.9626 (Apr 1985) to 1.4166 (Sep 1995) is treated as wave (A) with A:1.6285 (Dec 1987), B: 1.9342 (May 1992) and C: 1.4166, then wave (B) ended at 1.6828 with A: 1.7147 (Feb 1997), B: 1.4398 (Sep 2001), C: 1.6828 (Nov 2007), therefore, wave (C) is now in progress with the breakdown indicated as above. This wave (C) already met indicated downside target at 1.1455/60 and 1.1300, it could have ended at 0.8426, consolidation with mild upside bias is seen for gain to 1.1000 and later towards 1.2000.
CRUDE OIL Ready To Push Higher
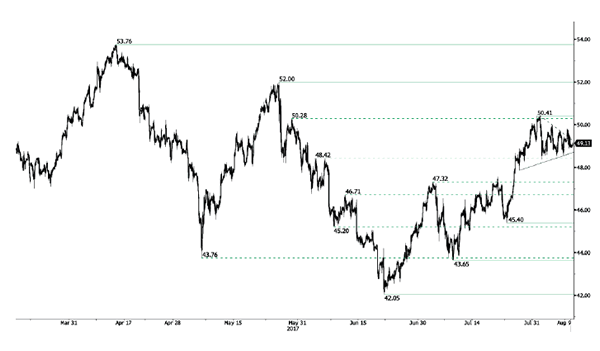
Crude Oil is trading higher. Hourly support is given at 47.86 (26/07/2017 low). Strong resistance can be found at 50.41 (31/07/2017). Expected to monitor resistance at 50.41 (31/07/2017 high).
In the long-term, crude oil has recovered after its sharp decline last year. However, we consider that further weakness are very likely. Strong support lies at 35.24 (05/04/2016) while resistance can now be found at 55.24 (03/01/2017 high).
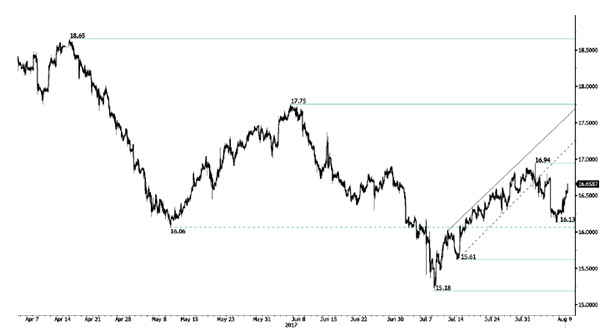
SILVER Bouncing Back
Silver's bullish pressures are back. Hourly resistance lies at 16.94 (02/08/2017 high). The commodity has set up a new support 16.13 (07/08/2017 high). Expected to edge higher.
In the long-term, the death cross indicates that further downsides are very likely. Resistance is located at 25.11 (28/08/2013 high). Strong support can be found at 11.75 (20/04/2009).
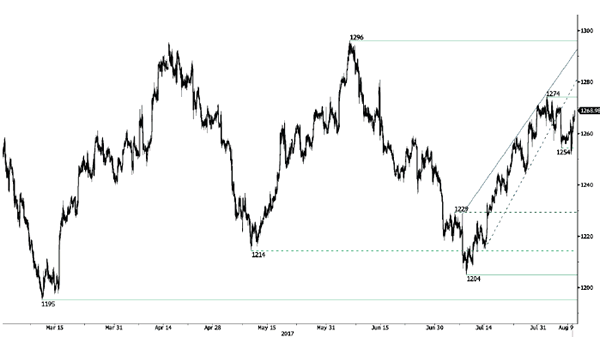
GOLD Trading Sideways
Gold is consolidating. Hourly support is given at 1251 (08/08/2017 low). Strong support is given at 1204 (10/07/2017 high). Hourly resistance is given at 1274 (01/08/2017 high). Expected to see further consolidation.
In the long-term, the technical structure suggests that there is a growing upside momentum. A break of 1392 (17/03/2014) is necessary ton confirm it, A major support can be found at 1045 (05/02/2010 low)
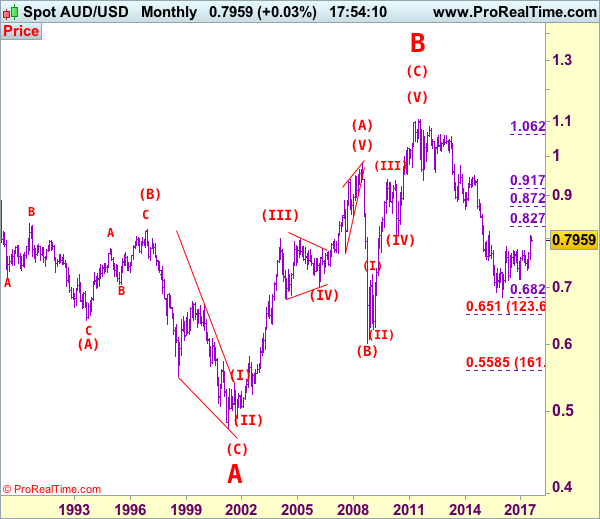
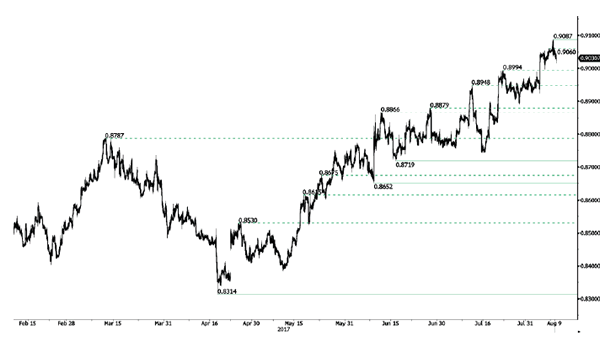
AUD/USD Elliott Wave Analysis
AUD/USD – 0.7888
AUD/USD – Wave 5 of C and (B) has possibly ended at 1.1081
Aussie has retreated again after faltering below resistance at 0.8066, retaining our view that further consolidation below this level would be seen and initial downside risk remains for pullback to 0.7815-20 (50% Fibonacci retracement of 0.7571-0.8066), however, reckon downside would be limited to 0.7800 and bring another rise later, above 0.7980 would signal the retreat form 0.8066 has ended, bring test of 0.8000, then towards said resistance, once this level is penetrated, this would extend medium term erratic rise from 0.6827 (2016 low) for retracement of early downtrend to 0.8100, then towards previous resistance at 0.8163.
We are keeping our count that top has been formed at 1.1081 (wave 5 of V) and major correction (A-B-C-X-A-B-C) has commenced, indicated downside targets at 0.7945 (61.8% Fibonacci retracement of entire rise from 0.6007-1.1081) and 0.7750 had been met and downside bias is seen for further weakness to 0.6800, then 0.6700 but reckon 0.6500 would hold from here.
Our preferred count is that the rally from 0.6007 to 0.7270 (7 Jan 2009) is marked as wave A, the retreat to 0.6248 (2 Feb 2009) is wave B and the subsequent upmove is labeled as wave C with wave (iii) and wave (iv) ended at 0.8265 and 0.7700 respectively and wave (v) as well as 3 ended at 0.9407, then wave 4 ended at 0.8066 (instead of 0.8578). The wave 5 has met our indicated projection target of 1.1060 and could ended at 1.1081, this level is now treated as the peak of wave (C) as well as larger degree wave B, hence major fall in wave C has commenced, our initial downside target at psychological support at 0.7000 has just been met and further weakness to 0.6500 would be seen later.
On the downside, whilst initial pullback to 0.7815-20 cannot be ruled out, reckon 0.7800 would limit downside and bring another rise later. Below 0.7760 (61.8% Fibonacci retracement of 0.7571-0.8066) would defer and suggest a temporary top is possibly formed, bring test of previous resistance at 0.7712 but only break there would provide confirmation, bring retracement of recent rise to 0.7650 first.
Recommendation: Buy at 0.7800 for 0.8000 with stop below 0.7700.

Our alternate count on the daily chart treated the top formed in 2008 at 0.9851 could be a larger degree wave I and was followed by a deep and sharp correction in wave II to 0.6007 and wave III is unfolding from there.
The long-term uptrend started from 0.4775 (2 Apr 2001) with an impulsive structure. Wave I is labeled as 0.4775 to 0.9851 (15 Jul 2008), wave II has ended at 0.6007 (Oct 2008) and wave III is still in progress which may extend further gain to 1.1265.
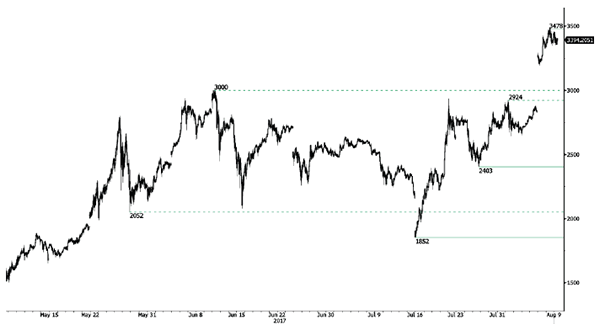
BITCOIN Stalling Below $3500
Bitcoin keeps on surging. Hourly resistance is given at 3478 (08/08/2017 high) and hourly support lies very far at 2403 (26/07/2017 low). The road is wide open for another bullish move.
In the long-term, the digital currency has had an exponential growth. There are decent likelihood that the asset will consolidate above $1500. Long-term support is given at $1464 (04/05/2017 low).
EUR/CHF Starting To Reverse
EUR/CHF has consolidated and short-term buying pressures are definitely back on . Hourly support located at 1.1412 (04/08/2017 low) has been broken. Expected to show continued weakness.
In the longer term, the technical structure has reversed. Strong resistance at 1.1200 (04/02/2015 high) has been broken. Yet,the ECB's QE programme is likely to cause persistent selling pressures on the euro, which should weigh on EUR/CHF. Supports can be found at 1.0184 (28/01/2015 low) and 1.0082 (27/01/2015 low)
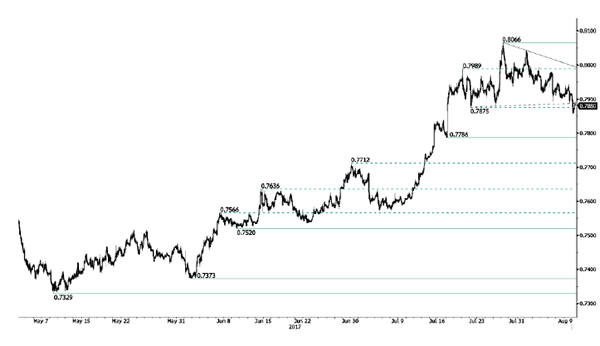
EUR/GBP Bullish Pressures Persist
EUR/GBP is trading around its highest levels of the year despite ongoing consolidation. Hourly resistance lies at 0.9087 (08/08/2017 high). Hourly support is given at a distance at 0.8742 (16/06/2017 low). Downside risks are nonetheless important.
In the long-term, the pair has largely recovered from recent lows in 2015. The technical structure suggests a growing upside momentum. The pair is trading above from its 200 DMA. Strong resistance can be found at 0.9500 psychological level.
AUD/USD Growing Selling Pressures
AUDUSD's short-term technical structure is bearish. Hourly resistance is given at 0.8066 (27/07/2017 high) while hourly support can be found at 0.7875 (21/07/2017 low). Expected to continued decline.
In the long-term, we are waiting for further signs that the current downtrend is ending. Key supports stand at 0.6009 (31/10/2008 low) . A break of the key resistance at 0.8295 (15/01/2015 high) is needed to invalidate our long-term bearish view.
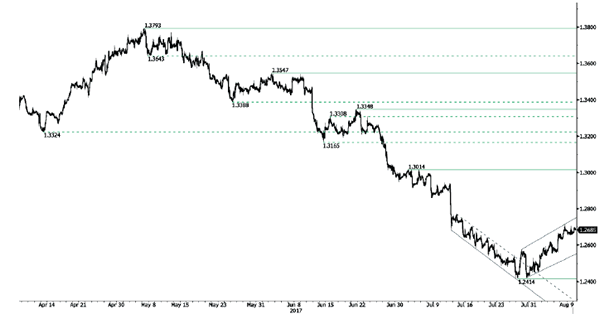
USD/CAD Short-Term Bullish Momentum Continues
USD/CAD's short-term bullish momentum continues. Hourly resistance is given at 1.2619 (03/08/2017) while support can be found at 1.2414 (27/07/2017 low). Expected to show continued consolidation above 1.2400.
In the longer term, the pair has broken longterm support that can be found at 1.2461 (16/03/2015 low) before bouncing back. Strong resistance is given at 1.4690 (22/01/2016 high). The pair should head further lower.