Sample Category Title
NFP Trading Idea
Fundamental review
Recent data signals a resilient US labor market:
- Weekly jobless claims dropped by 10,000 to 201,000 — the lowest level since February.
- The latest JOLTS report shows job openings hitting a six-month high, driven by business services.
According to Bloomberg, traders have now pushed back expectations for a Fed rate cut to July.
Given these indicators, the US economy appears stable rather than overheated, suggesting that the upcoming NFP could exceed forecasts — a bullish sign for the USD.
Trading ideas
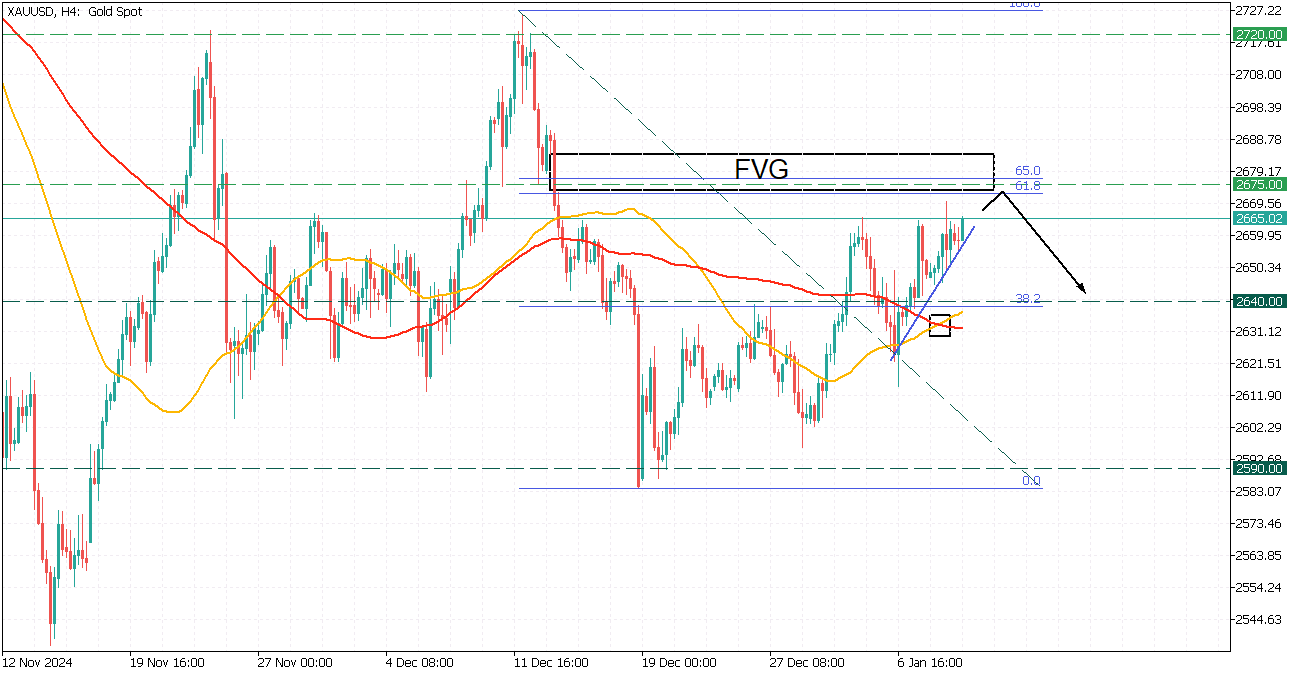
XAUUSD
XAUUSD is moving upwards, aiming to retest the FVG zone at the 2675 resistance level, aligned with the golden Fibonacci ratio. 50-MA crosses the 100-MA up, giving fuel for the short-term rise to the FVG with the further correction to the 2640 support at the 38.2 Fibonacci.
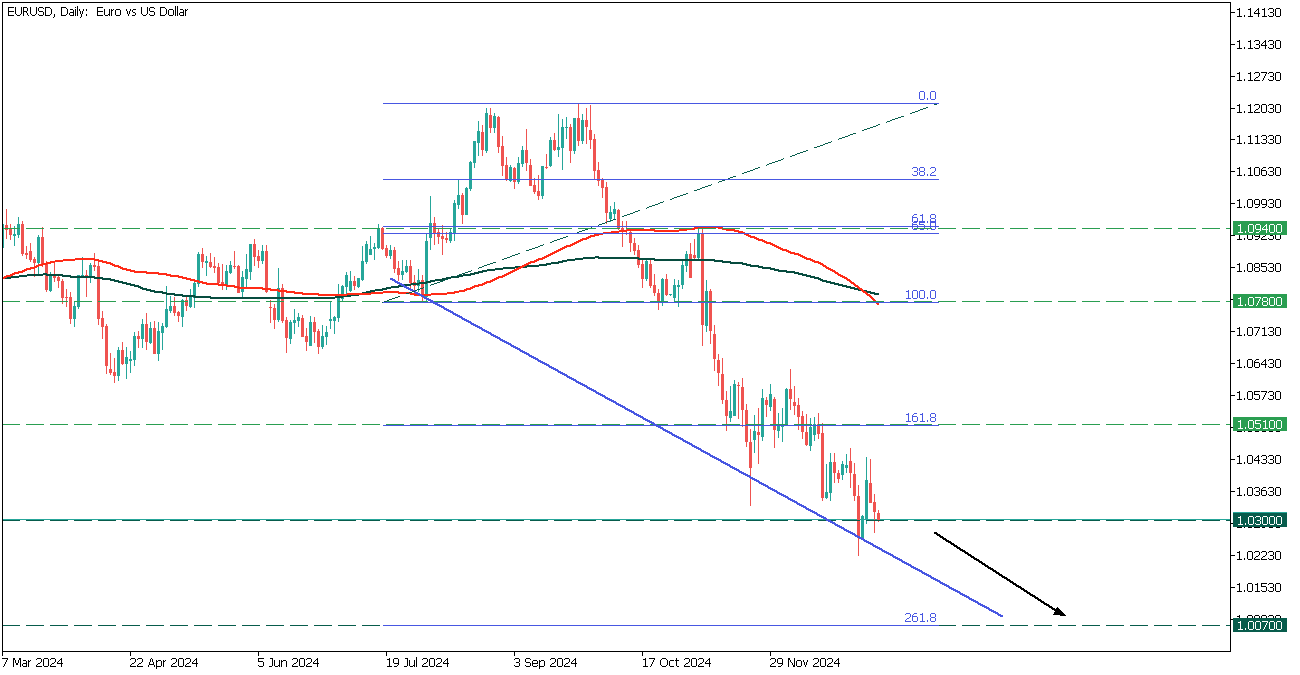
EURUSD
EURUSD navigates downwards within a trendline and is currently facing the 1.0300 support.
The 100-MA crosses the 200-MA down, giving a sign of a global downtrend for the Euro. The targets are 1.0070 at the 261.0 Fibonacci ratio.
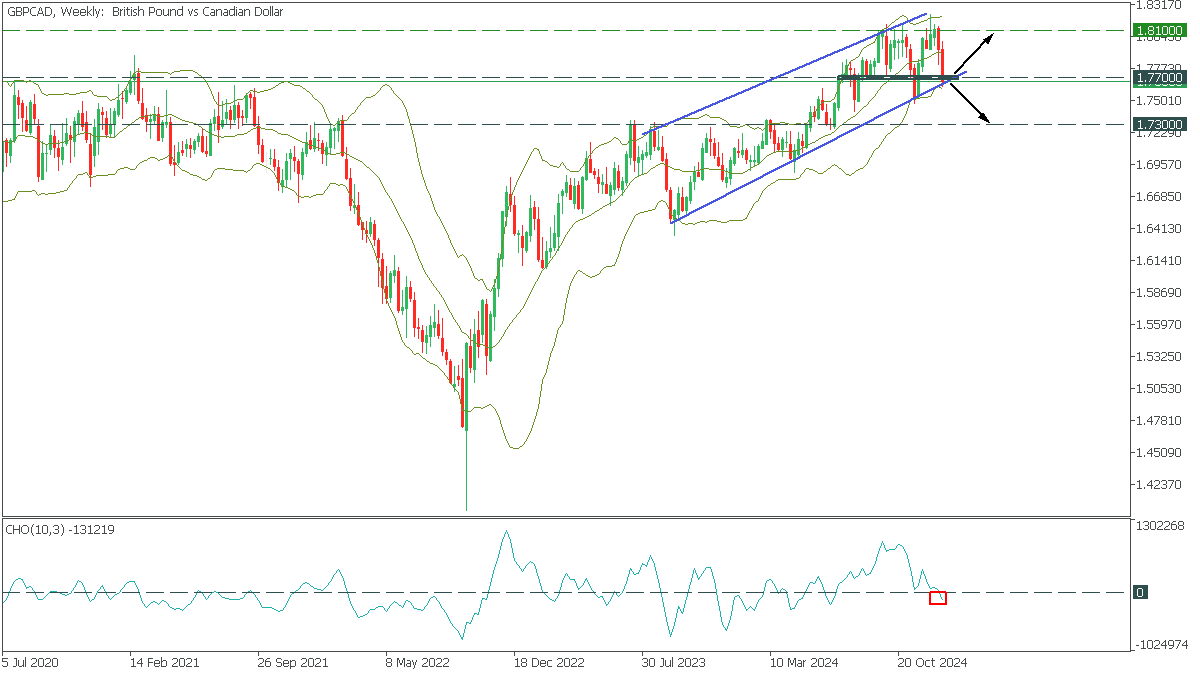
GBPCAD: Critical Moment
GBPCAD, Weekly
In the Weekly timeframe, GBPCAD has formed an ascending channel pattern. However, the price has fallen to the lower trendline, and the lower Bollinger line is being tested, indicating oversold conditions. The Chaikin indicator fell below 0, indicating bearish sentiment.
- A break of the trend line below 1.7700 will open the way to 1.7300;
- A rebound from the trendline will take GBPCAD back to 1.8100;
USD/JPY Hits New High, But Caution Lingers
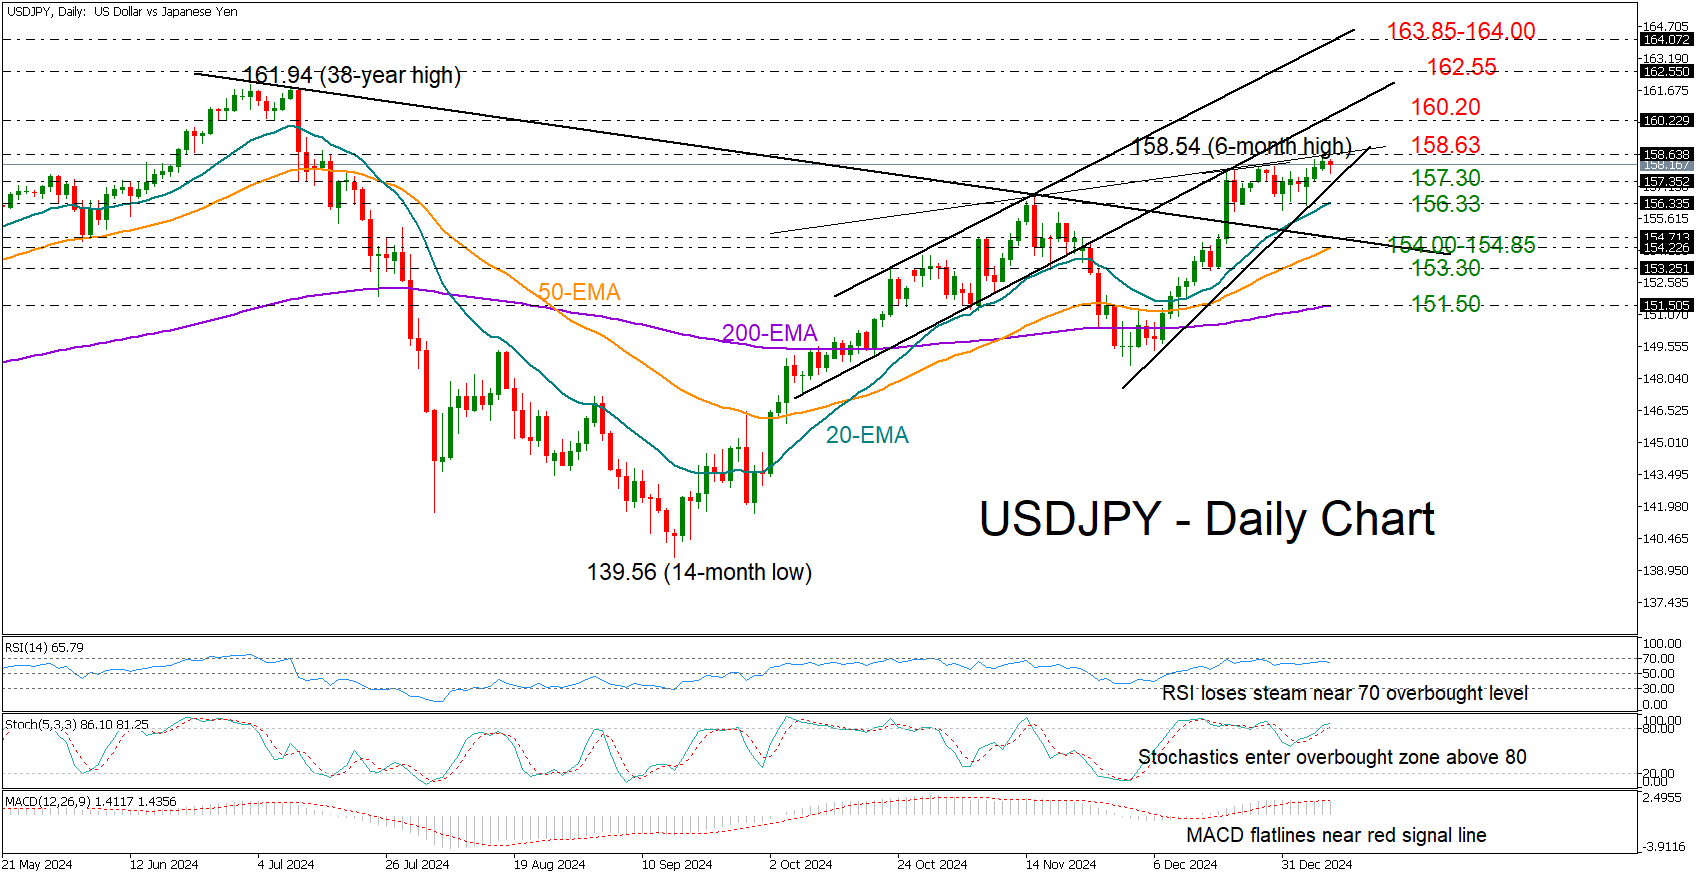
- USDJPY takes a pause after reaching a six-month high.
- Resistance at 158.63, Support between 156.33-157.30.
USDJPY has been steadily climbing over the past few days, hitting a six-month high of 158.54 on Wednesday. However, it couldn’t push past the resistance line formed by the November highs, suggesting the market is staying cautious for now.
With the RSI and stochastic indicators hovering near overbought levels, the pair could face a pullback or some sideways movement. The support trendline at 157.30 and the 20-day exponential moving average (EMA) at 156.33 could cool down selling interest in this case. Otherwise, the pair could drop toward the broken resistance trendline at 154.70, where the 50-day EMA is converging. If the 153.30 level is breached as well, selling pressures could pick up steam toward the 200-day EMA seen around 151.50.
On the upside, if the price closes decisively above 158.63, it could move toward the 160.20 mark, which was last seen in July and April 2024. Moving higher, the bulls may take a breather around 162.55 before heading for the 163.85-164.00 area, where a previous resistance trendline is located.
In short, USDJPY is still trending upward, but there are signs of caution. Sellers are unlikely to step in unless the price drops below 156.30.
GBP/USD: Hits New Multi-Month Low, Bears Eye 1.20 Zone Targets
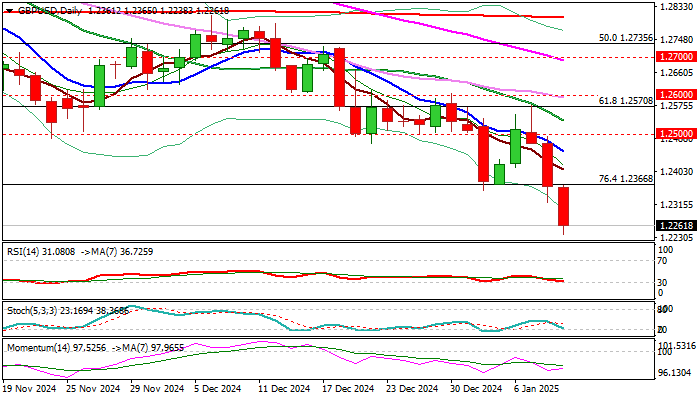
Cable fell to 14-month low on Thursday morning, as steep bear-leg off 1.2575 lower top extends into third straight day.
Strengthening dollar, crisis about Britain’s fiscal outlook and uncertainty over Trump’s tariff plan, were the key contributors to pound’s latest weakness.
Bearish technical picture on daily chart, as well as a number of weekly MA bear-crosses, add to negative near term outlook, with break below former low at 1.2299 (Apr 21) also generating a negative signal.
Bears eye targets at 1.2050 zone (Oct 2023 higher base) and psychological 1.2000 support, with limited corrective actions likely to precede fresh push lower.
Initial barrier lays at 1.2360 zone (broken Fibo 76.4% support) with extended upticks to stall under 1.2500 zone (former base / round figure) and offer better selling levels.
Res: 1.2360; 1.2400; 1.2455; 1.2500.
Sup: 1.2238; 1.2186; 1.2050; 1.2000.
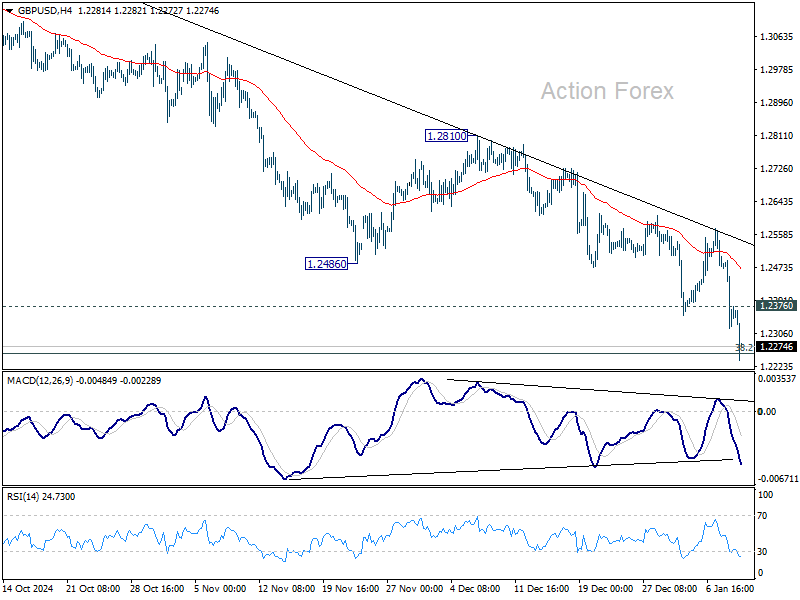
GBP/USD Daily Outlook
Daily Pivots: (S1) 1.2292; (P) 1.2393; (R1) 1.2465; More...
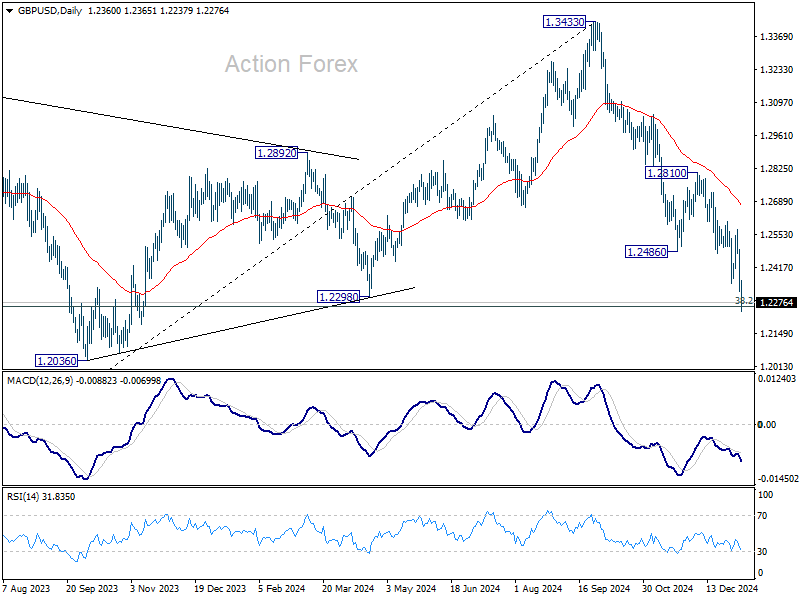
GBP/USD's fall from 1.3433 continues today and breached 1.2256 fibonacci level. There is no clear sign of bottoming yet and intraday bias stays on the downside. Sustained trading below 1.2256 will carry larger bearish implications. On the upside, break of 1.2376 will turn intraday bias neutral first. Further break of 1.2486 support turned resistance should confirm short term bottoming.
In the bigger picture, price actions from 1.3433 medium term are seen as correcting whole up trend from 1.0351 (2022 low). Strong support is still expected from 38.2% retracement of 1.0351 to 1.3433 at 1.2256 to bring rebound to extend the corrective pattern. However, firm break of 1.2256 will argue that the trend has reversed and target 61.8% retracement at 1.1528.
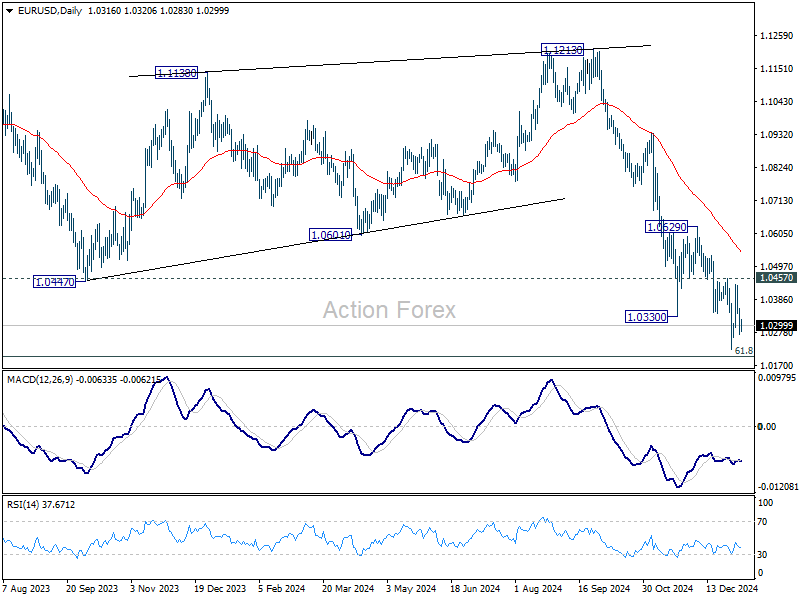
EUR/USD Daily Outlook
Daily Pivots: (S1) 1.0276; (P) 1.0317; (R1) 1.0361; More...
EUR/USD is still bounded in range trading above 1.0223 and intraday bias stays neutral. Outlook also stays bearish with 1.0457 resistance intact. Firm break of 1.0223 will resume the fall from 1.1213. However, sustained break of 1.0457 will confirm short term bottoming, and turn bias to the upside for 55 D EMA (now at 1.0542).
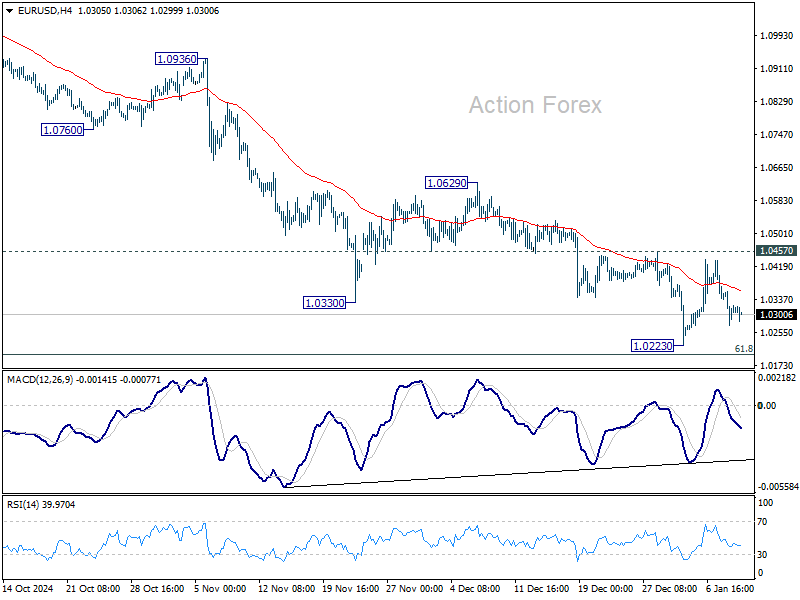
In the bigger picture, fall from 1.1274 (2023 high) should either be the second leg of the corrective pattern from 0.9534 (2022 low), or another down leg of the long term down trend. In both cases, sustained break of 61.8 retracement of 0.9534 to 1.1274 at 1.0199 will pave the way back to 0.9534. For now, outlook will stay bearish as long as 1.0629 resistance holds, even in case of strong rebound.
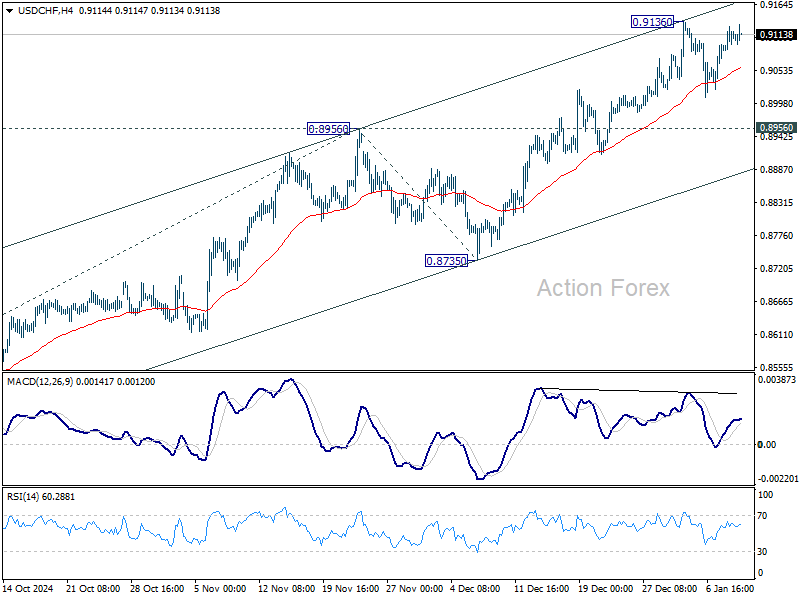
USD/CHF Daily Outlook
Daily Pivots: (S1) 0.9082; (P) 0.9106; (R1) 0.9134; More…
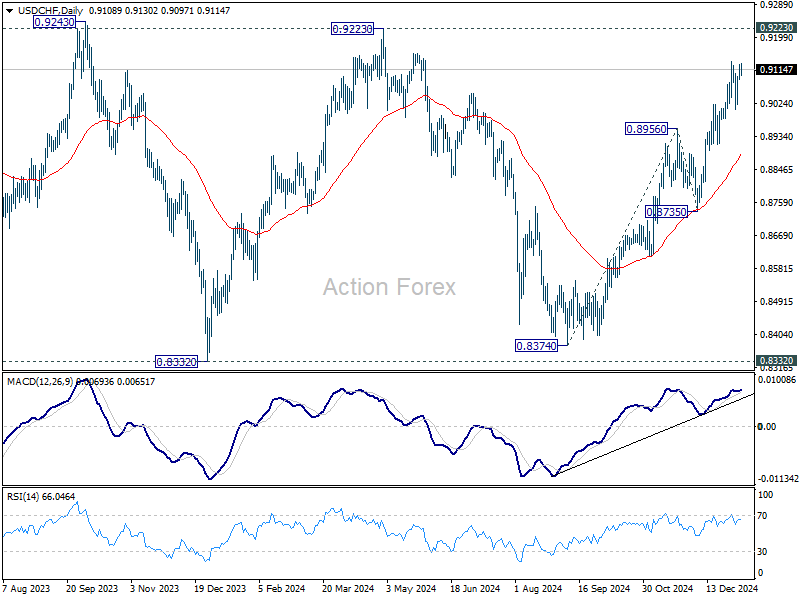
USD/CHF is still bounded in range below 0.9136 and intraday bias stays neutral. More consolidations could be seen below 0.9136 resistance. But further rally is expected as long as 0.8956 resistance turned support holds. Above 0.9136 will resume the rally from 0.8374 to 0.9223 key resistance next. However, firm break of 0.8956 will turn bias back to the downside for 55 D EMA (now at 0.8888).
In the bigger picture, price actions from 0.8332 (2023 low) are currently seen as a medium term corrective pattern, with rise from 0.8374 as the third leg. Overall outlook will continue to stay bearish as long as 0.9223 resistance holds. Break of 0.8332 low is in favor at a later stage when the consolidation completes. However, decisive break of 0.9223 will be an important sign of bullish trend reversal.
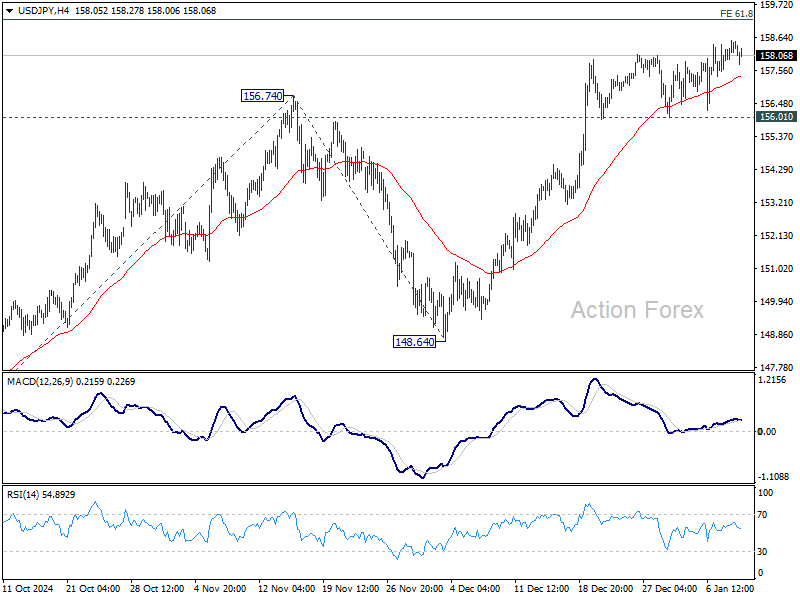
USD/JPY Daily Outlook
Daily Pivots: (S1) 157.99; (P) 158.27; (R1) 158.64; More...
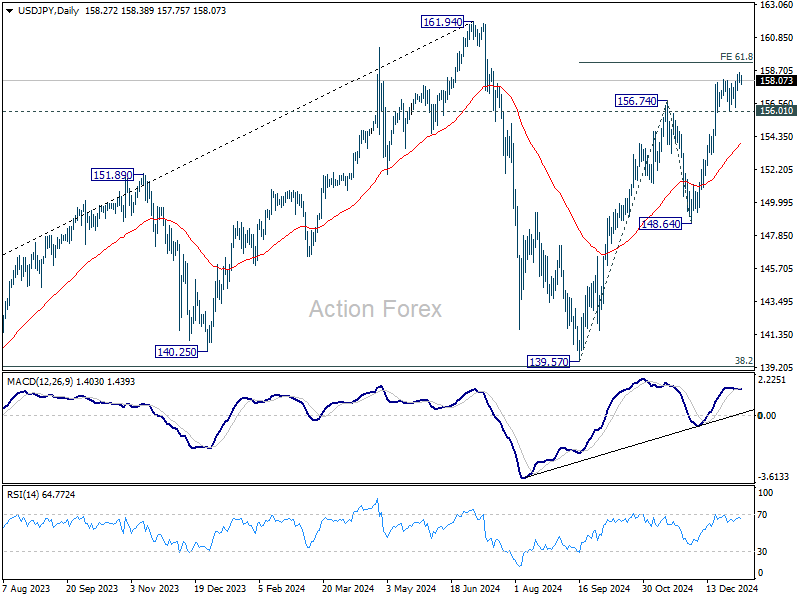
No change in USD/JPY's outlook and intraday bias stays mildly on the upside. Rise from 139.57 is still in progress for 61.8% projection of 139.57 to 156.74 from 148.64 at 159.25. Firm break there will e target 161.94 high. However, break of 156.01 support will indicate short term topping, likely with bearish divergence condition. Intraday bias will then be back on the downside for 55 D EMA (now at 153.98) instead.
In the bigger picture, price actions from 161.94 are seen as a corrective pattern to rise from 102.58 (2021 low). The range of medium term consolidation should be set between 38.2% retracement of 102.58 to 161.94 at 139.26 and 161.94. Nevertheless, sustained break of 139.26 would open up deeper medium term decline to 61.8% retracement at 125.25.
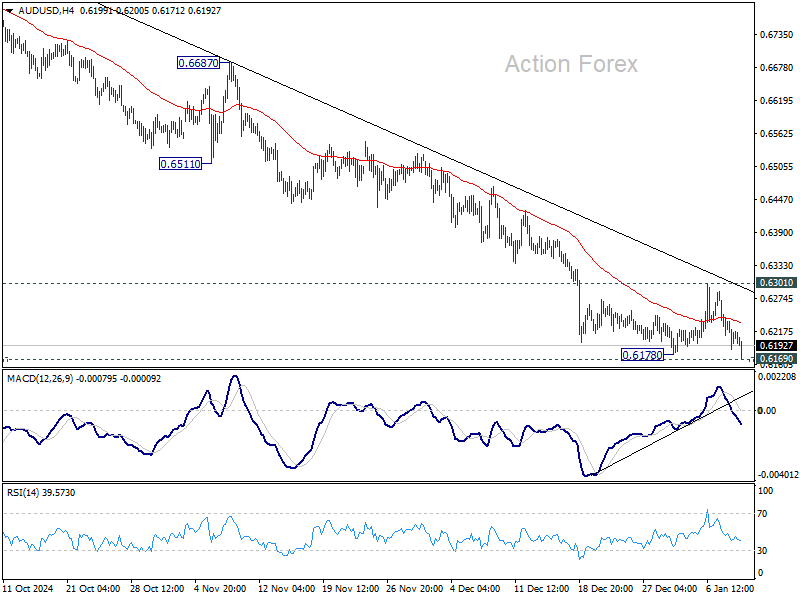
AUD/USD Daily Report
Daily Pivots: (S1) 0.6189; (P) 0.6215; (R1) 0.6243; More...
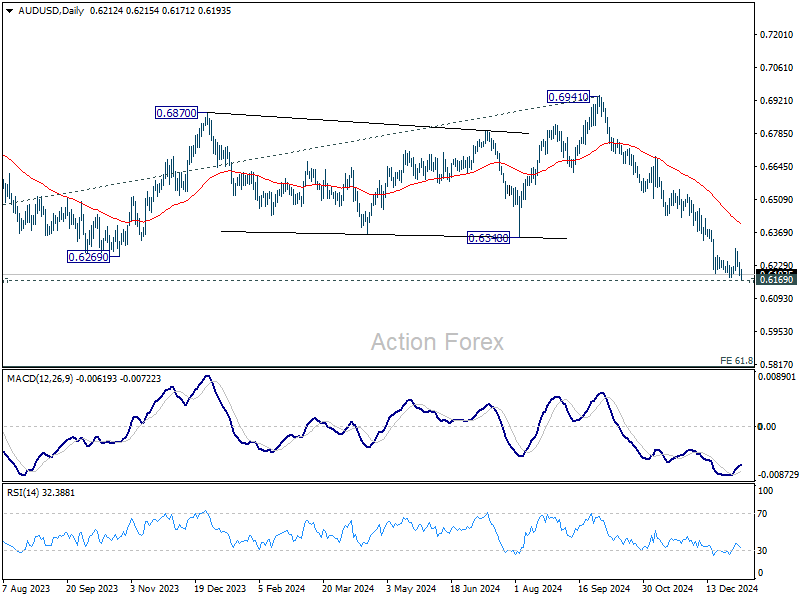
AUD/USD breached 0.6178 but stays above 0.6169 key support. Intraday bias remains neutral first. Further decline is expected as long as 0.6301 resistance holds. Firm break of 0.6169 key support will confirm larger down trend resumption. Nevertheless, break of 0.6301 resistance will turn bias back to the upside for stronger rebound to 55 D EMA (now at 0.6401).
In the bigger picture, price actions from 0.6169 (2022 low) are seen as a medium term consolidation to the down trend from 0.8006, and could have completed at 0.6941 already. Firm break of 0.6169 support will confirm down trend resumption for 61.8% projection of 0.8006 to 0.6169 from 0.6941 at 0.5806 next. In any case, outlook will stay bearish as long as 55 W EMA (now at 0.6587) holds.
USD/CAD Daily Outlook
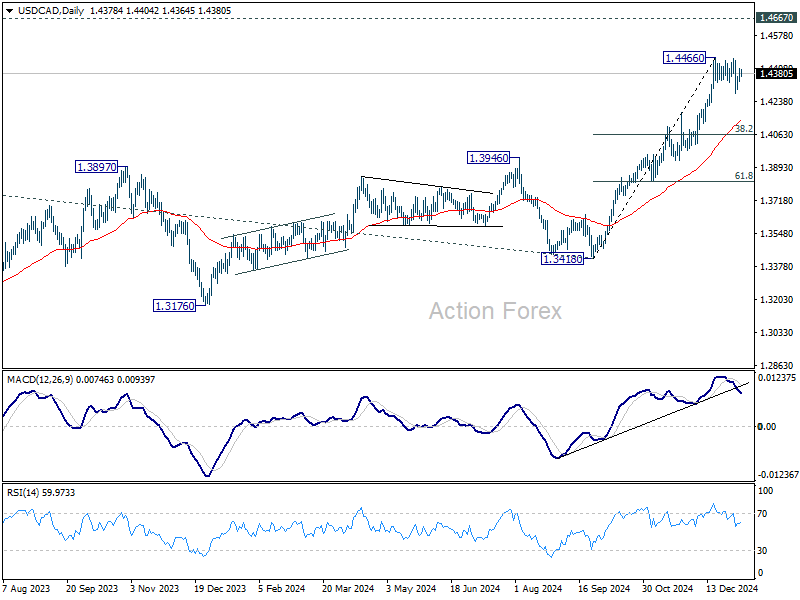
Daily Pivots: (S1) 1.4340; (P) 1.4375; (R1) 1.4411; More...
Intraday bias in USD/CAD Is turned neutral with current recovery. Consolidation from 1.4466 could still extend lower. But overall downside should be contained above 38.2% retracement of 1.3418 to 1.4466 at 1.4066 to bring rebound. On the upside, break of 1.4466 will resume larger up trend to 1.4667/89 key resistance zone.
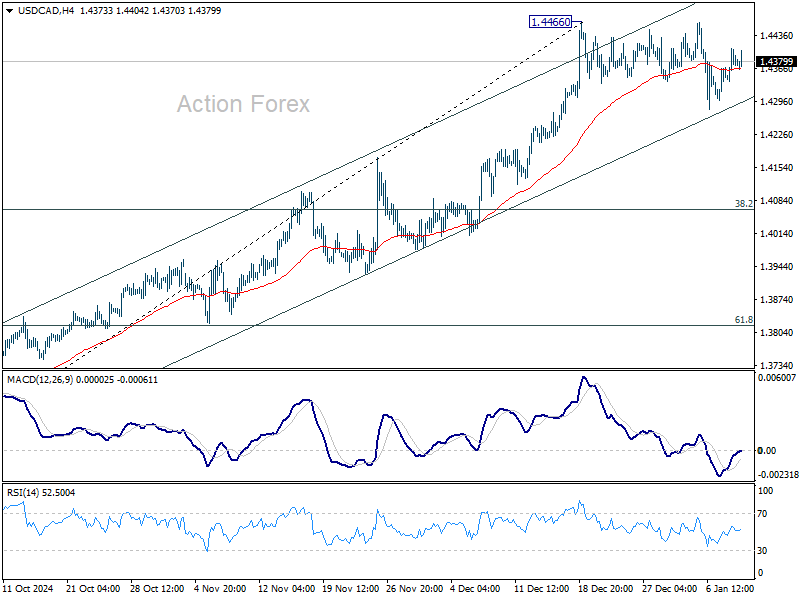
In the bigger picture, up trend from 1.2005 (2021) is in progress for retesting 1.4667/89 key resistance zone (2020/2015 highs). Medium term outlook will remain bullish as long as 1.3976 resistance turned holds (2022 high), even in case of deep pullback.