
Sample Category Title
Elliott Wave Analysis: Aussie And Its Bullish Scenario
AUDUSD is trading bullish since start of May, which gives us an idea that the bigger complex correction within blue wave B is completed. As such we may say that blue wave C of IV is now in motion, as viewed on the daily chart and it may reach levels near the former swing low at 0.8161 level, before make a new turning point lower.
AUDUSD, Daily
Below we have a 4h chart of AUDUSD, which shows us a nice bigger impulse in motion as part of blue wave C. We can see that waves 1) and 2) are already completed and the largest and steepest wave 3) is also showing some signs of a completion near the 0.8054 region. Well, if that is the case, then a new temporary correction into the following red wave 4) may follow in days ahead and later search for some support around the former black wave 4 and near the Fibonacci ratio of 38.2, where price can again bounce into final wave 5).
AUDUSD, 4H
GBP/USD Candlesticks and Ichimoku Analysis
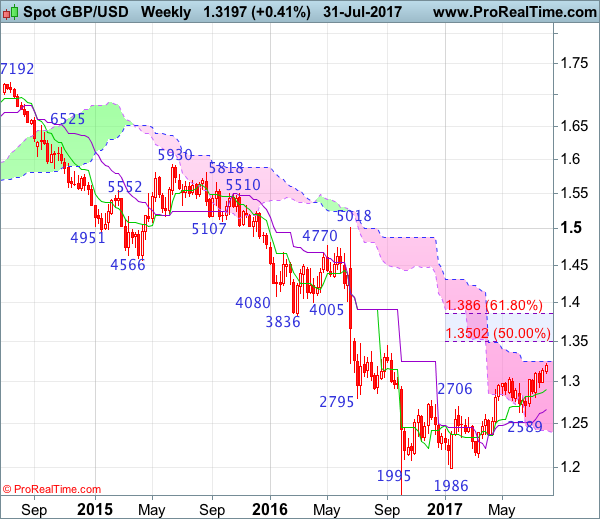
Weekly
• Last Candlesticks pattern: Long white candlestick
• Time of formation: 16 Jan 2017
• Trend bias: Down
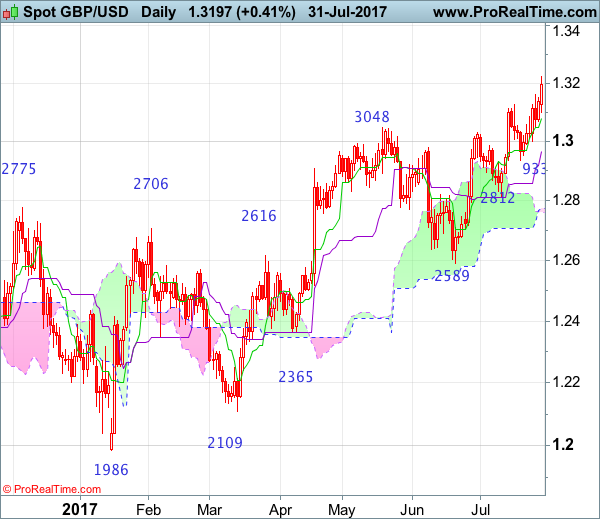
Daily
• Last Candlesticks pattern: Long white candlestick
• Time of formation: 18 Apr 2017
• Trend bias: Near term up
GBP/USD – 1.3193
Cable found renewed buying interest at 1.2933 and has resumed recent upmove, dampening our near term bearishness and upside risk remains for medium term rise from 1.1986 low to extend further gain to 1.3245-50 (61.8% projection of 1.1986-1.3048 measuring from 1.2589) and possibly 1.3300-10, however, near term overbought condition should prevent sharp move beyond resistance at 1.3425 and price should falter well below 1.3500-05 (50% Fibonacci retracement of 1.5018-1.1986), risk from there is seen for a retreat later.
On the downside, whilst pullback to 1.3095-00 cannot be ruled out, reckon the Tenkan-Sen (now at 1.3067) would hold and bring another rise later to aforesaid upside targets. Below 1.2950-55 would defer and risk test of support at 1.2999, then towards the Kijun-Sen (now at 1.2953), however, only a sustained breach below support at 1.2933 would abort and signal a temporary top is formed instead, bring retracement of recent upmove to 1.2890, then towards previous support at 1.2812 which is expected to contain downside.
Recommendation: Stand aside for this week.
On the weekly chart, the British pound has risen again after brief pullback just below 1.3000 level and the breach of resistance at 1.3126 signals the medium term rise from 1.1986 low is still in progress, hence upside bias is seen for this move to extend further gain to the upper Kumo (now at 1.3247), then 1.3300-10, however, near term overbought condition should limit upside to previous resistance at 1.3425 and reckon 1.3500-05 (50% Fibonacci retracement of 1.5018-1.1986) would hold, price should falter below 1.3670-75, bring another decline in Q4.
On the downside, although initial pullback to 1.3095-00 is likely, reckon downside would be limited to 1.3050-55 and said support at 1.2999 should hold, bring another rise later. A weekly close below 1.2999 would suggest a temporary top is possibly formed, bring test of 1.2933 support, break there would add credence to this view, then retracement of recent rise to the Tenkan-Sen (now at 1.2895) and later 1.2812 support would follow, however, downside would be limited to 1.2700-10 and price should stay well above support at 1.2589, bring a rebound later.
Forex Technical Analysis: EUR/USD, USD/JPY, GBP/USD
EUR/USD
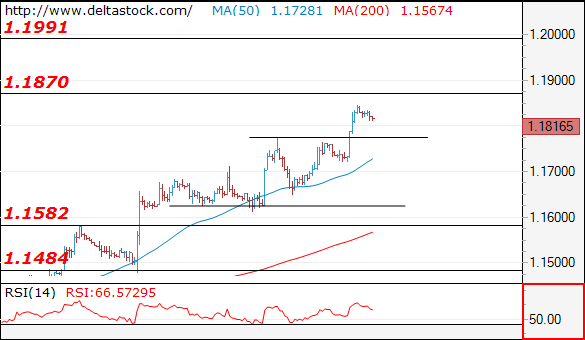
Current level - 1.1816
The recent break through 1.1775 shows, that the uptrend is intact, heading towards 1.1870, en route to 1.2000 sentiment area. Initial intraday support lies at 1.1775, followed by the crucial low at 1.1720.
| Resistance | Support | ||
| intraday | intraweek | intraday | intraweek |
| 1.1870 | 1.1870 | 1.1775 | 1.1580 |
| 1.1920 | 1.2000 | 1.1611 | 1.1480 |
USD/JPY
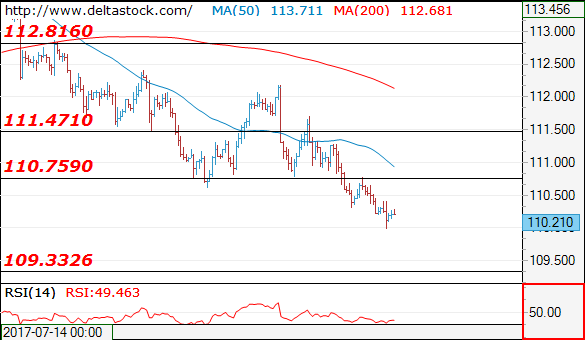
Current level - 110.20
The downtrend is still intact, heading towards 109.30 dynamic support. Key resistance lies at 110.75.
| Resistance | Support | ||
| intraday | intraweek | intraday | intraweek |
| 110.75 | 114.50 | 110.00 | 110.30 |
| 111.47 | 115.50 | 109.30 | 108.10 |
GBP/USD
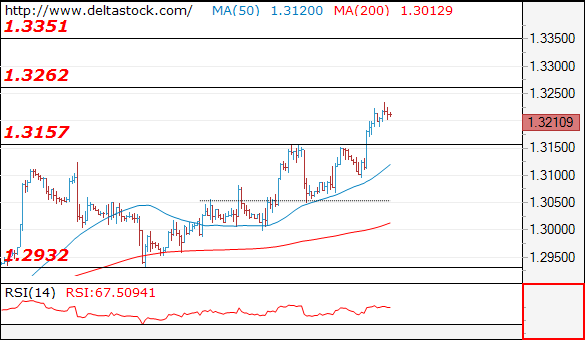
Current level - 1.3210
The bias is positive, for a rise towards 1.3260, en route to 1.3350 zone. Key static support lies at 1.3157 and crucial on the downside is 1.3050.
| Resistance | Support | ||
| intraday | intraweek | intraday | intraweek |
| 1.3260 | 1.3260 | 1.3157 | 1.2930 |
| 1.3350 | 1.3500 | 1.3050 | 1.2810 |
USD/CHF Candlesticks and Ichimoku Analysis
Weekly
• Last Candlesticks pattern: Shooting star
• Time of formation: 7 Mar 2017
• Trend bias: Sideways
Daily
• Last Candlesticks pattern: Morning star
• Time of formation: 9 May 2017
• Trend bias: Near term up
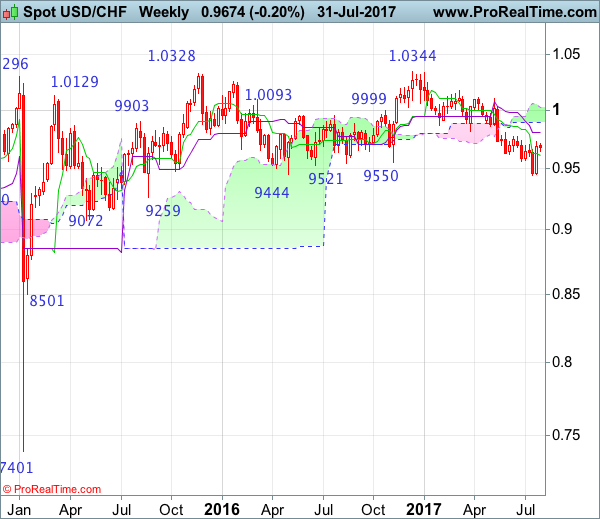
USD/CHF – 0.9467
Despite falling to 0.9438 last month, the subsequent stronger-than-expected rebound suggests a temporary low has been formed there and few weeks of consolidation above this level would take place and initial upside risk is seen for gain to 0.9769-71 (50% Fibonacci retracement of 1.0100-0.9438 and previous resistance), then towards 0.9800, however, as this move is viewed as retracement of recent decline, reckon upside would be limited to 0.9847 (61.8% Fibonacci retracement) and the upper Kumo (now at 0.9857) should hold, bring another decline later.
On the downside, whilst initial pullback to 0.9630-35 is likely, reckon the Tenkan-Sen (now at 0.9583) would limit downside and the greenback shall stage another rebound from there later. Only a drop below support at 0.9490 would abort and signal the rebound from 0.9438 has ended instead, risk retest of this level, once this support is penetrated, this would indicate recent decline from 1.0344 (2016 high) has resumed and extend weakness to 0.9390-00, then towards 0.9330-40.
Recommendation: Stand aside for this week

On the weekly chart, the greenback staged a strong rebound last week and a long white candlestick was formed, suggesting a temporary low is possibly formed at 0.9438 and consolidation with mild upside bias is seen for retracement of recent selloff, hence further gain to 0.9771 resistance would be seen, above there would bring test of the Kijun-Sen (now at 0.9805), however, reckon upside would be limited too 0.9845-50 (61.8% Fibonacci retracement of 1.0100-0.9438) and price should falter below the lower Kumo (now at 0.9894), bring another decline later.
On the downside, expect pullback to be limited to the Tenkan-Sen (now at 0.9605) and 0.9580 should hold, bring another rise later. Only a drop below support at 0.9490 would abort and suggest the rebound from 0.9438 has ended, bring retest of this level later. Once this recent low is penetrated, this would signal the decline from 1.0344 (2016 high) is still in progress and may extend weakness to 0.9350, then towards 0.9290-00, however, loss of near term downward momentum should prevent sharp fall below 0.9250 and reckon 0.9200-10 would hold from here, risk from there has increased for a rebound later.
Trade Idea : USD/CHF – Buy at 0.9600
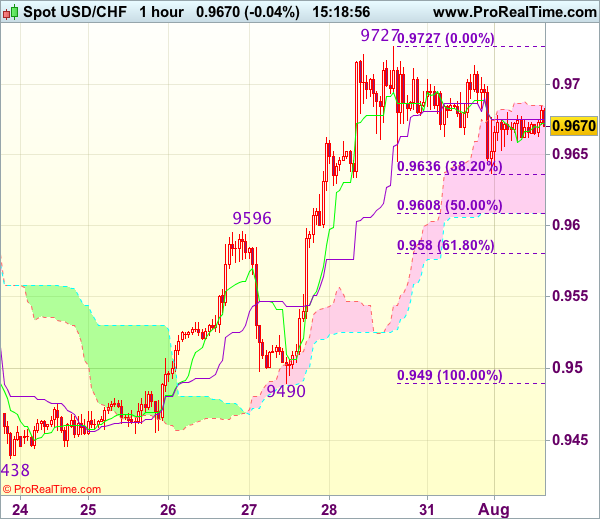
USD/CHF - 0.9679
Most recent candlesticks pattern : N/A
Trend : Near term up
Tenkan-Sen level : 0.9672
Kijun-Sen level : 0.9675
Ichimoku cloud top : 0.9684
Ichimoku cloud bottom : 0.9609
Original strategy :
Buy at 0.9600, Target: 0.9700, Stop: 0.9565
Position : -
Target : -
Stop : -
New strategy :
Buy at 0.9600, Target: 0.9700, Stop: 0.9565
Position : -
Target : -
Stop : -
Although the greenback has recovered after finding support at 0.9637 yesterday, reckon resistance at 0.9727 would limit upside and bring further consolidation below this level, hence risk of another retreat to 0.9635 (38.2% Fibonacci retracement of 0.9490-0.9727) remains, however, previous resistance at 0.9596 should turn into support and contain downside, bring another rise later, above said resistance at 0.9727 would extend recent rise to 0.9750-60, then 0.9780 but reckon 0.9800 would hold from here.
In view of this, would not chase this rise here and would be prudent to buy dollar on subsequent pullback as previous resistance at 0.9596 should turn into support and contain dollar’s downside. Below 0.9580 (61.8% Fibonacci retracement of 0.9490-0.9727) would defer and suggest a temporary top is formed instead, bring correction to 0.9540-50 but price should stay well above support at 0.9490, bring another rise later.

EUR/USD Analysis: Crosses Weekly R1 At 1.1815
The Euro is continuing to advance against the American Dollar in a rising wedge pattern. In the middle of Monday the currency pair created a second confirmation point for the bottom trend-line that is located slightly above the combined support level set up by the weekly PP, the 100% Fibonacci retracement level and the 55-hour SMA near 1.1714. Due to the 93-pip surge, the rate has easily bypassed the weekly R1 at 1.1815 and reached the pattern's upper boundary. Most likely, today the pair will try to get back to the 1.1789 and then 1.1749 levels, provided that it will manage to cross the above weekly R1. However, if experts' prognoses about the US ISM Manufacturing PMI will be confirmed, the pair might end the day in the opposite direction, i.e. near the weekly R2 at 1.1878.
GBP/USD Analysis: Starts Day Near 1.3200
Contrary to expectations, the currency exchange rate left a rising wedge formation in the northern direction straight through the weekly R1 at 1.3200. The reason behind such outcome is attributed to 54-pip surge in the middle of the day that matched with release of information of the US Pending Home Sales. It is difficult to project where the currency rate is going to move today because of announcement of the UK Manufacturing PMI at 8:30 GMT and then the US ISM Manufacturing PMI at 14:00. If the British and American data will justify forecasts, the currency rate might jump to the weekly R2 at 1.3264. In the opposite scenario, the fall should be delayed by the 20-hour SMA and, then fully stopped by the approaching 55- and 100-hour SMAs.
USD/JPY Analysis: Remains At Weekly S1
In the second half of Monday the American Dollar continued to move along the 20-hour SMA and the former triangle's upper resistance line. It did not make a fully-fledged rebound, nor did it not fall below the weekly S1 at 110.11. Generally, the pair is expected to continue to slide today in the southern direction. Firstly, because it experiences pressure from the above 20-hour SMA as well as from the approaching 55-hour SMA near 110.60. Secondly, because of reaction on announcement of information on the US ISM Manufacturing PMI that will be released at 14:00 GMT, provided that actual figures will match with experts' forecasts. However, the possible fall should not go beyond the weekly S2 that is located at the 109.50 level.
XAU/USD Analysis: Targets 1,278.96
After a notable surge on Friday, the last day of July the bullion spent in a steady horizontal movement against the American Dollar. Most likely, today the pair will continue to climb upstairs, supported by the accompanying 55-hour SMA from the bottom. In addition, the surge might be accelerated by announcement of the US ISM Manufacturing PMI at 14:00 GMT. This scenario is supported by the fact that the pair faces no resistance levels up until the combination of the 61.80% Fibonacci retracement level at 1,278.96 and the weekly R1 at 1,279.64. And barrier, most probably, will cause a trend reversal at least in the short-run. By the way, this resistance level coincides with the breakout point of a symmetrical triangle that has recently formed within the two week long ascending channel.
Dollar Hits 31-Month Low Against Euro, Aussie Gains Following RBA Statement
The US dollar hit a more than two-and-a-half-year low against the euro during yesterday's late session, with the euro breaching the 1.18 mark. The dollar index fell to its lowest level since May 2016, as it traded at 92.79. During the Asian session today, the US currency was broadly steady against most major currencies. The aussie gained following the Reserve Bank of Australia decision to keep its cash rate unchanged.
The US dollar plunged against most major currencies in yesterday's last session as the currency has been battling several headwinds. The departure of White House communications director Anthony Scaramucci added to the uncertainty over the US political outlook and pushed the dollar lower. This was the latest political issue that accumulated in July, following the failure of the repeal of Obamacare in the Senate, the departure and replacement of key White House staff and political controversies and investigations surrounding Trump's family and close aids. The dollar is now down more than 9% so far this year, its worst performance for the first seven months of the year since 1986 when it fell 12.5%. During the Asian session, the dollar was relatively steady against most majors with the dollar/yen pair at 110.20, euro/dollar at 1.1825 and pound/dollar at 1.3214.
The euro gained the most against the dollar linked to the greenback weakness but also due to traders buying the common currency on the back of month-end portfolio adjustments and expectations that the European Central Bank will start tightening monetary policy soon. The eurozone economy is doing better with unemployment falling to 9.1% in June while the core CPI figure, which excludes food and energy prices, rose 1.3% year-on-year – the highest since August 2013, the Eurostat report revealed yesterday.
Australia's central bank kept interest rates unchanged at 1.5% on expectations that the strengthening currency is going to subdue inflation and weigh on the growth outlook. Many economists expected this decision and are also now forecasting the central bank to remain dovish in its outlook until the economy is put on a sustainable footing. The RBA Governor Philip Lowe said “The higher exchange rate is expected to contribute to subdued price pressures in the economy…It is also weighing on the outlook for output and employment.' The aussie gained in early Asian trading, but was relatively flat at 0.7993 as European traders were starting the day.
In other forex moves, the pound was broadly flat against the dollar following yesterday's surge with the pair last trading at 1.3211. The New Zealand dollar was pressured against the greenback to last trade at $0.7496.
Looking at commodities, oil prices have continued to rise for more than a week on tightening US supply and possible sanctions against Venezuela. WTI was last trading at $50.29 a barrel while Brent was at $52.79. Gold prices held steady near seven-week highs early Tuesday, supported by a slump in the U.S. dollar and political uncertainty. The precious metal was last trading at $1,268.22 an ounce.