Sample Category Title
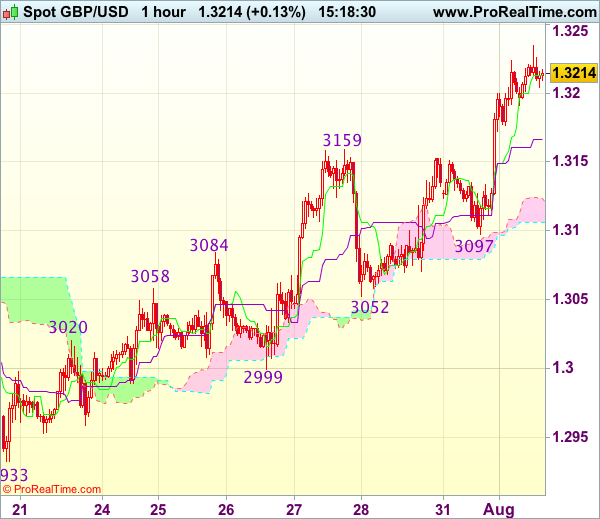
Trade Idea : GBP/USD – Buy at 1.3130
GBP/USD - 1.3209
Most recent candlesticks pattern : N/A
Trend : Near term up
Tenkan-Sen level : 1.3213
Kijun-Sen level : 1.3166
Ichimoku cloud top : 1.3123
Ichimoku cloud bottom : 1.3106
Original strategy :
Buy at 1.3130, Target: 1.3230, Stop: 1.3095
Position : -
Target : -
Stop : -
New strategy :
Buy at 1.3130, Target: 1.3230, Stop: 1.3095
Position : -
Target : -
Stop : -
Yesterday’s rally above previous resistance at 1.3159 confirms recent upmove has resumed and upside bias is seen for further gain to 1.3240-50, however, near term overbought condition should prevent sharp move beyond 1.3275-80 and reckon 1.3300-10 would hold from here, risk from there has increased for a retreat to take place later.
In view of this, would not chase this rise here and would be prudent to buy cable on pullback as the upper Kumo (now at 1.3123) should limit downside, bring another upmove later. Below 1.3105-10 would defer and risk test of support at 1.3097 but only break there would signal a temporary top is possibly formed, bring further fall towards previous support at 1.3052.
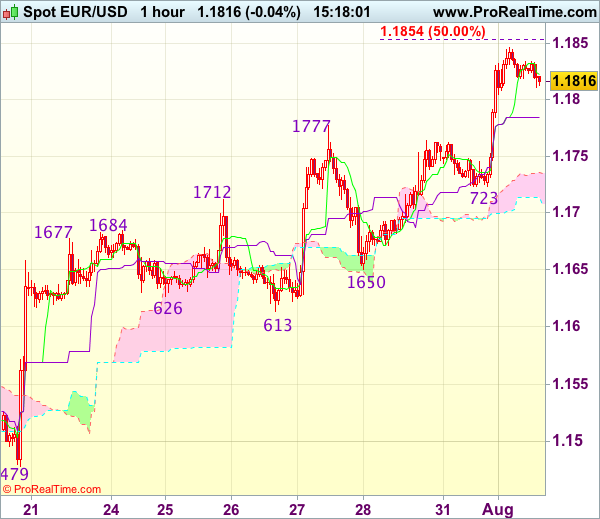
Trade Idea : EUR/USD – Buy at 1.1750
EUR/USD - 1.1813
Most recent candlesticks pattern : N/A
Trend : Near term up
Tenkan-Sen level : 1.1823
Kijun-Sen level : 1.1785
Ichimoku cloud top : 1.1736
Ichimoku cloud bottom : 1.1714
Original strategy :
Buy at 1.1750, Target: 1.1850, Stop: 1.1715
Position : -
Target : -
Stop : -
New strategy :
Buy at 1.1750, Target: 1.1850, Stop: 1.1715
Position : -
Target : -
Stop : -
As the single currency has maintained a firm undertone after yesterday’s rally above last week’s high at 1.1777, adding credence to our bullish view that recent upmove from 1.0340 low is still in progress and upside bias remains for further gain to 1.1850-55 (50% projection of 1.1370-1.1777 measuring from 1.1650) but loss of near term upward momentum should prevent sharp move beyond 1.1875-80 and price should falter below 1.1900-05 (61.8% projection), risk from there has increased for a retreat later.
In view of this, would not chase this rise here and would be prudent to buy euro on pullback as 1.1750 should limit downside. Below said support at 1.1723 would defer and suggest top is possibly formed, bring retracement of recent rise to 1.1690-95 first but indicated support at 1.1650 should hold.
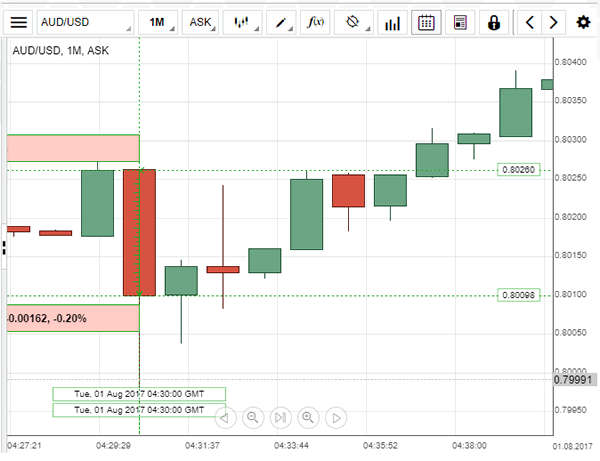
AUD/USD: RBA Cash Rate
AUD/USD remained at about the same level it was seen ahead of the release, as the Reserve Bank of Australia failed to surprise the market and decided to leave its trend-setting interest rate at the record-low level of 1.50% yet again. Following the release, the Aussie fell slightly versus its American counterpart, with the one-minute candle closing at the 0.80098 level. In the statement released by the RBA, the Governor Lowe was thrilled to note that the global economic conditions continued to improve and pointed out that Australia's largest trading partner, China, kept showing signs of economic stability. Lowe also said leaving interest rates at the current low level was consistent with the bank's path towards the sustainable growth and the inflation target.
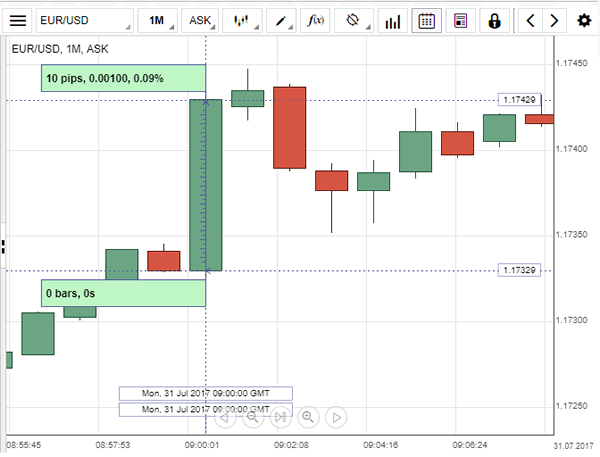
EUR/USD: EZ Flash CPI
Firmly confident figures for the Euro zone's inflation contributed enough to bring the EUR/USD currency pair to a new high on Monday. The Euro advanced against the US Dollar by 0.09% to reach the 1.17429 level following the release of the flash CPI data for July, which managed to satisfy analysts' expectations. Eurostat revealed its flash estimate for inflation in the Euro area rose 1.3% in the reported month, unchanged from June, while the core measure edged higher to 1.2%, above economists' forecasts for a 1.1% increase. Nevertheless, despite consumer prices growth remaining below the ECB's 2% target, the ongoing economic expansion across the 19-country bloc added to confidence that inflation would gradually rise towards the target level.
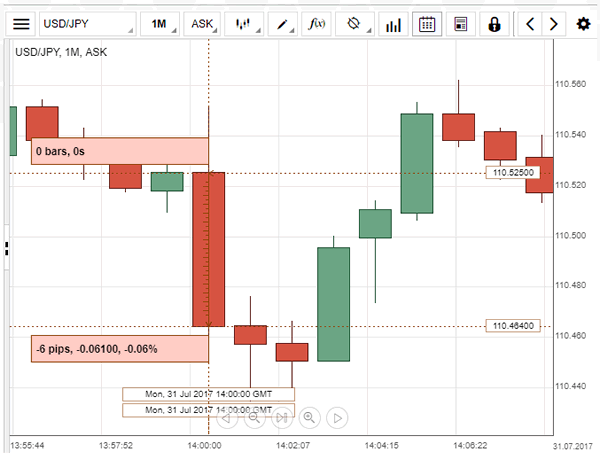
USD/JPY: US Pending Home Sales
Stronger-than-expected US pending home did not manage to support the USD/JPY exchange rate. Following the release, the Yen appreciated against the US Dollar by 0.053% to be seen trading at 110.46. The National Association of Realtors reported that the Pending Home Sales Index rose twice as much as anticipated by a seasonally adjusted 1.5% in July, following an upwardly revised 0.7% drop in the prior month. Nevertheless, the strong increase offset previous declines only partially and suggested that existing home sales are likely to increase in the near term, as fewer available properties forced buyers to act immediately. Analysts expect housing sector to continue recovering after being stymied by the lack of homes, which led to higher prices.
Trade Idea : USD/JPY – Sell at 110.75
USD/JPY - 110.21
Most recent candlesticks pattern : N/A
Trend : Near term down
Tenkan-Sen level : 110.22
Kijun-Sen level : 110.39
Ichimoku cloud top : 111.01
Ichimoku cloud bottom : 110.65
Original strategy :
Sell at 111.20, Target: 110.20, Stop: 111.55
Position : -
Target : -
Stop : -
New strategy :
Sell at 110.75, Target: 109.75, Stop: 111.10
Position : -
Target : -
Stop : -
As the greenback has fallen again after meeting renewed selling interest at 110.77 yesterday, adding credence to our bearish view that the decline from 114.50 is still in progress and downside bias remains for further weakness to 110.00, then 109.75-80 but near term oversold condition should limit downside to 109.50 and reckon 109.20-25 would hold from here, risk from there is seen for a rebound later.
In view of this, would not chase this fall here and would be prudent to sell dollar again on recovery as said resistance at 110.77 should limit upside. Above 111.00-05 would defer and risk test of 111.29 resistance but only break there would signal a temporary low is formed instead, bring rebound to 111.50-55 first.

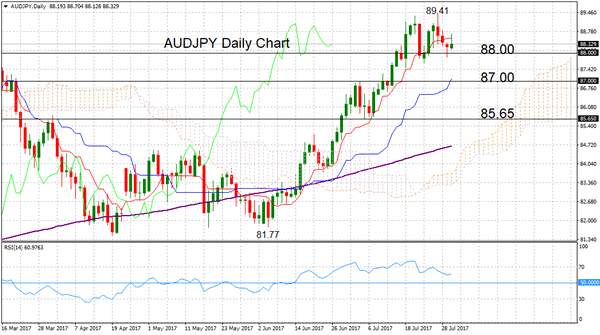
AUDJPY Loses Momentum, Maintains Bullish Outlook
AUDJPY has shifted to neutral in the near term after pausing a rally that took the pair above the key 88.00 level, which is now acting as strong support.
Prices rose sharply from the June 6 low of 81.77 but the market became overextended with RSI reaching into overbought territory above 70. Upside momentum faded and AUDJPY has entered into a consolidation phase between the key level of 88.00 and the June 27 high of 89.41.
Strong support at 88.00 is expected to contain downside moves, as it has been doing in recent days. If it is breached, then this would open the way for further declines towards next support at 87.00 (previous resistance). From here there is important support at 85.65 (a previous support level in late June until early July). It is also the 50% Fibonacci retracement level of the rise from 81.77 to 89.41. A deeper decline from this area would shift the short-term uptrend and a top would be put in place at 89.41.
There are no clear signs indicating a reversal in the uptrend. The pair is neutral in the near term but the overall market structure is bullish on the daily chart. The Tenkan-sen line is above the Kijun-sen line and the market is above the Ichimoku cloud. Meanwhile, RSI remains above 50 in bullish territory. The 200-day moving average is rising with the market above it.
A successful break above the 89.41 high would open the way towards the next significant high of 90.72 that was reached in November 2015. Such a move would strengthen both the short and medium-term bullish bias.
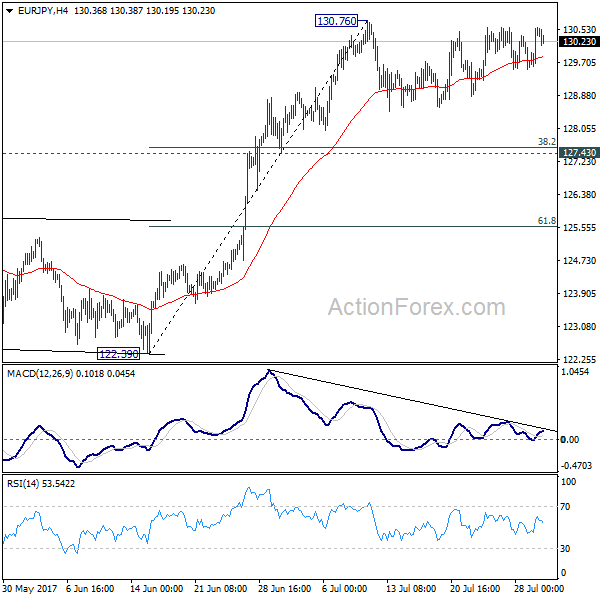
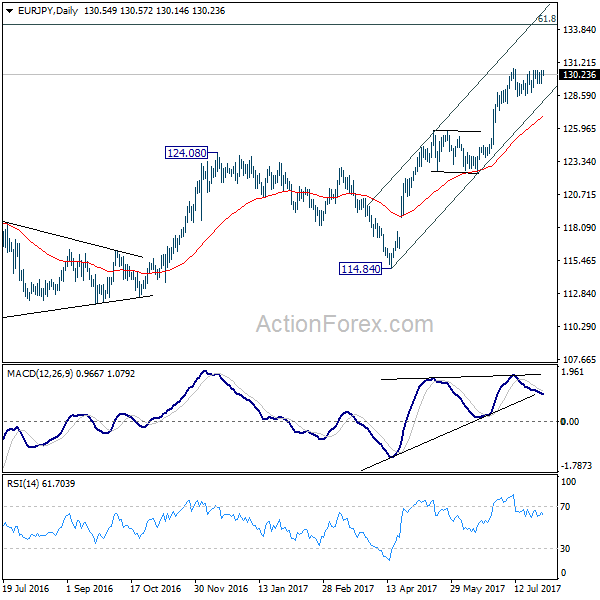
EUR/JPY Daily Outlook
Daily Pivots: (S1) 129.86; (P) 130.22; (R1) 130.90; More...
EUR/JPY's consolidation from 130.76 is still in progress and intraday bias remains neutral first. Another fall could be seen. But downside should be contained by 127.43 cluster support (38.2% retracement of 122.39 to 130.76 at 127.56) and bring rebound. Above 130.76 will extend the larger rally to next key fibonacci level at 134.20.
In the bigger picture, the down trend from 149.76 (2014 high) is completed at 109.03 (2016 low). Current rally from 109.03 should be at the same degree as the fall from 149.76 to 109.03. Further rise is expected to 61.8% retracement of 149.76 to 109.03 at 134.20. Sustained break there will pave the way to key long term resistance zone at 141.04/149.76. Medium term outlook will remain bullish as long as 124.08 resistance turned support holds.
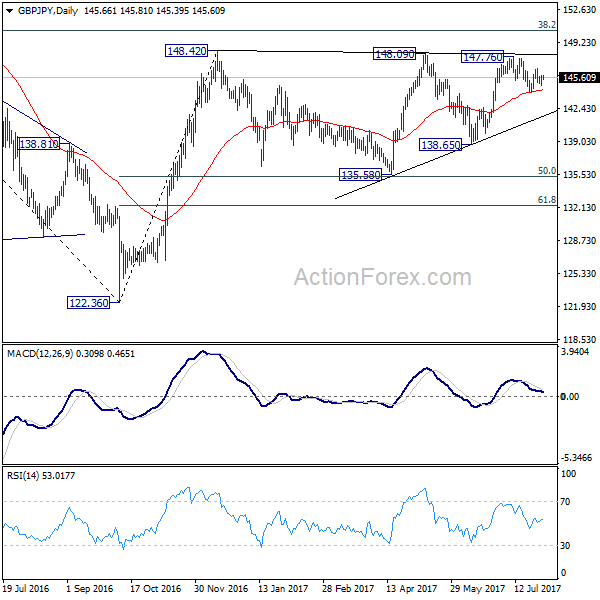
GBP/JPY Daily Outlook
Daily Pivots: (S1) 145.01; (P) 145.42; (R1) 146.05; More
Intraday bias in GBP/JPY remains neutral for the moment. On the upside, break of 147.76/148.42 key resistance zone will resume larger rebound from 122.36. On the downside, break of 144.01 will extend the sideway pattern from 148.20 with another fall back to 135.58/65 support zone.
In the bigger picture, rise from medium term bottom at 122.36 is expected to continue to 38.2% retracement of 196.85 to 122.36 at 150.43. Decisive break there will carry long term bullish implications and pave the way to 61.8% retracement at 167.78. In case the sideway pattern from 148.42 extends, we'd be looking for strong support from 135.58 and 50% retracement of 122.36 to 148.42 at 135.39 to contain downside.
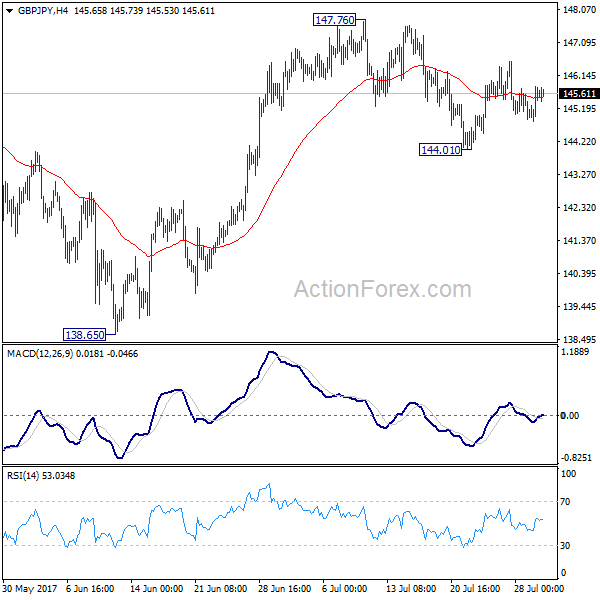
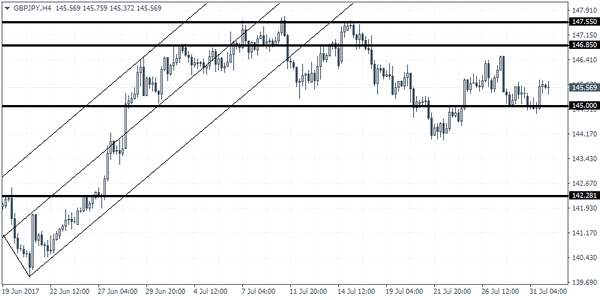
GBPJPY Intraday Analysis
GBPJPY (145.56): GBPJPY has been trading flat for the past couple of sessions. Price action is seen consolidating within the 146.85 resistance and 145.00 support levels. This comes after the previous strong rally sent GBPJPY towards the highs near 147.55. Support is seen at 142.28. However, for this support level to be tested, GBPJPY will need to make a convincing close below 145.00 support level as a result. To the upside, any gains will likely struggle to break past the 147.55 resistance level. With the BoE's meeting lined up this week, GBPJPY could be seen maintaining a flat bias into the event.