
Sample Category Title
Mood Among German Businesses Surged To Record High In July
For the 24 hours to 23:00 GMT, the EUR slightly rose against the USD and closed at 1.1646, following upbeat Ifo report from Germany.
Data indicated that Germany's Ifo business climate index unexpectedly jumped to a record high level of 116.0 in July, suggesting that firms are much more optimistic about the present economic condition in the Euro-bloc's largest economy. The index had registered a revised level of 115.2 in the previous month, while markets were expecting for a drop to a level of 114.9. Further, the nation's Ifo business expectations index surprisingly advanced to a level of 107.3 in July, defying market consensus for a fall to a level of 106.5 and following a reading of 106.8 in the prior month. Additionally, the nation's Ifo current assessment index registered an unexpected rise to a level of 125.4 in July, confounding market expectations of a decline to a level of 123.8. In the prior month, the index had recorded a revised reading of 124.2.
Macroeconomic data released in the US revealed that the CB consumer confidence index surprised with an unexpected rise to a level of 121.1 in July, hovering at a 4-month high level as consumer sentiment was boosted by greater optimism over the state of the nation's labour market. In the preceding month, the index had recorded a revised level of 117.3, while investors had envisaged for it to ease to a level of 116.5. Moreover, the nation's Richmond Fed manufacturing index unexpectedly advanced to a level of 14.0 in July, compared to market anticipation of a fall to a level of 7.0. In the prior month, the index had recorded a revised level of 11.0. Meanwhile, the nation's housing price index advanced less-than-expected by 0.4% on a monthly basis in May, compared to a revised rise of 0.6% in the prior month.
In the Asian session, at GMT0300, the pair is trading at 1.1651, with the EUR trading a tad higher against the USD from yesterday's close.
The pair is expected to find support at 1.1622, and a fall through could take it to the next support level of 1.1593. The pair is expected to find its first resistance at 1.1696, and a rise through could take it to the next resistance level of 1.1741.
With no crucial macroeconomic releases in the Euro-zone today, investors will anxiously await the Federal Reserve's (Fed) monetary policy announcement, due later in the day, to get cues on its balance sheet reduction plan. Also, the US new home sales for June and MBA mortgage applications data will be eyed by traders.
The currency pair is showing convergence with its 20 Hr and 50 Hr moving averages.

EUR/JPY Daily Outlook
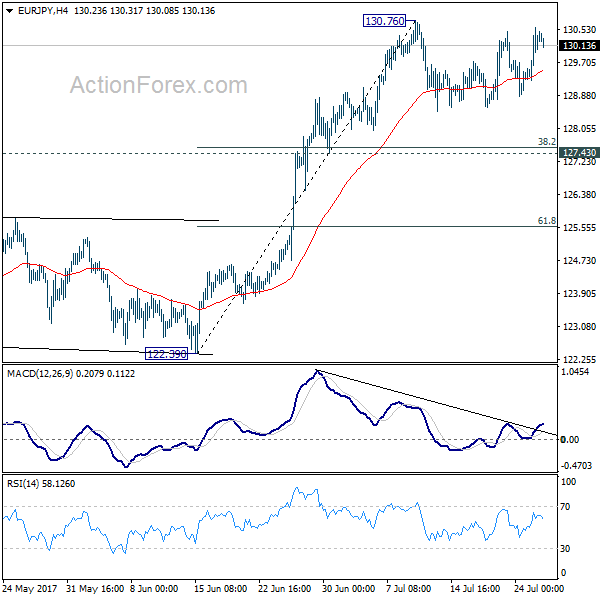
Daily Pivots: (S1) 129.51; (P) 130.04; (R1) 130.84; More...
EUR/JPY is still bounded in range below 130.76 and intraday bias remains neutral. More consolidations could be seen. But downside should be contained by 127.43 cluster support (38.2% retracement of 122.39 to 130.76 at 127.56) and bring rebound. Above 130.76 will extend the larger rally to next key fibonacci level at 134.20.
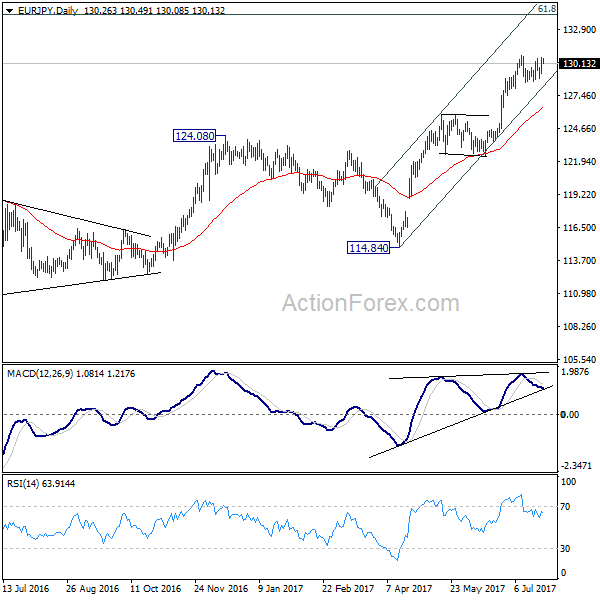
In the bigger picture, the down trend from 149.76 (2014 high) is completed at 109.03 (2016 low). Current rally from 109.03 should be at the same degree as the fall from 149.76 to 109.03. Further rise is expected to 61.8% retracement of 149.76 to 109.03 at 134.20. Sustained break there will pave the way to key long term resistance zone at 141.04/149.76. Medium term outlook will remain bullish as long as 124.08 resistance turned support holds.
Pound Trading Flat In The Asian Session, Ahead Of UK’s 2Q GDP Data
For the 24 hours to 23:00 GMT, the GBP marginally rose against the USD and closed at 1.3030.
On the data front, Britain's CBI industrial trends total orders dropped more-than-expected to a level of 10.0 in July, compared to a level of 16.0 in the prior month. Market participants were anticipating it to ease to a level of 12.0.
In the Asian session, at GMT0300, the pair is trading at 1.3030, with the GBP trading flat against the USD from yesterday's close.
The pair is expected to find support at 1.2997, and a fall through could take it to the next support level of 1.2965. The pair is expected to find its first resistance at 1.3073, and a rise through could take it to the next resistance level of 1.3117.
Trading trend in the Pound today will be determined by the release of Britain's flash 2Q GDP numbers and BBA mortgage applications data for June, both slated to release in a few hours.
The currency pair is trading below its 20 Hr moving average and showing convergence with its 50 Hr moving average.

Trade Idea : USD/JPY – Hold short entered at 112.00
USD/JPY - 111.86
Most recent candlesticks pattern : N/A
Trend : Near term down
Tenkan-Sen level : 111.95
Kijun-Sen level : 111.46
Ichimoku cloud top : 111.35
Ichimoku cloud bottom : 111.06
Original strategy :
Sold at 112.00, Target: 111.00, Stop: 112.35
Position : - Short at 112.00
Target : - 111.00
Stop : - 112.35
New strategy :
Hold short entered at 112.00, Target: 111.00, Stop: 112.35
Position : - Short at 112.00
Target : - 111.00
Stop : - 112.35
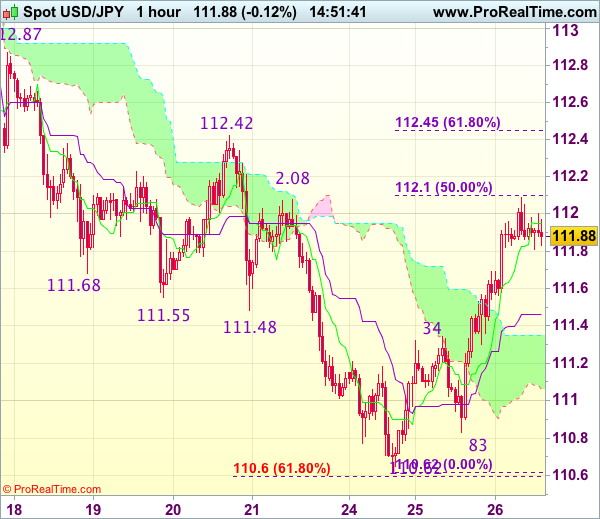
Although yesterday’s rally suggests near term rise from this week’s low at 110.62 may extend marginal gain from here, as this move is viewed as retracement of recent decline, reckon upside would be limited to 112.10 (50% Fibonacci retracement of 113.58-110.62) and bring another retreat later. Below previous resistance at 111.34 (now support) would suggest top is possibly formed but break of 111.10-15 is needed to add credence to this view, bring test of 110.80, break there would signal the rebound from 110.62 has ended, bring retest of this level first.
In view of this, we are holding on to our short position entered at 112.00. Above 112.08-10 would risk a stronger rebound to 112.42-45 (previous resistance and 61.8% Fibonacci retracement of 113.58-110.62) but only break there would signal recent decline has ended, bring headway towards resistance at 112.87 would follow.
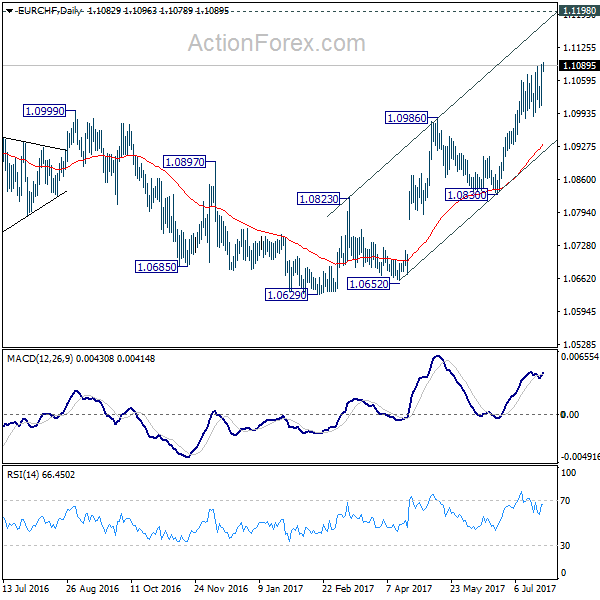
EUR/CHF Daily Outlook
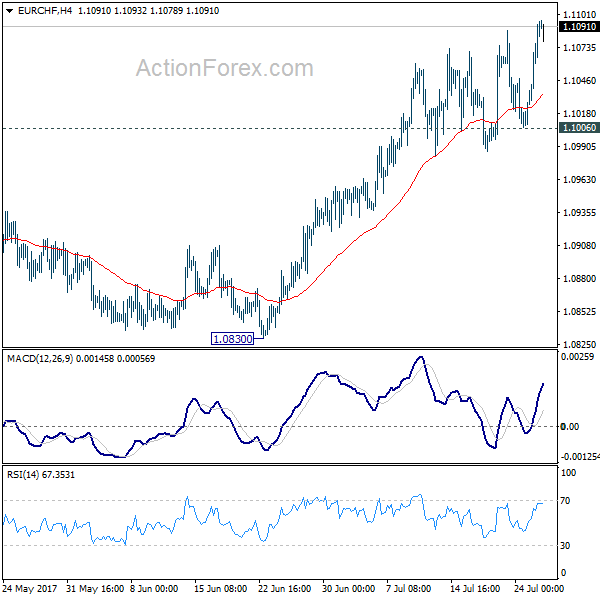
Daily Pivots: (S1) 1.1035; (P) 1.1064; (R1) 1.1119; More...
EUR/CHF's rally resumed by taking out 1.1087 and intraday bias is back on the upside. Current rise is expected to target key resistance at 1.1127/98. On the downside, break of 1.1006 support is needed to indicate short term topping. Otherwise, outlook will remain bullish in case of retreat.
In the bigger picture, the price actions from 1.1198 are seen as a corrective move. Such correction could have completed after defending 38.2% retracement of 0.9771 to 1.1198 at 1.0653. Decisive break of 1.1198 will resume the long term rise from SNB spike low back in 2015. In such case, EUR/CHF could eventually head back to prior SNB imposed floor at 1.2000. We'll favor this bullish case as long as 1.0830 support holds. However, rejection from 1.1198 will extend the multi-year range trading with another fall.
Japanese Yen Trading A Tad Lower In The Asian Session
For the 24 hours to 23:00 GMT, the USD rose 0.64% against the JPY and closed at 111.88.
In the Asian session, at GMT0300, the pair is trading at 111.92, with the USD trading marginally higher against the JPY from yesterday’s close.
The pair is expected to find support at 111.14, and a fall through could take it to the next support level of 110.35. The pair is expected to find its first resistance at 112.4, and a rise through could take it to the next resistance level of 112.87.
The currency pair is trading above its 20 Hr and 50 Hr moving averages.

Swiss Franc Trading Marginally Higher, Ahead Of Switzerland’s UBS Consumption Indicator Data
For the 24 hours to 23:00 GMT, the USD rose 0.58% against the CHF and closed at 0.9527.
In the Asian session, at GMT0300, the pair is trading at 0.9522, with the USD trading a tad lower against the CHF from yesterday's close.
The pair is expected to find support at 0.9475, and a fall through could take it to the next support level of 0.9427. The pair is expected to find its first resistance at 0.9551, and a rise through could take it to the next resistance level of 0.9579.
Moving ahead, market participants will closely monitor Switzerland's UBS consumption indicator data for June, slated to release in a few hours.
The currency pair is trading above its 20 Hr and 50 Hr moving averages.

Loonie Trading Slightly Higher This Morning
For the 24 hours to 23:00 GMT, the USD traded flat against the CAD and closed at 1.2510.
In the Asian session, at GMT0300, the pair is trading at 1.2507, with the USD trading marginally lower against the CAD from yesterday’s close.
The pair is expected to find support at 1.2481, and a fall through could take it to the next support level of 1.2455. The pair is expected to find its first resistance at 1.2533, and a rise through could take it to the next resistance level of 1.2559.
With no economic releases in Canada today, investor sentiment will be governed by global macroeconomic events.
The currency pair is showing convergence with its 20 Hr and 50 Hr moving averages.

UK GDP, The Fed And Oil In Focus
- Will UK get summery boost in GDP data?
- FOMC statement could hold balance sheet clues;
- Brent spikes above $50 on huge inventory draw.
It should be an interesting day for markets on Wednesday, with the UK releasing data on second quarter growth this morning, the US Federal Reserve announcing its latest decision this evening and crude inventory data being released after API reported a substantial reduction.
Data this morning is expected to show growth in the second quarter in the UK improved slightly from the first but remained mediocre, as the consumer squeeze continues to take its toll. Markets are expecting growth of 0.3% in the quarter but I do wonder whether the warmer weather in the quarter and the spike in consumer spending associated with it could spring a surprise on us this morning.
A positive surprise on the GDP report could be what the pound needs to finally break significantly above 1.30 against the dollar, with the pair once again struggling to make any serious move above here.
Another factor here today will be the FOMC decision later, or more likely the statement that accompanies it. The Fed is unlikely to raise interest rates again today having just done so in June, but we could get some insight into whether it will start reducing its balance sheet from September. The Fed has been discussing this for some months now and it may use today's statement to warn markets ahead of the next meeting.
Brent crude surged back above $50 on Tuesday after API reported a 10.23 million barrel drawdown in oil inventories, the biggest decline since September. The drop comes shortly after some of the world's largest oil producers met to discuss progress with the cuts and after data showed Saudi exports to the US have been declining over the last month.
It will be very interesting to see whether EIA reports and similar number today and, if so, whether traders will see this as a sign that the latest cuts are working or just a blip in the data. We'll need to see a few weeks of data to be sure but this coming when the US is importing less from Saudi Arabia may not be a coincidence. The surge through $50 may support this view and further gains could follow if EIA confirms the numbers today.
Oil Tests Resistance But Looks Ready To Retreat
Key Points:
- Selling Pressure is likely to resume in the near-term.
- Long-term downtrend remains intact despite recent upswing.
- Losses should be capped around the 47.20 or 45.32 handles.
Oil prices soared 4.50% higher overnight as a result of a 10.23M drawdown in the US API Crude Oil Stocks – the largest draw in 10 months. Due to this, much of the market will be bracing for another surge in buying pressure just in case the impending US Cushing Inventories data shows a similar outcome. Alternatively, the pessimists will be waiting on a reversal in the event that the next round of data proves disappointing. Whilst only time will truly tell who is in the right, a quick look at the technical bias certainly seems to suggest that the bears may be at a slight advantage.
Indeed, the recent surge has put oil prices into conflict with the upside of a long-term channel which could seriously hamstring further attempts to push oil prices higher. What's more, a number of other technical readings are hinting that the upswing may be short-lived. For instance, stochastics have trended sharply into overbought territory which is likely to encourage a reversal away from resistance. However, we also can't ignore the fact that the long-term trend is definitely slanted to the downside which will be putting pressure on the commodity regardless.
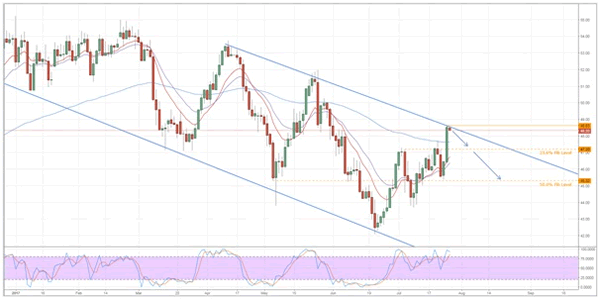
The main counter to a bearish technical biasis the fact that the EMA bias is clearly bullish. Nevertheless, I think this is more likely to act as a near term cap on downsides rather than be a driver of continued gains moving ahead. Specifically, the 100 day EMA should now be a source of dynamic support around the 23.6% Fibonacci level which could be where we now see oil retreat to. However, this is assuming that the next batch of US oil inventories data comes in broadly on target. If we instead see a less extreme draw or even a build, losses could smash back through this support and reach all the way back to the 45.32 handle.
Ultimately, it doesn't appear that oil is going to be out of the woods anytime soon on the technical front. Moreover, the prevailing view that OPEC has failed in its mission to re-float prices is slowly but surely taking its toll on the commodity which is likely to see it travel reliably lower in coming weeks. As a result, our near-term view is that oil reverses and subsequently declines, however, exactly to where is not yet clear.