Sample Category Title
EUR/USD Elliott Wave Analysis
EUR/USD – 1.1650
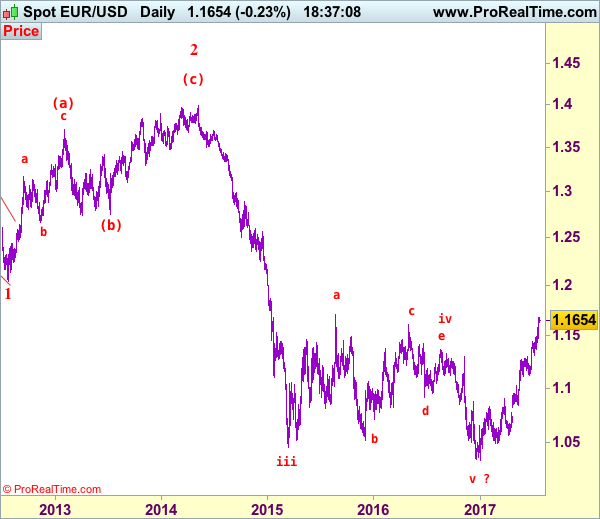
EUR/USD: Wave (c) of 2 ended at 1.3993 and wave 3 of III has commenced for weakness to 1.0411 (1.236 of wave 1), then 1.0000.
The single currency has continued heading north after recent rally, adding credence to our bullish view that the upmove from 1.0340 low is still in progress and indicated upside targets at 1.1616 resistance and 1.1660 had been met, upside bias remains for this move to extend headway to another previous resistance at 1.1714, then 1.1750-60, however, near term overbought condition should limit upside to 1.1800-10 and reckon 1.1870-80 would hold from here, risk from there is seen for a retreat later.
Our preferred count on the daily chart remains that a wave (II) from 1.2329 ended at 1.5145 with A-leg ended at 1.4720, followed by wave B at 1.2457, the wave C from there was also a 3 legged move and is labeled as (a): 1.3739, (b): 1.2885, the wave iii of the 5-waver (c) from 1.2885 has ended at 1.4339 and wave iv is a triangle ended at 1.3878 and wave v formed a top at 1.5145. The decline from there is a 5-waver (C) with minor wave (i) of I of (C) ended at 1.4218 with wave (ii) ended at 1.4580, wave (iii) ended at 1.3267 and wave (iv) ended at 1.3692 and wave (v) ended at 1.1876, this is also the low of wave I of (C) and wave II ended at 1.4940, hence wave III is now in progress with a diagonal wave 1 ended at 1.2042, the breach of previous support at 1.1876 (wave I trough) adds credence to our view that the wave 2 has ended at 1.3993, wave 3 has commenced for further weakness to 1.0411, then towards 1.0000.
On the downside, whilst initial pullback 1.1600 is likely, reckon downside would be limited to previous resistance at 1.1583 and 1.1530-35 should hold, bring another rise later. A daily close below support at 1.1479 would defer and suggest a temporary top is possibly formed, risk correction to minor support at 1.1435 but downside should be limited and price should stay above indicated support at 1.1370, bring another upmove later.
Recommendation: Buy at 1.1550 for 1.1750 with stop below 1.1450
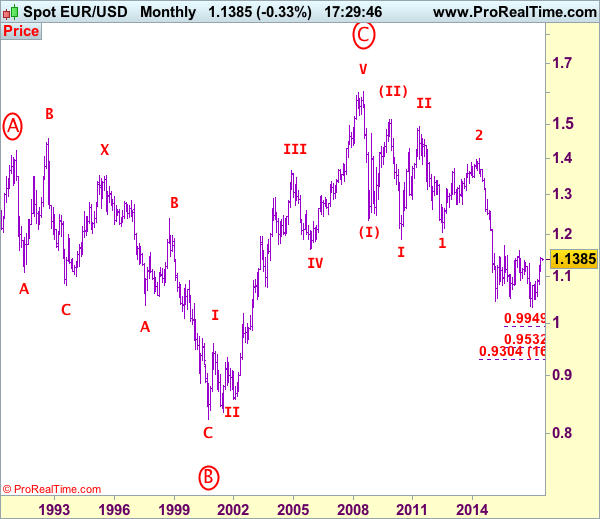
Euro's long-term uptrend started from 0.8228 (26 Oct 2000) with an impulsive structure. The rise from 0.8228 to 0.9593 (5 Jan 2001) is labeled as wave I, the retreat to 0.8352 (6 Jul 2001) is wave II and the rally to 1.3670 (31 Dec 2004) is wave III. Wave IV from there ended at 1.1640 (15 Nov 2005), the subsequent upmove to 1.6040 (July 15, 2008) is treated as wave V, the major selloff from the record high of 1.6040 to 1.2329 (October 27, 2008) signals a reversal has taken place with (I) leg ended at 1.2329 and once (II) ended at 1.5145, wave (III) itself is an extended move with I: 1.1876 and complex wave II ended at 1.4902, wave III has commenced with wave 1 and 2 ended at 1.2042 and 1.3993 respectively, wave 3 of III is now unfolding for weakness towards parity.
Politics Down’s Dollar
Monday July 24: Five things the markets are talking about
Global equities trade mixed while the yen (¥110.78) climbs for a fifth consecutive session at the start of a week packed with more earnings results and a FOMC interest-rate decision. Oil prices remain under pressure ahead of todays OPEC and non-OPEC officials meeting in Russia amid concerns over the global supply.
The Fed meeting is midweek (Wednesday July 26, 2:00 pm EDT). No change in policy is expected. However, the market will be looking for guidance regarding the next fed funds interest rate increase and when the Fed will begin the long awaited reduction in its balance sheet.
Also this week, investors will get a first look at Q2 growth from the U.K, France and the U.S. They will also get a look at July data with the flash PMI's in Japan and the Eurozone (see below).
On the political front, it's expected to be a turbulent week stateside with the U.S administration having to continue to deal with the investigation into allegations regarding President Trump's possible connections with Russia.
Today, the Senate Intelligence Committee will interview Jared Kushner, senior adviser to President Trump (closed door hearing), and Donald Trump Jr. and former Trump campaign Chairman Paul Manafort will go before Senate committees on Wednesday.
1. Stocks mixed results Monday
In Japan, stocks dropped to a two-week low overnight, pressured mostly by a stronger yen. The Nikkei share average declined -0.6%, the lowest closing level since July 7, while the broader Topix dropped -0.5% in thin trade, with turnover of only ¥1.9T – the lowest level in a month.
In Hong Kong, shares rallied to a two-year high, resuming their rally after a brief pause last week, helped by consumer and tech stocks. The Hang Seng Index ended up +0.5%, while the Hang Seng China Enterprises Index finished +0.3% higher.
In China, the blue-chip index hovers atop its 18-month high overnight, as institutional investors stepped up their buying into industry leading big caps. Small-cap shares continued to underperform as their earnings disappointed. The blue-chip CSI300 index ended up +0.4%, while the Shanghai Composite Index added +0.4%, closing at its highest in three-months.
In Europe, regional indices trade lower across the board with the strengthening EUR and weaker German prelim manufacturing PMI weighing. The FTSE 100 leads the decliners, pressured by Airline stocks.
U.S equities are set to open in the red (-0.2%).
Indices: Stoxx600 -0.4% at 379, FTSE -0.9% at 7388, DAX -0.5% at 12187, CAC-40 -0.3% at 5107, IBEX-35 -0.4% at 10385, FTSE MIB +0.1% at 21214, SMI -0.3% at 8913, S&P 500 Futures -0.2%
2. Oil prices dip as prospect of deeper OPEC output cut dims
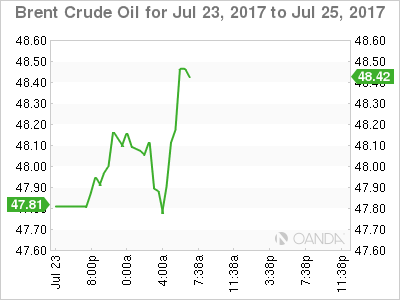
Oil prices have slipped to one-week lows ahead of the U.S open, as several OPEC and non-OPEC ministers meet to discuss a pact to curb oil output.
The market has ruled out deeper production cuts, but on the agenda will be caps for exempted OPEC members Libya and Nigeria.
Note: Output cuts by Libya and Nigeria would be considered very difficult considering Libya is just emerging from a civil war.
Brent crude futures fell -18c to +$47.88 a barrel. It fell -2.5% on Friday after a consultancy forecast a rise in OPEC production for July. WTI September futures fell -20c to +$45.57 a barrel.
Note: The U.S is considering financial sanctions on Venezuela to halt dollar payments for the country's oil, which could restrict the OPEC nation's crude exports.
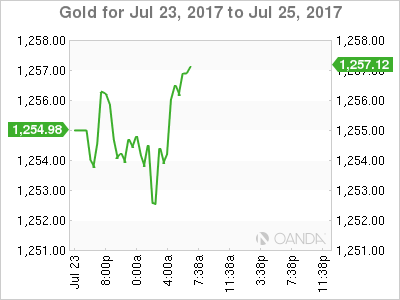
Gold prices trade atop of its four-week high (unchanged at +$1,254.11 per ounce), supported by political uncertainty stateside and as the dollar remains near its 13-month low. Investor doubts over President Trump's stimulus and tax reform agendas continue to weigh on the ‘mighty' dollar.
3. Yield curves flatten, focus turns to the Fed
With U.S inflation remaining muted and the job market robust, the Fed is expected to make no change to policy on Wednesday (2:00 pm EDT). The market will be searching the statement for clues on how officials plan to proceed in reducing their massive portfolio.
Note: No press conference by Fed Chair Yellen
The yield on the 10-year Treasury note is flat at +2.24%, while down-under, comments from Reserve Bank of Australia (RBA) Deputy Governor Debelle late last week stating that the central bank was far from tightening its policy (differs from recent minutes) has yields under pressure. Aussie 10-year yield have fallen another -2 bps to +2.68%.
Elsewhere, French (OAT's) and German Bund 10-year yields were little changed, while U.K. Gilts have rallied +1 bps to +1.18%.
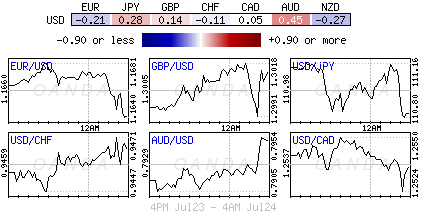
4. Dollar remains under a political cloud
The USD is maintaining if soft tone for a number of reasons. First, the IMF's Economic Outlook highlights the recent divergence on growth (continental Europe is raised while the U.S was cut for both 2017 and 2018). Second, political situation stateside, the U.S administration continues to deal with the investigation into allegations regarding President Trump's possible connections with Russia.
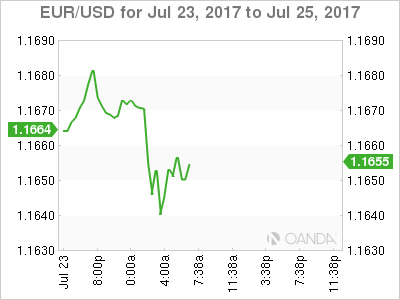
The EUR is down -0.13% at €1.1646, having earlier hit a fresh peak of €1.1684 overnight. For the ‘bulls,' the single units next target is above the psychological €1.1700 handle at €1.1723, while the ‘bears are looking for a correction below €1.1600 on concerns that a stronger single unit will worry the ECB. The EUR's next step will depend on what the Fed has to say on Wednesday.
Sterling is trading a tad higher, up +0.3% at £1.3035 – the ‘bears' continue to look at upticks for potential sells – the pound is likely to rise if PM Theresa May accepts a longer-term transition for Brexit. But, concerns over the U.K economy heading for a sharp slowdown as investment and consumption both worsen will be negative for the pound. The IMF has downgraded its 2017 U.K economic growth to +1.7%, from a +2% forecast previously.
The AUD has rallied +0.5% overnight, trading at A$0.7946 ahead of a speech by Reserve Bank of Australia (RBA) Governor Philip Lowe on Wednesday. Deputy Governor Debelle last week appeared to tone down the RBA's more hawkish tone recently.
5. Major European PMI manufacturing data misses expectations
Data this morning showed that Germany's PMIs for July came in weaker than forecasted, as private-sector output growth slowed for the second straight month.
Germany's manufacturing PMI hit a three-month low of 58.3; the services PMI drops to a six-month low of 53.5. As a consequence, the composite PMI fell to 55.1, a six-month low.
Output and new orders increased at the slowest rates since January, signaling a further easing in the pace of German economic expansion entering H2.
Note: The slowdown follows the strongest quarter in six years, and Germany's manufacturing sector continuess to expand at a historically sharp rate.
The July composite PMI for the eurozone came in significantly weaker than expected, falling to 55.8 from June's 56.3 to reach its lowest level in six months.
The decline, which was driven by manufacturing, could suggest that H2 may not be as strong as H1. The details on inflation reinforced that message of caution, with prices charged by businesses rising at the slowest pace in six-months.
USD/JPY Elliott Wave Analysis
USD/JPY - 112.05
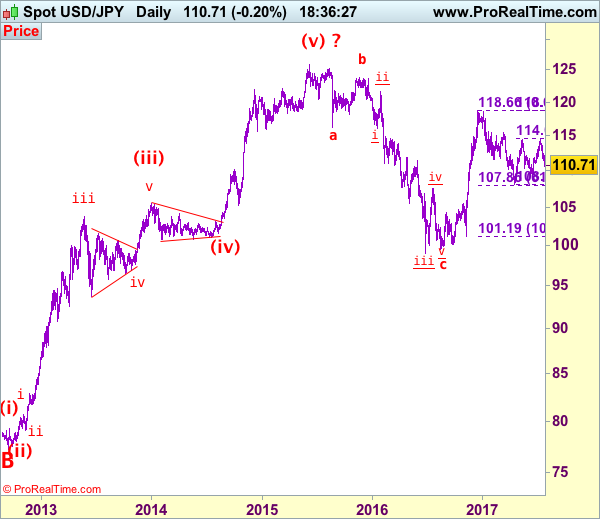
USD/JPY – Wave V of larger degree circle V has possibly ended at 75.31 and major correction has commenced and already met indicated target at 125.00.
As the greenback has fallen again after brief recovery, adding credence to our view that top has been formed at 114.50 and the decline from there may extend further weakness to 110.00, a daily close below there would reinforce our count that the entire corrective rebound from 108.13 has ended at 114.50 (tentatively wave b top), hence consolidation with downside bias remains for subsequent fall to 109.40-50 but reckon downside would be limited to 108.82 support. Only a break of this level would provide confirmation and signal wave c has commenced for retest of 108.13 first.
Our preferred count is that, triangle wave IV (with circle) ended at 101.45 and the circle wave V brought dollar down to the record low of 75.31 in 2011 and the subsequent rebound signal major correction has commenced with A leg ended at 84.19, followed by wave B at 77.14 and impulsive wave C is now unfolding (indicated upside target at 125.00 had been met) for gain towards 127.00 level. In the event dollar drops below support at 99.01, this would confirm medium term decline from 125.86 top (2015 high) has resumed for subsequent weakness to 98.00 and possibly 97.00.
Under this count, this wave C is unfolding as impulsive waves with (1) (2), 1 2 ended at 80.67, 79.07, 82.84 and 81.69 respectively, hence the extended wave 3 has ended at 103.74 and wave 4 correction of recent upmove should bring weakness to 92.57, then towards 90.88 but psychological support at 90.00 should limit downside and bring another rally later in wave 5, indicated target at 125.00 had been met and gain to 127.00 cannot be ruled out but reckon price would falter below 130.00.
On the upside, whilst initial recovery to 111.20-25 is likely, reckon upside would be limited to 111.90-00 and resistance at 112.42 should hold, bring another decline later to aforesaid downside targets. A daily close above said resistance at 112.42 would signal first leg of decline from 114.50 has ended, bring a stronger rebound to 112.85-90 but resistance at 113.58 should cap upside, bring another selloff later.
Recommendation: Sell at 112.00 for 110.00 with stop above 113.00.
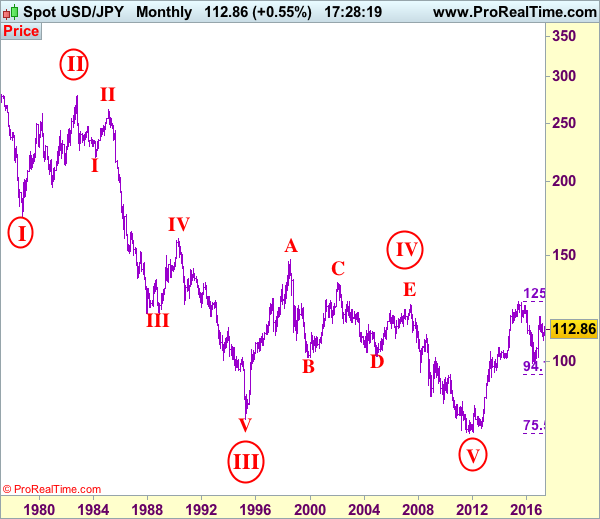
On the monthly chart, we have changed our preferred count that an impulsive wave is unfolding with major wave III with circle ended at 79.75, then followed by wave IV with circle and is labeled as a triangle with A: 147.64 (11 August, 1998), B: 101.25, C: 135.20, D: 101.67 and E leg ended at 124.14 to end the wave IV with circle. Hence, wave V with circle commenced from there and hit a record low of 75.31, however, the subsequent strong rebound signals this circle wave V has possibly ended there, hence gain to (indicated upside target at 122.00 and 125.00 had been met), the retreat from 125.86 suggests wave A of major correction has ended there and wave B correction back to 99.00, then 95.00 would be seen, however, reckon downside would be limited to 90.00, bring another rebound in wave C next year.
Technical Outlook: AUDUSD – Fresh Rally Re-Focuses 0.8000 Barrier, Aus CPI And FOMC Eyed For Signals
Fresh weakness of the greenback pushed the Aussie dollar higher on Monday, neutralizing downside threats on Friday's close in red which signaled formation of reversal pattern.
Fresh acceleration higher turns near-term focus towards psychological 0.8000 barrier again, as bulls ignore for now strongly overbought daily studies.
However, the pair may hold within consolidation range, ahead of Australian inflation data in early Wednesday and following FOMC policy decision due later in the day, looking for firmer signals.
Sustained break above 0.8000 barrier would spark fresh upside extension towards 0.8164 (14 May 2015 high/50% of larger 0.9503/0.6825 descend).
Conversely, increased downside risk could be expected on renewed weakness through Friday's low at 0.7874 which would expose lower pivot at 0.7830 (rising 10 SMA/Fibo 38.2% of 0.7572/0.7988 upleg).
Res: 0.7967, 0.7988, 0.8000, 0.8044
Sup: 0.7900, 0.7874, 0.7830, 0.7800
Earnings Season Takes Focus This Week
US futures are pointing to a slightly softer open on Monday, tracking similar moves in Europe, as traders look ahead to a busy week on the corporate calendar with a large number of companies reporting on the second quarter, as well as some important data points and a Federal Reserve monetary policy decision.
Earnings season is likely to be the main focus this week, with 189 S&P 500 companies scheduled to report, as well as plenty more from across the pond. With indices in the US trading at record highs and central banks favouring a less accommodative stance, earnings will become increasingly important in maintaining or expanding on these levels, particularly in the continued absence of the growth policies that won Donald Trump the US election last November.
There will be plenty of economic data scattered around the earnings reports, with PMIs from the euro area and the US coming first on Monday. The euro has dipped a little in early European trade, with PMIs from Germany, France and the eurozone all falling a little short of expectations but not so much as to cause any concern about any significant slowdown in growth in the region.
While the numbers may suggest momentum is slowing, they all remain well above the 50 level that separates growth from contraction. The fact that the euro has slipped a little in response to these numbers may also be a reflection of the fact that it is trading at a near two year high against the dollar and was therefore prone to a little profit taking. A move through 1.1714 in the pair would see it trade at its highest level since the start of 2015 and potentially trigger another sharp move higher.
The pound is trading above 1.30 against the dollar again this morning, up around a third of one percent on the day, which is weighing on the FTSE, the worst performing major index in Europe. The pair has struggled at these levels over the last couple of months but momentum appears to remain with the bulls, which could put some pressure on last week’s highs in the coming days.
Oil prices are trading a little higher on Monday but continue to hover around the levels its traded at for much of the last two months. With OPEC and non-OPEC oil ministers meeting in Russia to discuss compliance with the cuts as well as Libyan and Nigerian output, prices may remain volatile throughout the session as we possibly get more insight into whether deeper cuts could be on the cards.
BITCOIN Consolidating Around 2700
Bitcoin has surged strongly last week. Hourly resistance can be found at 3000 (12/06/2017 high) and hourly support is given at 2615 (21/07/2017 low). Expected to show some further retracement.
In the long-term, the digital currency has had an exponential growth. There are decent likelihood that the asset will consolidate above $1500. Long-term support is given at $1464 (04/05/2017 low).
CRUDE OIL Renewed Bearish Pressures
Crude oil is trading lower. Hourly support is given at 43.65 (10/07/2017 low). Strong resistance given at 48.42 (05/06/2017). Expected to show continued weakness.
In the long-term, crude oil has recovered after its sharp decline last year. However, we consider that further weakness are very likely. Strong support lies at 35.24 (05/04/2016) while resistance can now be found at 55.24 (03/01/2017 high).
SILVER Bullish
Silver is pushing higher after the bounce still bouncing from hourly support given at 15.18 (10/07/2017 low). Key resistance is given at a distance at 17.75 (06/06/2017 high). The commodity has broken the 16-mark. Expected to inch higher.
In the long-term, the death cross indicates that further downsides are very likely. Resistance is located at 25.11 (28/08/2013 high). Strong support can be found at 11.75 (20/04/2009).
AUD/USD Consolidating
AUD/USD's technical structure is bullish since early May despite some profit-taking. Hourly resistance is given at 0.7989 (19/07/2017 high). Hourly support is given at 0.7875 (21/07/2017 low).
In the long-term, we are waiting for further signs that the current downtrend is ending. Key supports stand at 0.6009 (31/10/2008 low) . A break of the key resistance at 0.8295 (15/01/2015 high) is needed to invalidate our long-term bearish view.
USD/CAD Riding Lower
USD/CAD is going lower and the pair remains in a strong bearish momentum. Hourly support is given at 1.2524 (21/07/2017 low). Hourly resistance is given at 1.2701 (17/07/2017). Expected to show continued bearish pressures.
In the longer term, the pair lies in a bullish channel since a year. Strong resistance is given at 1.4690 (22/01/2016 high). Long-term support can be found at 1.2461 (16/03/2015 low).