Sample Category Title
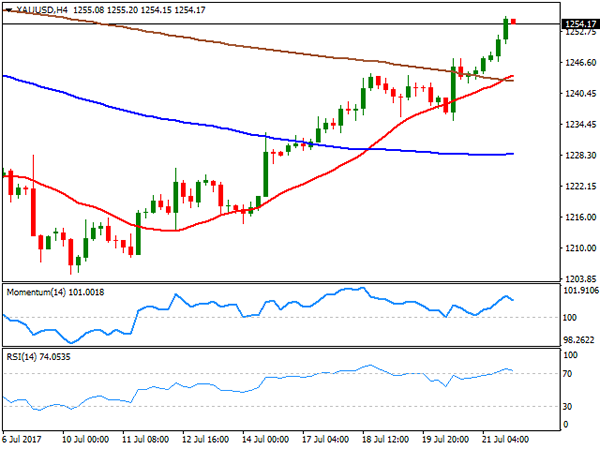
Foreign Exchange Market Commentary: GOLD
Dollar's weakness kept gold on the run, with spot ending the week at $1,254.17 a troy ounce, a few cents below a three-week high of 1,255.64. Political jitters in the US alongside with soft local macroeconomic figures dented the case for a tighter monetary policy in the world's largest economy, while rising speculation that the ECB will take a first step towards tapering next autumn further pressure the greenback. From a technical point of view, the daily chart shows that spot settled above a horizontal 100 DMA, for the first time in July, while technical indicators resumed their advances within positive territory, nearing now overbought readings with a strong upward momentum. In the 4 hours chart, the 20 SMA has extended its advance above the 200 SMA below the current level, while technical indicators have pared gains and turned modestly lower within overbought readings, maintaining the risk towards the upside. June 23rd daily high at 1258.79 is the immediate resistance and the level to break to confirm additional gains ahead, as the pair also has multiple daily lows from mid-May around the level.
Support levels: 1,251.90 1,242.50 1,236.30
Resistance levels: 1,258.80 1,266.60 1,274.10
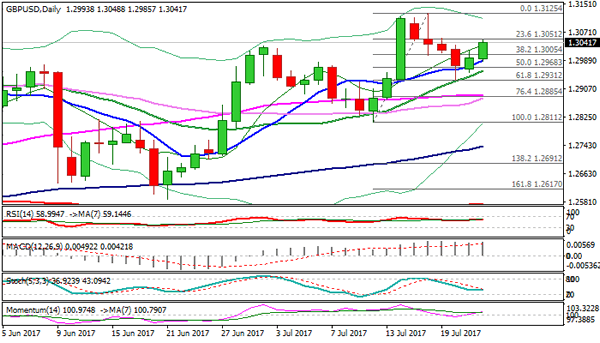
Foreign Exchange Market Commentary: GBP/USD
The GBP/USD pair closed the week in the red at 1.2996, as speculation that the BOE won't need to raise rates and Brexit jitters weighed on the Pound. According to the official release, inflation in the UK rose by less-than-expected in June, taking off the pressure over Carney, who pledged to be tolerant with inflation above 2% within the ongoing political uncertainty. Negotiations between the UK and the EU didn´t succeed as parts can´t agree on how to deal with the divorce bill, with the EU want it to be monitored by the European Commission, something that the UK rejects. The Pound managed to recover some ground on Friday, but failed to sustain gains beyond the 1.3000 threshold, bouncing from the 61.8% retracement of it latest daily advance at 1.2930, a strong static support for the pair reached last Thursday. In the daily chart, the price settled above a horizontal 20 DMA, while technical indicators hover around their mid-lines, with no clear directional strength. In the 4 hours chart, the pair presents a neutral-to-bearish stance, as the upside is being contained by a bearish 20 SMA and the 38.2% retracement of the mentioned rally at 1.3005, while technical indicators turned marginally lower right below their mid-lines.
Support levels: 1.2965 1.2930 1.2880
Resistance levels: 1.3005 1.3030 1.3075
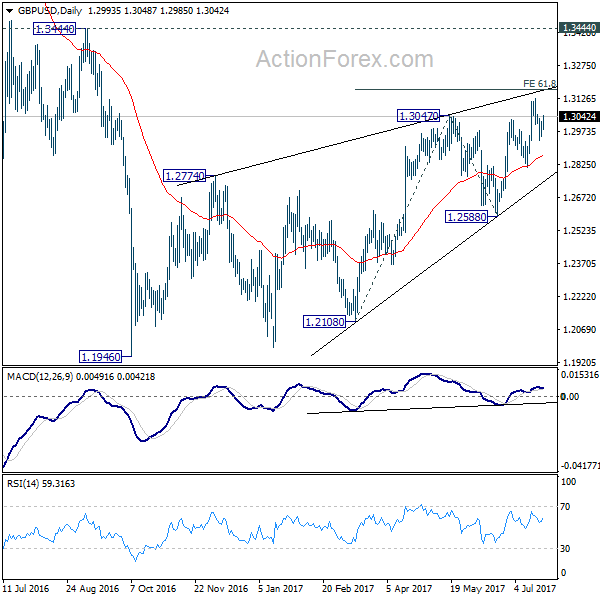
GBP/USD Daily Outlook
Daily Pivots: (S1) 1.2958; (P) 1.2989; (R1) 1.3024; More...
Intraday bias in GBP/USD remains neutral as it's bounded in range of 1.2811/3125. With 1.2811 support intact, another rise is mildly in favor. Break of 1.3125 will target 61.8% projection of 1.2108 to 1.3047 from 1.2588 at 1.3168. Overall, choppy rebound from 1.1946 is seen as a corrective pattern, hence, we'd be cautious on strong resistance from 1.3168 to limit upside. But firm break of 1.3168 will bring further rise towards 1.3444 key resistance. Meanwhile, break of 1.2811 support will be the first sign of reversal and will turn bias to the downside to target 1.2588 key support next.
In the bigger picture, overall, price actions from 1.1946 medium term low are seen as a corrective pattern that is still in progress. While further upside is expected, overall outlook remains bearish as long as 1.3444 key resistance holds. Larger down trend from 1.7190 is expected to resume later after the correction completes. And break of 1.2588 will indicate that such down trend is resuming.
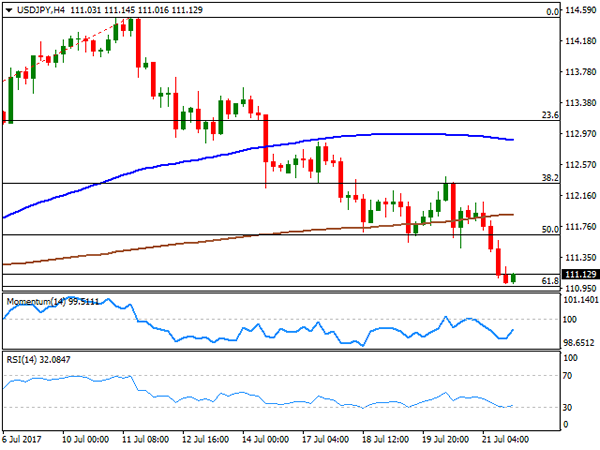
Foreign Exchange Market Commentary: USD/JPY
The USD/JPY pair edged lower for a second consecutive week, plunging on Friday to its lowest in over a month at 111.00, as soft US data and falling US Treasury yields added to US political jitters to send the yen higher this last week. The USD/JPY pair advanced on Thursday, after the Bank of Japan maintained its ongoing monetary policy unchanged, but delayed the timing on when the 2% inflation target is expected to be reached, but the yen quickly resumed its advance on dollar's weakness. As for yields, the 10-year note benchmark in the US traded as low as 2.22% to finally settle at 2.23%, whilst the 30-year note interest posted its largest weekly decline in over three months, down to 2.80%. The week will start with Japan releasing its June leading indexes and July preliminary Manufacturing PMI, this last expected at 52.3 from a previously revised 52.4. The daily chart shows that the pair stands a few cents above the 61.8% retracement of its latest weekly advance at 110.90 the immediate support, having broken below its 100 DMA, this last at 111.45, while technical indicators head sharply lower within bearish territory, all of which support a bearish extension. In the 4 hours chart, technical indicators have bounced modestly from oversold readings, but are far from supporting an upward correction, with the price also developing below its moving averages.
Support levels: 110.90 110.55 110.20
Resistance levels: 111.45 111.90 112.35
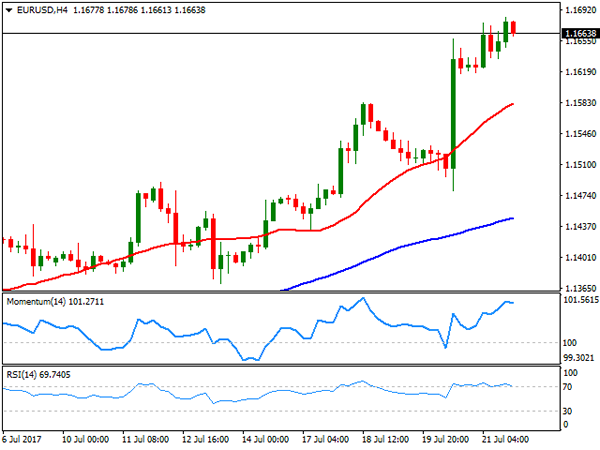
Foreign Exchange Market Commentary: EUR/USD
The EUR/USD pair settled at its highest since August 2015 at 1.1638, up for a second consecutive week. The bullish breakout came on Thursday, following the ECB monetary policy meeting. President Draghi did his best to talk down the Euro, but the market did not believe him, grappled to the line in where he said that changes to the ongoing policies will be discussed next fall. Quantitative easing is set to remain in place until next December, but the market rushed to price in tapering. In the meantime, data released in the US these last days were soft, further backing the ongoing rally in the pair.
Next Wednesday, the US Federal Reserve will have its own monetary policy meeting, a "non-live" one, meaning that it won't include fresh economic reviews or a press conference, which means that there are little chances the event could revert the negative sentiment towards the greenback, unless Yellen & Co. come with a huge, unexpected surprise. In the US, there's just one more rate hike pending for this year, and latest data and political turmoil suggest that the Central Bank will have to pause afterwards. The imbalance between both central banks is shrinking.
From a technical point of view, the pair is clearly overbought and the risk of a downward corrective movement is high for this upcoming days. In the daily chart, however, there is no sign that that could happen, as technical indicators keep heading north, with the RSI at 74, whilst a bullish 20 DMA keeps leading the way higher, currently around 1.1450. In the 4 hours chart, technical indicators have lost upward strength, but are currently consolidating within overbought levels, whilst the price is also well above all of its moving averages. A downward correction towards 1.1460, will hardly the ongoing trend, although below that level, bulls will likely rush to take profits out of the table, fueling the decline.
Support levels: 1.1615 1.1560 1.1520
Resistance levels 1.16600 1.1710 1.1745
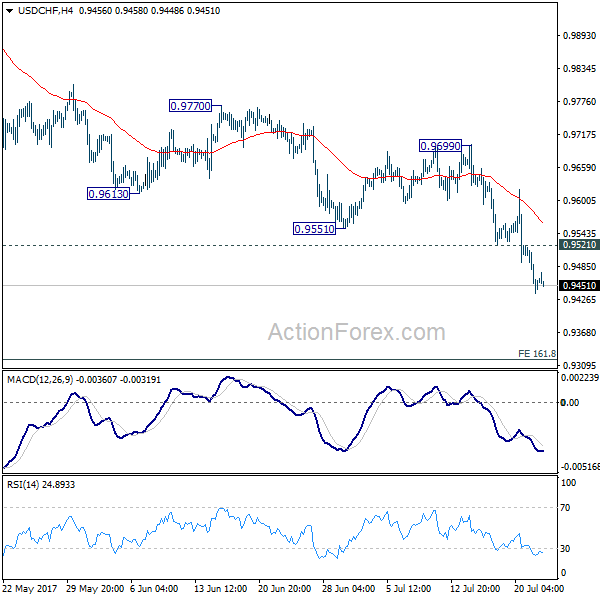
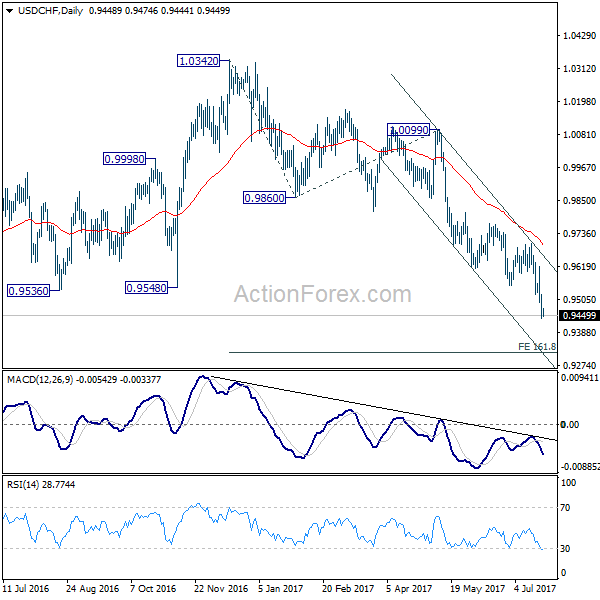
USD/CHF Daily Outlook
Daily Pivots: (S1) 0.9422; (P) 0.9472; (R1) 0.9506; More...
Intraday bias in USD/CHF remains on the downside for the moment. Sustained trading below 0.9443 key support will extend the down trend from 1.0342 to 161.8% projection of 1.0342 to 0.9860 from 1.0099 at 0.9319. On the upside, above 0.9521 minor resistance will turn bias neutral. But outlook will remain bearish as long as 0.9699 resistance holds.
In the bigger picture, focus is now back 0.9443 key support level. Sustained break there indicate underlying bearish momentum and would target 0.9 handle and possibly below. Meanwhile, strong rebound from current level and break 0.9699 resistance will extend long term range trading between 0.9443/1.0342.
Trade Idea: GBP/JPY – Sell at 145.30
GBP/JPY - 144.34
Recent wave: Medium term low formed at 120.50 and (A)-(B)-(C) major correction has commenced with (A) leg ended at 148.45, hence wave (B) is unfolding for retreat to 131.00-10.
Trend: Near term up
Original strategy:
Sell at 147.00, Target: 145.00, Stop: 147.60
Position: -
Target: -
Stop: -
New strategy :
Sell at 145.30, Target: 143.30, Stop: 145.90
Position: -
Target: -
Stop:-
Sterling has remained under pressure after last week’s selloff, suggesting temporary top has been formed at 147.75 earlier this month and consolidation with mild downside bias remains for this fall to bring retracement of recent upmove to 143.50, then towards support at 143.30, however, near term oversold condition should limit downside to 142.90-00 and price should stay above previous resistance at 142.50, bring rebound later.
In view of this, would not chase this fall here and we are looking to sell sterling on recovery as 145.30 should limit upside, bring another decline. Above 145.70-75 would defer and risk a stronger rebound to 146.00 but still reckon resistance at 146.30-35 would limit upside and bring another decline later.
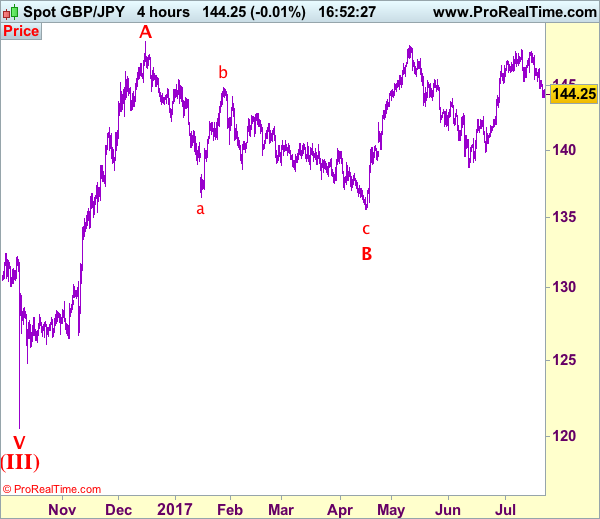
Our preferred count is that larger degree wave V with circle is unfolding from 251.12 with wave (I) 219.34, (II): 241.38 and wave (III) is subdivided into 1: 192.60, 2: 215.89 (23 Jul 2008) and wave 3 ended at 118.87 earlier in 2009. The correction from there to 162.60 is wave 4 which itself is a double three and is labeled as first a-b-c ended at 151.53, followed by wave x at 139.03, 2nd a ended at 162.60, 2nd b at 146.75 and 2nd c leg of wave 4 ended at 163.00. Therefore, the decline from 163.00 to 116.85 is now treated as wave 5 which also marked the end of larger degree wave (III), hence wave (IV) major correction has commenced for retracement of the wave (III) from 241.38 and upside target at 183.95-00 (50% Fibonacci retracement of the wave (II) from 241.38) had been met, a drop below 160.00 would suggest wave (IV) has ended at 195.85, bring decline in wave (V) for initial weakness to 130 (already met) and 120.
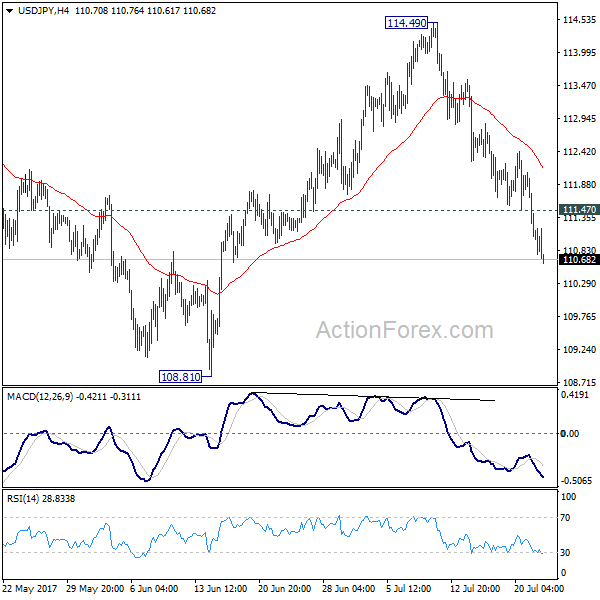
USD/JPY Daily Outlook
Daily Pivots: (S1) 110.73; (P) 111.40; (R1) 111.79; More...
USD/JPY's fall from 114.49 continues today and reaches as low as 110.61 so far. Intraday bias remains on the downside for 108.81 support. As noted before, whole correction from 118.65 is still in progress. Break of 108.81 will confirm and target target 61.8% retracement of 98.97 to 118.65 at 106.48. On the upside, break of 111.47 minor resistance will turn bias neutral and bring recovery before staging another decline.
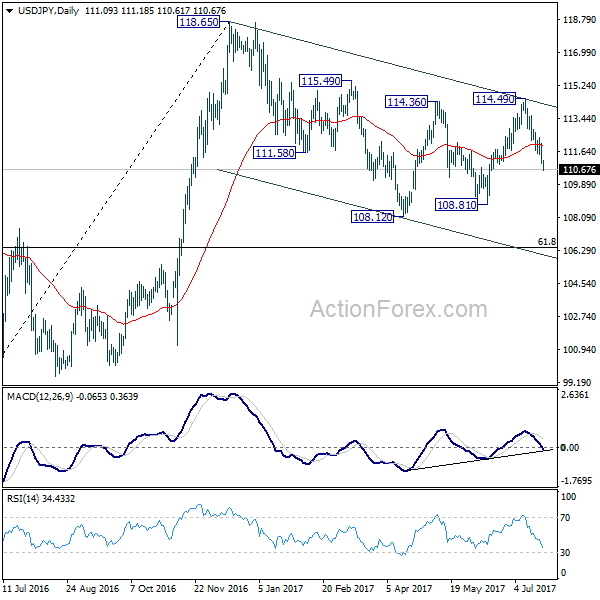
In the bigger picture, the corrective structure of the fall from 118.65 suggests that rise from 98.97 is not completed yet. Break of 118.65 will target a test on 125.85 high. At this point, it's uncertain whether rise from 98.97 is resuming the long term up trend from 75.56, or it's a leg in the consolidation from 125.85. Hence, we'll be cautious on topping as it approaches 125.85. If fall from 118.65 extends lower, down side should be contained by 61.8% retracement of 98.97 to 118.65 at 106.48 and bring rebound.
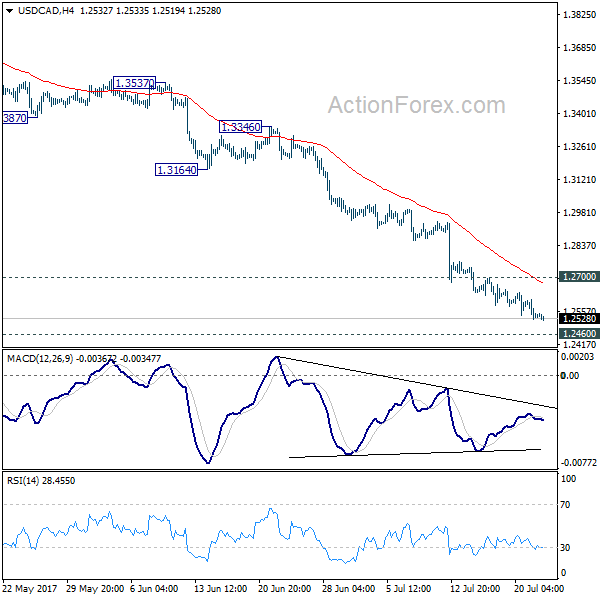
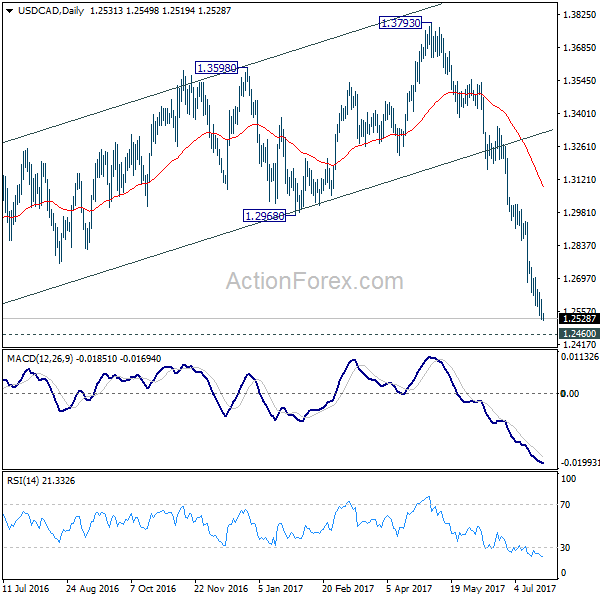
USD/CAD Daily Outlook
Daily Pivots: (S1) 1.2505; (P) 1.2557; (R1) 1.2591; More....
Intraday bias in USD/CAD remains on the downside for 1.2460 key support level. Considering bullish convergence condition in 4 hour MACD, we'll be cautious on strong support from there to contain downside and bring rebound. On the upside, break of 1.2700 resistance will indicate short term bottoming and turn bias back to the upside for 1.2968 support turned resistance.
In the bigger picture, price actions from 1.4689 medium term top are seen as a correction pattern. Fall from 1.3793 is seen as the third leg and should target 50% retracement of 0.9406 to 1.4869 at 1.2048. At this point, we'd look for strong support from there to contain downside and bring rebound. However, firm break there will target 100% projection of 1.4689 to 1.2460 from 1.3793 at 1.1564.
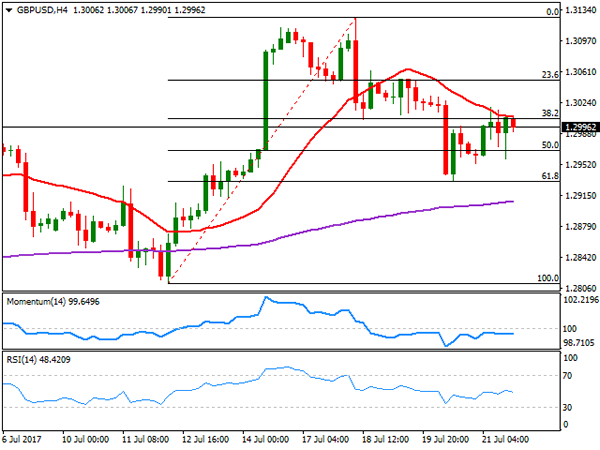
Technical Outlook: GBPUSD – Extended Recovery Pressures 1.3051 Pivot
Cable extends recovery on Monday and holding firm above 1.3000, with fresh acceleration higher hitting session high at 1.3045, just ahead of 1.3051 pivot (Fibo 61.8% 1.3125/1.2932 pullback / 19 July high).
Today's rally is giving strong signals of reversal after pullback from 1.3125 peak found solid support at 1.2931 (just above Fibo 61.8% of 1.2811/1.3125 upleg), where strong downside rejection was seen.
Daily bulls remained intact after pullback and support further recovery which needs close above 1.3051 for confirmation.
Rising and widening 4-hr cloud continues to underpin the action and supports scenario.
UK GDP data on Wednesday are in focus for more signals.
Initial support lies at 1.3021 (4-hr cloud top), followed by psychological 1.3000 support and lower pivot at 1.2968 (4-hr cloud base / daily Tenkan-sen), loss of which would weaken near-term structure.
Res: 1.3051, 1.3080, 1.3100, 1.3125
Sup: 1.3021, 1.3000, 1.2968, 1.2931