Sample Category Title
Daily Technical Analysis: GBP/USD
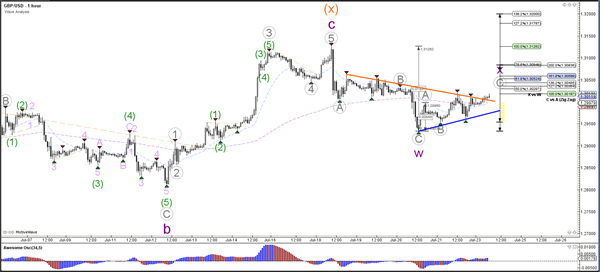
The GBP/USD could be extending its correction via a WXY (purple). The Fibonacci levels of wave X vs W are therefore potential resistance spots for a bearish bounce.
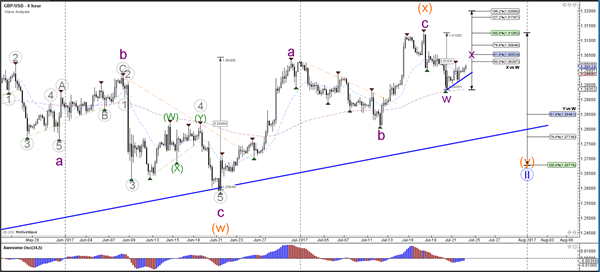
The GBP/USD is probably building an ABC (grey) correction within wave X (purple) unless price manages to break above 1.3080. In that case price could be very impulsive and the wave structure is vulnerable to a change.
Daily Technical Analysis: USD/JPY
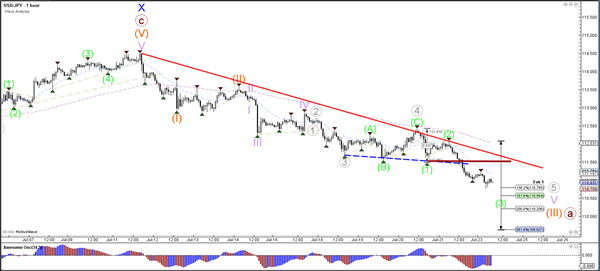
The USD/JPY has moved below the 161.8% Fibonacci target which makes a 5 wave (orange) structure a more likely scenario.
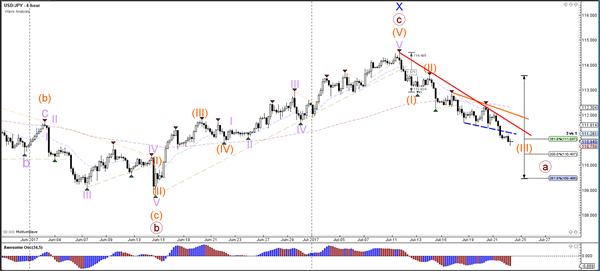
The USD/JPY is most likely extending the wave 5 (grey) with 5 internal waves (green). A wave 4 (green) retracement should remain below the bottom of wave 1 (green) which is indicated by the trend line (dark red).
Trade Idea : EUR/USD – Buy at 1.1580
EUR/USD - 1.1643
Most recent candlesticks pattern : N/A
Trend : Near term up
Tenkan-Sen level : 1.1661
Kijun-Sen level : 1.1660
Ichimoku cloud top : 1.1613
Ichimoku cloud bottom : 1.1578
Original strategy :
Buy at 1.1580, Target: 1.1680, Stop: 1.1545
Position : -
Target : -
Stop : -
New strategy :
Buy at 1.1580, Target: 1.1680, Stop: 1.1545
Position : -
Target : -
Stop : -
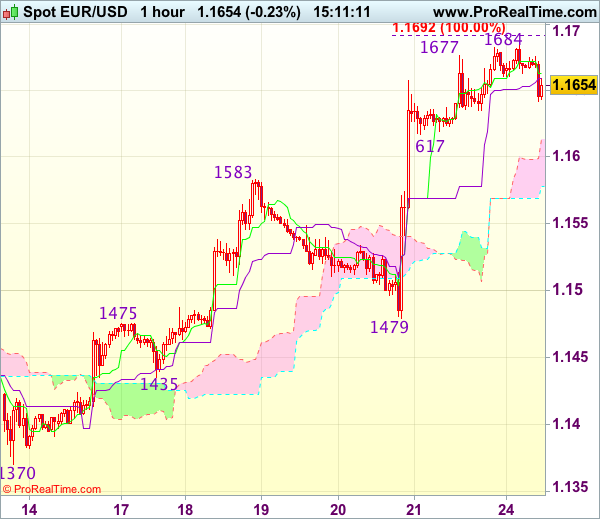
As the single currency has retreated after marginal rise to 1.1684, suggesting consolidation below this level would be seen and pullback to support at 1.1617 is likely, however, reckon previous resistance at 1.1583 would turn into support and contain downside, bring another rise later, above said resistance at 1.1684 would extend recent upmove to previous chart resistance at 1.1714 but break there is needed to retain bullishness for the rise from 1.0340 low to head towards 1.1750.
In view of this, we are looking to buy euro on further pullback as previous resistance at 1.1583 should limit downside. Below 1.1550 would defer and suggest a temporary top is formed instead, bring correction to 1.1510-15 but support at 1.1479 should remain intact.
Daily Technical Analysis: EUR/USD Uptrend Aims For Next Target At 1.1750
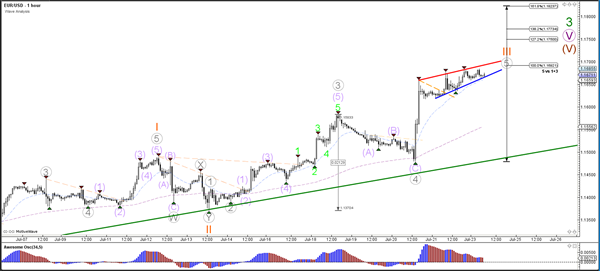
The EUR/USD showed a classical break, pullback and continuation pattern above the 1.15 resistance level. Price is still in a wave 3 (orange) momentum which could last till the next round resistance zone at 1.1750. Once wave 3 is completed, price will most likely build a wave 4 correction which should then see price continue higher via the waves 5 (brown/purple) within wave 3 (green).
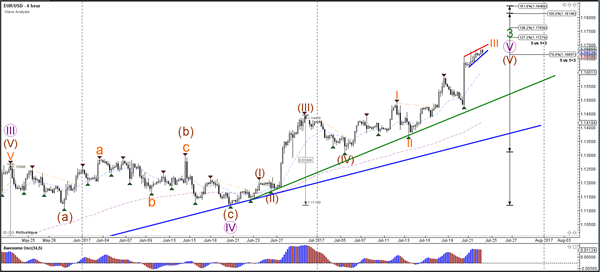
The EUR/USD is building a rising wedge chart pattern which could be a first signal that wave 3 (orange) is coming close to its completion.
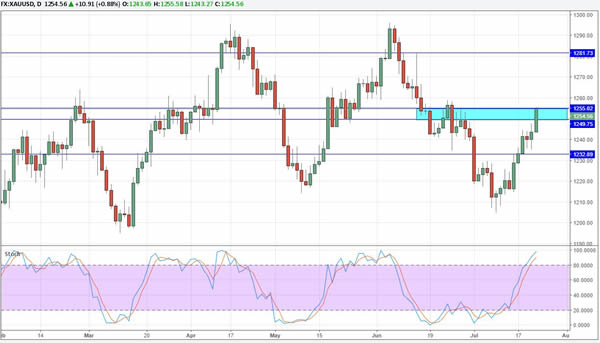
Daily Technical Outlook And Review: XAU/USD
Gold has almost closed the trading day above $1255 on Friday. The precious metal is still very well bid, and a daily close above $1255 signals that the rally could extend to $1280 in the near-term.
To the downside, solid support is now noted at $1243 and $1238.
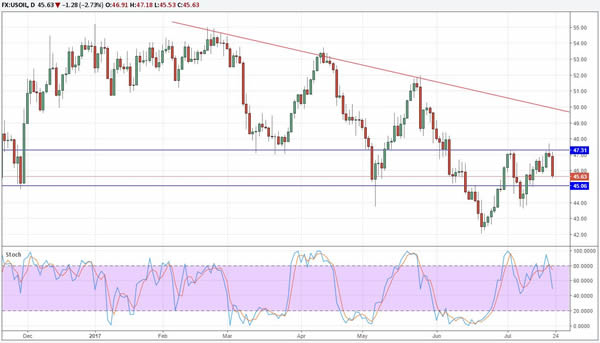
Daily Technical Outlook And Review: WTI
WTI was clearly rejected off $47.30 resistance and is moving towards $45.
A break sub-45 support would confirm the false breakout and pave the way for a retracement towards $42.
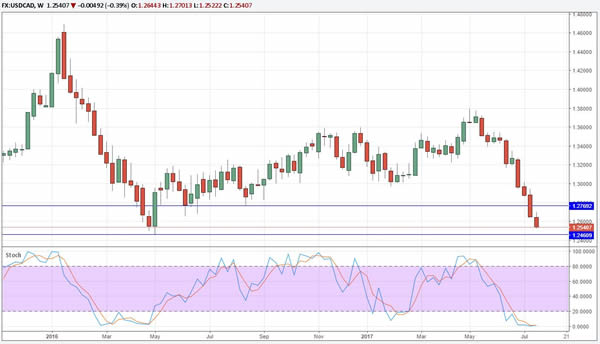
Daily Technical Outlook And Review: USD/CAD
USD/CAD is approaching 1.25 support, although the next big level now lies at 1.2460. A break beneath that level would likely accelerate negative momentum and push the pair towards 1.22.
However, USD/CAD is indeed quite oversold in the short-term, and we might see a bounce back towards 1.26 before further losses occur.
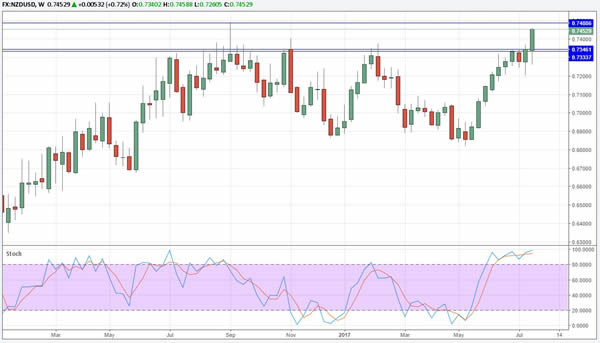
Daily Technical Outlook And Review: NZD/USD
The charts are suggesting that the New Zealand Dollar is heavily overbought in the short-term.
There is negative Stochastic divergence on the Weekly, with NZD/USD also in overbought territory there. In the near-term, expect a retracement towards 0.7350 before a proper continuation of the uptrend happens.
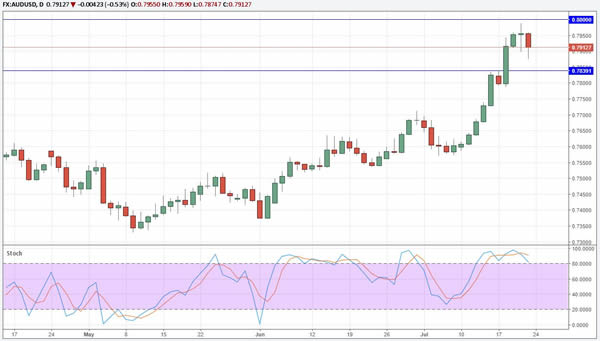
Daily Technical Outlook And Review: AUD/USD
AUD/USD is struggling with resistance at 0.80, and it will not be easy to overcome that hurdle. However, the Aussie Dollar is likely to remain bid on any larger dip and traders can expect good support around 0.7840.
To the topside, 0.80 is the next big resistance level, followed by 0.82.
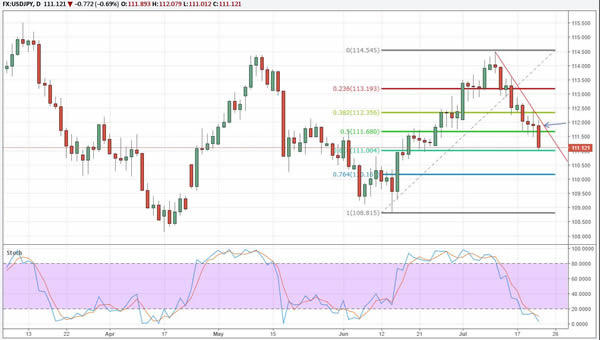
Daily Technical Outlook And Review: USD/JPY
USD/JPY is under renewed pressure and further losses seem likely. The Fibonacci levels of the June/July rally have been respected recently. USD/JPY had a solid bounce off of 111, but the recovery has been rather weak.
Resistance is now seen at the former support level at 111.70. To the downside, a break sub-111 would signal another move towards 110 support.