Sample Category Title
Back To The Futures: 24th July 2017
A snapshot view of large speculative positioning from the weekly COTS report and analysis of related markets.
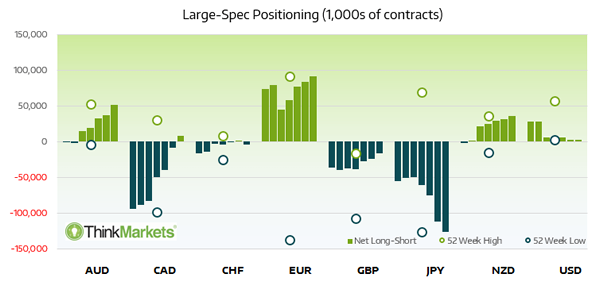
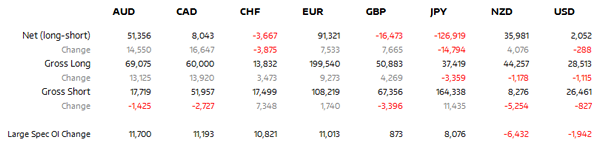
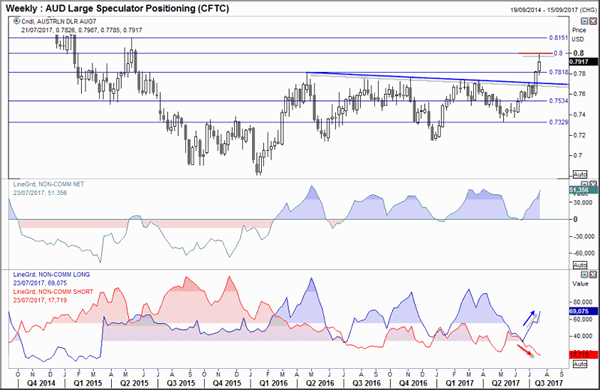
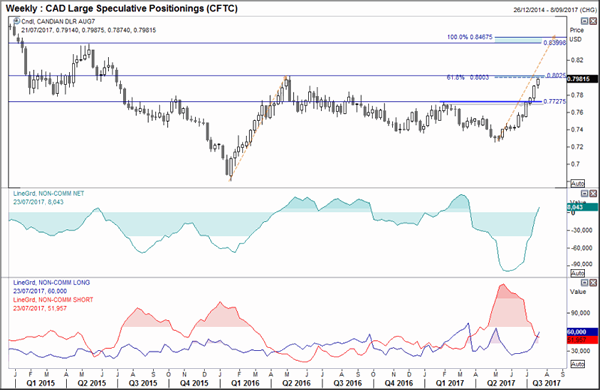
The Canadian and Australian Dollar saw the largest increase in long bets at 13.9k and 13.1k respectively.
CAD saw the largest net change of 16.6k contracts which pushed it to net long for the first time since March. This makes the 8th consecutive week that net change has been positive which was helped by 9 weeks of short covering.
AUD gross shorts fell to their lowest level since Feb 2012 whilst longs moved to their highest since April '17. This also puts net long exposure to its highest since April.
Yen net positioning is now its most bearish since Jan 2014 as gross shorts moved to their highest levels since July 2007.
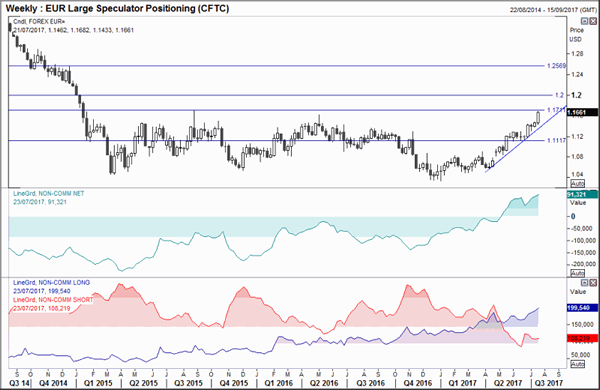
EUR: The Euro is considering a break of the 2015 high and make a run for 1.20. The week closed near the high of the week to suggest continued bullish sentiment, yet as we are just beneath key resistance, we may find this level holds for now as profit taking take hold. Yet as we closed so close to the resistance level, we think the markets clearly want this level to break sooner than later. We remain above a bullish trendline and gross longs continue to trend higher whilst short interest remains subdued, which means Euro will remain on our bullish watchlist as we seek to buy any dips.
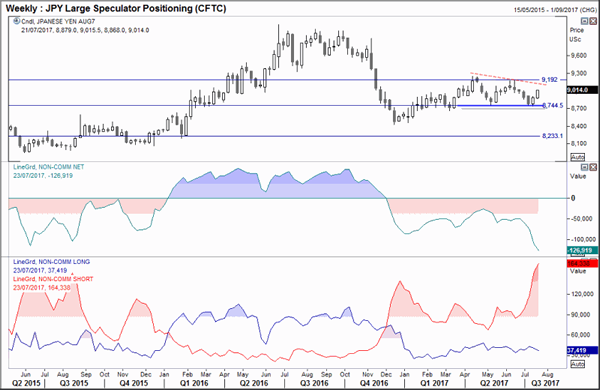
JPY: Traders continue to pile into short positions despite the rising Yen. The two weeks of gains has removed the potential for a double top, although this could form into a triple top of triangle pattern. The lack of bearish interest suggests the rally may fizzle out, although if they are proven to be on the wrong side of the market then there are a lot of shorts to cover which could propel prices higher. For now, our bias is for limited upside on the Yen so we will monitor for signs of weakness. A break of 9,192 invalidates the bearish bias and short-covering could be expected.
AUD: The Australian Dollar stopped within pips of the 80c mark before RBA's assistant governor, Guy Debelle jawboned the currency. A rising currency is causing issues for the RBA as it dents their exports and growth figures, so we may find Tuesday's monetary policy meeting has a dovish twist. Up until Friday's speech, traders continued to pile into longs as shorts were reduced, which is the ideal scenario for a healthy bullish trend. Yet now the EBA has begun verbal interventions once more we may find longs are reconsidering the situation which may see AUD capped below 80c this week. We do not see an immediate threat to the bullish trend which may help it remain above 78c, yet we'll have a firmer idea on Tuesday how dedicated they are to keeping a cap on prices. If there is no dovish twist then 80c could indeed break to the upside this week.
CAD: Where we question AUD's ability to break 80c this week, we have more confidence in CAD's ability to break this milestone. Traders switched to net long for the first time since March as gross longs rise and short continue to be covered. Technically the trend appears strong and sentiment also pushed higher. This makes CAD longs a preferred currency of choice in the week/s ahead as we seek potential opportunities against weaker pairs. Once or if 80c is broken, the 2015 highs of 0.84 are the next milestone which also coincides with a 100% projection.
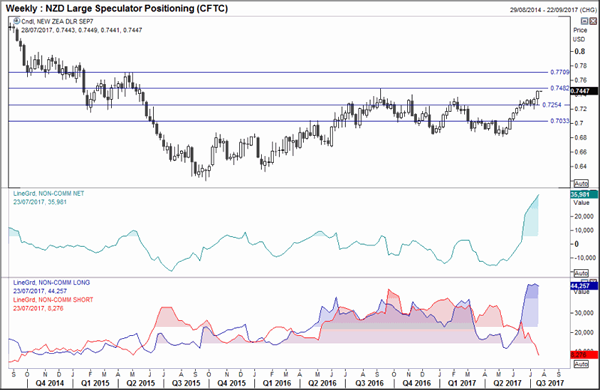
NZD: The Kiwi Dollar continues to fly higher against RBNZ's will. Commodity currencies remain well supported since the USD has been dragged over by flailing Whitehouse policies and soft US data. The positive carry NZD offers only makes the temptation to long the currency even greater. Technically this remains in our bullish watchlist to buy any pullbacks and we could see a break of the 2016 high this week as it moved towards 77c.
Market Morning Briefing: OPEC Meet Today And Fed Meet On Wednesday
STOCKS
Dow (21580.07, -0.15%) bounced back sharply from 21500 but could be trading in the 21500-21750 region for a few more sessions before deciding its further direction. While support near 21500 holds, near term looks bullish.
Dax (12240.06, -1.66%) broke below 12400 to test our initial targets of 12300-12200. Bears look more powerful just now and could push the index towards 12000-11870 levels soon.
Shanghai (3252.69, +0.45%) has been rising as expected and may test resistance near 3270 from where a small dip is possible towards 3220 or lower in the near term. A break above 3270, if seen could take the index to levels near 3280-3295 which is an important resistance to keep an eye on.
Nikkei (19927.29, -0.86%) has broken below the immediate channel support and if that sustains, we could see a fall towards 19800-19700 levels in the near term. While Dollar-Yen continues to fall towards 110 or lower, Nikkei could also see fresh dips in the near term.
Nifty (9915.25, +0.42%) is likely to move higher towards 10000-10050 levels soon limiting its downside to 9800 just now. Near term looks bullish.
COMMODITIES
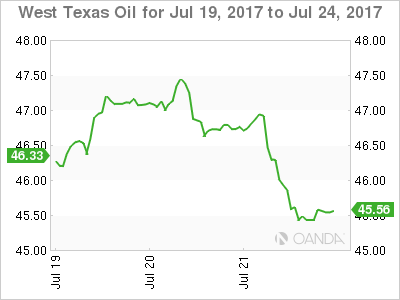
Ahead of the OPEC meet in Russia today, both Brent (48.21) and WTI (45.86) have corrected sharply as they test their respective supports of 48 and 46. The upside chances still remain open as long as Brent trades above 48.00-47.65 and WTI trades above 46.00-45.50.
Gold (1254) broke above the resistance of 1245 to register a high of 1257 this morning but it may find it difficult to rise above the resistance of 1260 on the very first attempt. Silver (16.4560) made an unsuccessful attempt to stay above the resistance of 16.50 but the failure to sustain the higher levels may keep it in the range of 16.20-16.50 for a few sessions more.
Copper (2.725) remains muted and rangebound in 2.66-78. While the resistance of 2.78-80 may not be overcome right now, it may keep trading sideways in the range of 2.55-80 for the next few days.
FOREX
OPEC meet today and Fed meet on Wednesday, 26th Jul'17 are going to set the market mood this week.
Euro (1.1670) is trading close to the final horizontal resistance of 1.1712 and there are equal chances of rising above it or failure near 1.17. At this point, we wait and watch. Naturally, Dollar Index (93.92) remains very weak and the downside target of 93.00 remains unchanged.
On the other hand, Dollar Yen (110.96) has already achieved our downside target of 111.00 and a minor recovery is visible from 110.73. As discussed last week, a strong bounce is a possibility from the 111.00-110.50 region and that warrants caution for the bears at the current levels.
Aussie (0.7921) is in a pause mode as expected and it may trade sideways in the range of 78.50-80.00 for a couple of sessions more before attempting a fresh high above 0.80.
Dollar-Rupee (64.32) has closed below 64.35 for the first time in the last 6 weeks. The charts themselves suggest greater chances of further downside towards 64.10 in case the immediate Support at 64.28 breaks. Whether further decline below 64.10 is seen or not might be dependent on the Euro breaking above 1.1713. We need to wait and watch on that.
INTEREST RATES
The US yields could come down a little more before rising again. The 30YR (2.81%) could come off towards 2.75% before pausing to see a corrective upmove. The 10YR (2.23%) and the 5Yr (1.80%) also have some room on the downside towards 2.18% and 1.70% respectively.
The US-Japan 10YR (2.16%) yield spread has fallen sharply and is testing immediate support just below current levels. If the support holds, the spread could bounce back in the next couple of sessions and could pull up Nikkei and Dollar Yen with itself.
The UK yields are also trading low and could move down in the near term. the 10Yr (1.17%), and the 20Yr (1.71%) could test 1.10% and 1.62% respectively. Near term looks bearish.
The Japanese yields are trading just above immediate supports and could bounce back in the coming sessions. Near term looks bullish.
EUR/USD Strongly Bullish, GBP/USD Setting Up For Further Increase, USD/JPY On The Way Down
EUR/USD strongly bullish
Price rallies and seems unstoppable on the Daily chart, is located above the 1.1660 level and could hit fresh new highs in the upcoming days. Is strongly bullish as the USD is weakened by the USDX’s impressive sell-off.
The index has fallen below the 94.00 psychological level and most likely will resume the bearish momentum, could approach the 92.49 major static support in the upcoming period, a further drop will force the USD to depreciate further versus its rivals.
Remains to see how will react when will touch the 1.1700psychologica level, could find temporary resistance at this static obstacle, but a valid breakout will attract more buyers.
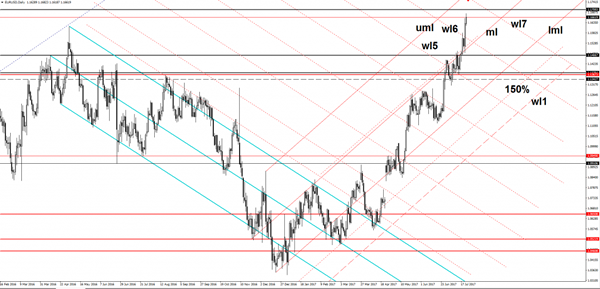
EUR/USD edged higher in the last day’s and touched the 1.1682 level should climb higher in the upcoming days because the dollar is under massive selling pressure. The next major upside target is at the 1.1712 level, will approach this level because we don’t have any exhaustion sign, another important leg lower will come if the rate will drop and will stabilize below the median line (ml) of the ascending pitchfork.
Could also be attracted by the upper median line (uml) of the ascending pitchfork and by the seventh warning line (wl7) of the former descending pitchfork, could find resistance at this levels.
The outlook will remain bullish as long as is trading within the ascending pitchfork’s body, right now will be better to stay away because we don’t have any trading opportunity.
We may have some action tomorrow because the US and the Euro-zone are to release significant reports, the fundamental factors could take action the lead and could drive the rate, remains to see the direction.
GBP/USD setting up for further increase
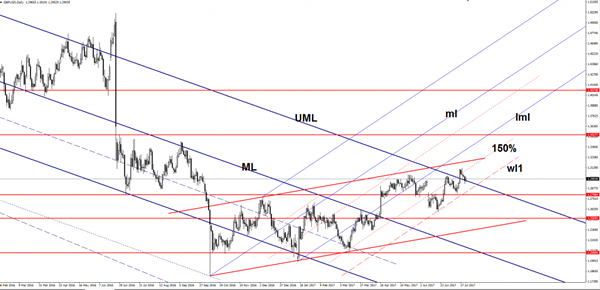
Price surged on Friday and managed to stay above a broken major dynamic resistance, the short retreat was somehow expected after the impressive bullish rally.
Continues to move within the ascending channel, so the perspective is bullish in the upcoming period despite the minor retreat. GBP/USD decreased a little in the previous week after the failure to reach the upside line of the ascending channel .
Has come down to retest the upper median line (UML) of the major descending pitchfork, we may have a buying opportunity if will retest the warning line (wl1) as well. The sentiment will change if the rate will stabilize outside the descending pitchfork’s body.
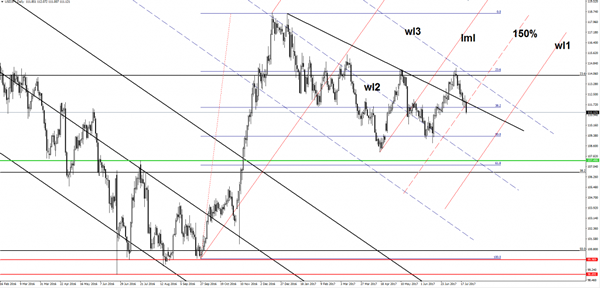
USD/JPY on the way down
USD/JPY decreased sharply on Friday, signalling that the bears are if full control on the short term, should drop much deeper if the USDX will touch fresh new lows.
Has broken below the black downtrend line and below the 38.2% retracement level and looks determined to drop much below the 111.00 psychological level. Is moving somehow sideways between the 23.6% and the 50% retracement level, could approach the 50% level and the first warning line (wl1) these days. We’ll have a selling opportunity if will come back to test and retest the broken levels.
EURUSD – Bullish, Remains On The Offensive
EURUSD - With the pair holding on to its upside pressure, more strength is expected in the new week. Resistance comes in at 1.1700 level with a cut through here opening the door for more upside towards the 1.1750 level. Further up, resistance lies at the 1.1800 level where a break will expose the 1.1850 level. Its daily RSI is bullish and pointing higher suggesting further strength. Conversely, support lies at the 1.1600 level where a violation will aim at the 1.1550 level. A break of here will aim at the 1.1500 level. All in all, EURUSD faces further upside pressure.
GOLD – Faces Further Upside Threats On Bull Pressure
GOLD - With the commodity continuing to retain its recovery risk, more strength is expected in the new week. On the downside, support comes in at the 1,250.00 level where a break will turn attention to the 1,240.00 level. Further down, a cut through here will open the door for a move lower towards the 1,230.00 level. Below here if seen could trigger further downside pressure targeting the 1,220.00 level. Conversely, resistance resides at the 1,260.00 level where a break will aim at the 1,270.00 level. A turn above there will expose the 1,280.00 level. Further out, resistance stands at the 1,290.00 level. All in all, GOLD looks to recover further higher.
EUR/USD Already Reaches Top Of Daily Range
Good morning traders,
How was your weekend? I hope it was as productive as mine
But as always, we're back on Monday morning ready and raring to go with another look at the EUR/USD chart.
After EUR/USD broke out of its channel last week, price has continued higher all the way to now sit just 30 pips away from the daily range top.
EUR/USD Daily:
What a rally!
After breaking out of the channel, the move has been swift and with a ton of momentum behind it. Anyone selling the top of that channel would have had their stops just above, which exaggerated the speed of the move up to the next resistance level that we're at now.
There was a nice little breakout and retest of channel resistance though.
EUR/USD Daily 2:
Even when markets have momentum behind them, they still almost always trade in a technical manner and this is just another textbook example.
Venezuela May Make Or Break Oil’s Recovery
Oil tanked on Friday with an OPEC meeting today, but perversely Venezuela may end up doing what OPEC can’t.
Crude oil prices ran into a brick wall on Friday night with both contracts falling over 2.0% in late New York trading. The move itself was driven more by technical factors rather than any one piece of news, with traders squaring up ahead of the weekend and possibly ahead of OPEC/Non-OPEC’s technical meeting in St Petersburg today. This meeting should not provide any surprises in itself unless they announce that compliance has fallen or adjust their market rebalancing forecasts.
From a technical perspective however, Friday’s price action was not constructive, with Brent spot failing ahead of it’s 100-day moving average at 50.55 and WTI’s at 47.80. These two levels will now become key pivot areas as we move into a packed data week.
Looming on the horizon for oil traders is the 30th of July and Venezuela. This is the date the Venezuela intends to enact constitutional amendments the United States deems illegal and will impose immediate sanctions over. This has the potential to finally send Venezuela into bankruptcy torpedoing their oil exports. This would also impact U.S refiners already suffering from reduced heavy oil exports from Saudi Arabia. With U.S. refiners importing approximately 900,000 barrels a day from Venezuela, the sanctions could potentially send crudes prices higher.
Looking to today’s Asian session, Brent spot should open around 48.00 with ascending trend line support at 47.25 with resistance far away at 49.55.

WTI spot trades slightly higher from Friday at 45.50 with ascending trending support at 44.80 and resistance distantly at 47.00.
All eyes will now turn to the St Petersburg meeting this afternoon.
The Song Remains The Same
Global markets took a turn for the worse heading into weeks end as the lethal combination of political uncertainty and the void of encouraging US economic data weighed on investor confidence which was further dented by swooning oil prices.
G3 central bank's policy will continue to influence currencies while US political uncertainty sounds a harsh tone for the Greenback.
Australian Dollar
RBA's Debelle burst the AUD bulls balloon leaning heavy against the markets inference of the neutral nominal rate comment in an attempt to jawbone the currency lower. Aussie bears were quick to pounce driving the pair below .7900, but with the Greenback still labouring, bids held firm at .7875-80 .However, retracement momentum petered out into the weekend powered by positioning-led price action.
Traders have likely attached way too much emphasis on the RBA minutes which had dealers scrambling for topside exposure on the Aussie cores. The reality is the RBA was a reluctant rate cutter and never went as low as other central banks, so there is no need to follow the G-10 CB policy pivots just yet. Based on this view we could see a further washout of the short term long AUD positioning.Support comes in at .7875 ( Friday Low) but with a sagging Greenback, it's best to express any Aussie negative bias through the crosses.
Ultimately the RBA are caught between a rock and a hard place. Even if they wanted to hike rates, the huge levels of household debt which put Australia near the top the household indebtedness world ranking's would leave many unable to service their mortgage commitment.
This weeks focus will be on the key Aus domestic CPI, in the meantime, the ebb and flow of risk sentiment will show the way for the Australian Dollar
Euro
There has been very little backpedalling on the long EURO storyline as dealers continue to place much emphasis on Draghi declining the opportunity to talk down the currency post ECB minutes. And factoring in the expanding US political sinkhole which is weighing on broader USD sentiment, it's unlikely the market has run out of steam. With more FOMO (the fear of missing out) likely to kick in, it's odds on we test the August 2015 high of 1.1715 sooner than later.
EUR/USD Weekly Outlook
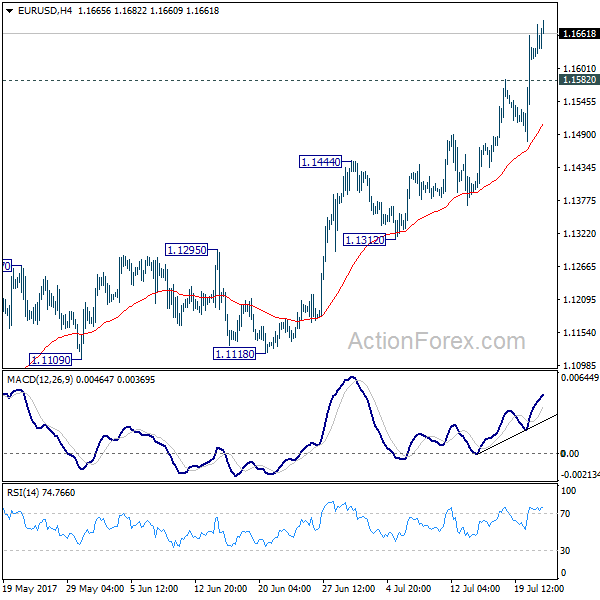
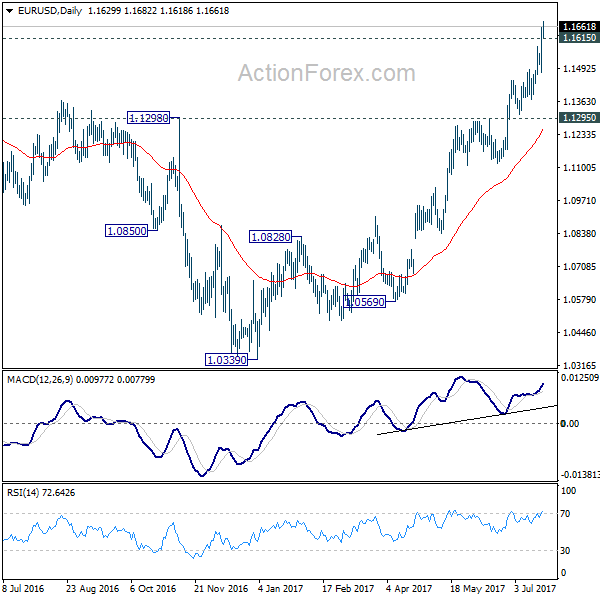
EUR/USD's rally accelerated to as high as 1.1682 last week and took out 1.1615 resistance. There is no sign on topping yet and initial bias remains on the upside. Current rise should now extend to 1.2 handle next. On the downside, below 1.1582 minor support will turn intraday bias neutral and bring consolidations. But downside should be contained by 1.1444 resistance turned support and bring rise resumption.
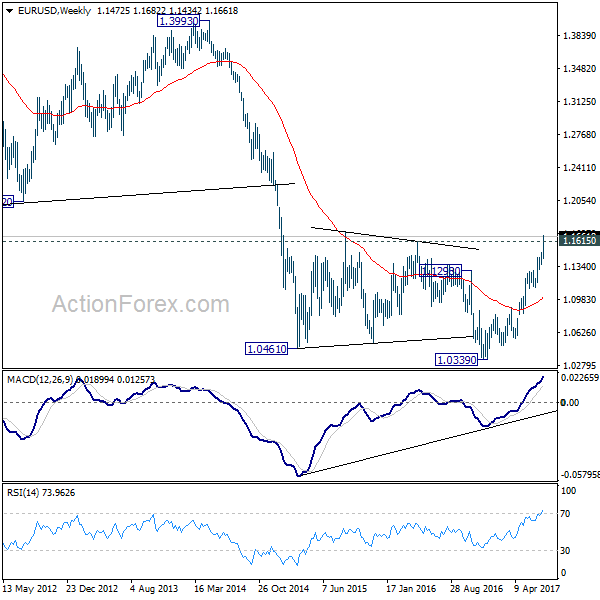
In the bigger picture, an important bottom was formed at 1.0339 on bullish convergence condition in weekly MACD. Sustained break of 55 month EMA (now at 1.1760) will pave the way to key fibonacci level at 38.2% retracement of 1.6039 (2008 high) to 1.0339 (2017 low) at 1.2516. While rise fro 1.0339 is strong, there is no confirmation that it's developing into a long term up trend yet. Hence, we'll be cautious on strong resistance from 1.2516 to limit upside. But for now, medium term outlook will remain bullish as long as 1.1295 support holds, in case of pull back.
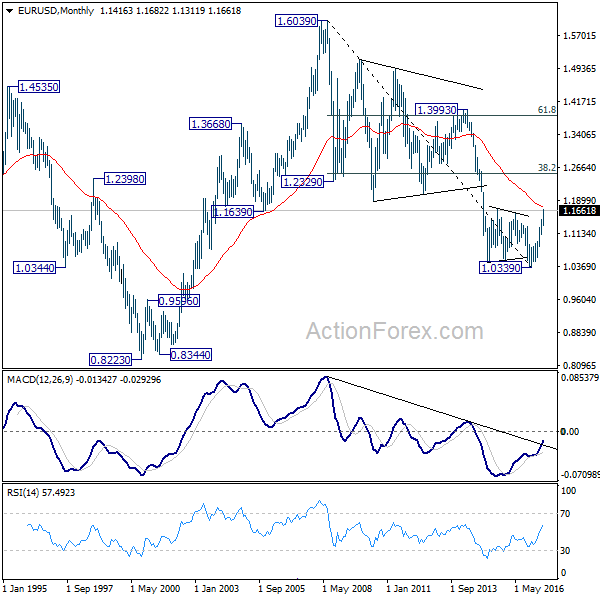
In the long term picture, 1.0339 is now seen as an important bottom as the down trend from 1.6039 (2008 high) could have completed. It's still early to decide whether price action form 1.0339 is developing into a corrective or impulsive move. But in either case, further rally would be seen to 38.2% retracement of 1.6039 to 1.0339 at 1.2516
USD/JPY Weekly Outlook
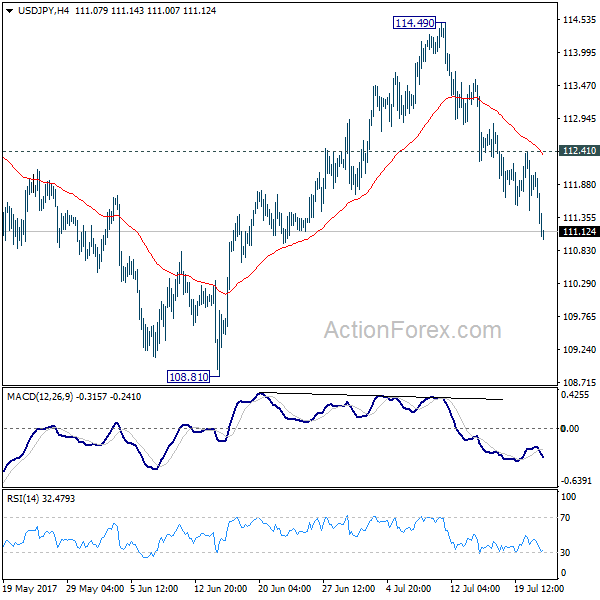
USD/JPY's fall from 114.49 extended lower last week. The development affirmed the view that rebound from 108.81 is completed at 114.49. More importantly, whole correction from 118.65 is possibly still in progress. Initial bias stays on the downside this week for 108.81 support first. Break there will target 61.8% retracement of 98.97 to 118.65 at 106.48. On the upside, break of 112.41 minor resistance is needed to indicate short term bottoming. Otherwise, outlook will remain mildly bearish in case of recovery.
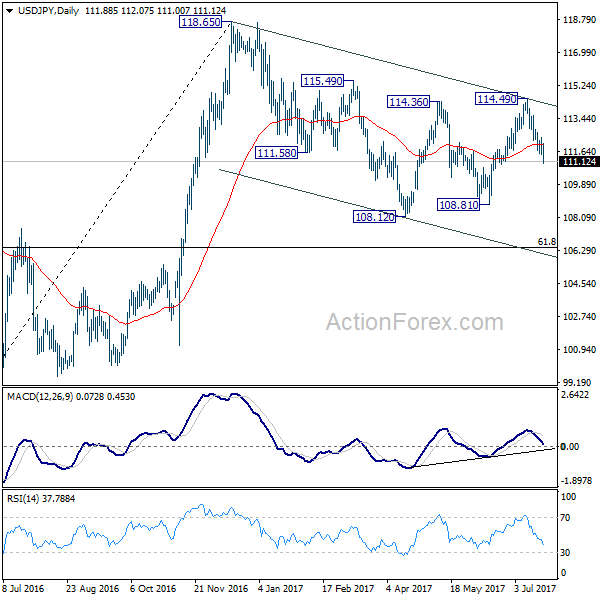
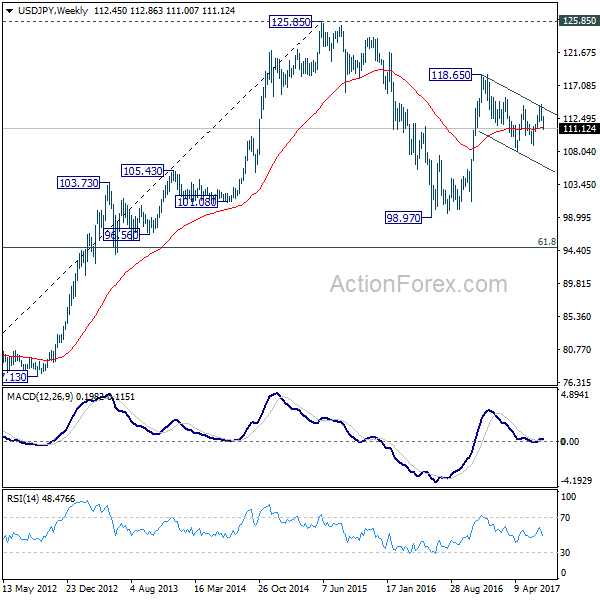
In the bigger picture, the corrective structure of the fall from 118.65 suggests that rise from 98.97 is not completed yet. Break of 118.65 will target a test on 125.85 high. At this point, it's uncertain whether rise from 98.97 is resuming the long term up trend from 75.56, or it's a leg in the consolidation from 125.85. Hence, we'll be cautious on topping as it approaches 125.85. If fall from 118.65 extends lower, down side should be contained by 61.8% retracement of 98.97 to 118.65 at 106.48 and bring rebound.
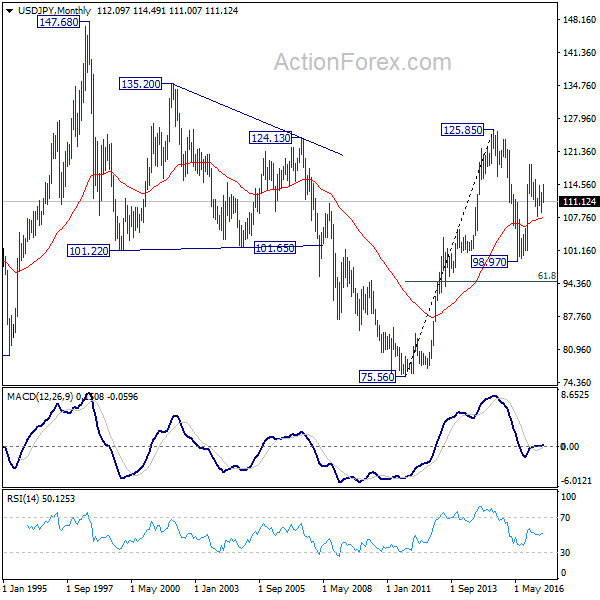
In the long term picture, the rise from 75.56 long term bottom to 125.85 top is viewed as an impulsive move. Price actions from 125.85 are seen as a corrective move which could still extend. But, up trend from 75.56 is expected to resume at a later stage for above 135.20/147.68 resistance zone.