Sample Category Title
How to Identify and Trade the Strongest Part of a Trend – Part 1
Technical indicators are often used by traders for a number of reasons, but primarily to detect the changes in the markets. Technical indicators are relied upon for signs of any change in direction, or the momentum in the price of the underlying security as well as volatility in the markets.
Among the different types of indicators and the variables that they seek to measure, identifying trends in prices are the most commonly used indicators.
While there are various trend based indicators, the moving average indicators are the most commonly used technical indicators. However, while the indicator tends to show trends clearly during trending markets, the moving average often succumbs to flat markets.
Traders using the moving averages and caught with the flat markets are often subject to whipsaws which can turn out to be extremely risky when trading.
A question that is commonly asked by traders is in knowing when the trend is the strongest to maximize the profits for the risk taken. In this article, we look at how two standard indicators can help traders to identify the strongest part of the trend.
In this two-part article, we take a detailed look at how to identify the strongest parts of the trend and also look at some ways on how to trade the trends when they are at the strongest in terms of momentum.
Identifying strong trends with the ADX and MACD
Replacing the moving average with the Average Directional Index (ADX) and the Moving average convergence and divergence (MACD) indicator offers a better alternative to catch the trends in the market, including identifying whipsaw markets.
The ADX is used as a trend detection indicator, but it has a major shortcoming. The ADX does not show the direction of the trend, but only the strength of the trend. This is overcome by making use of the MACD which can signal trends as well as sideways price action.
The chart below shows the ADX line added along with the MACD and the signal line. The default values are used.
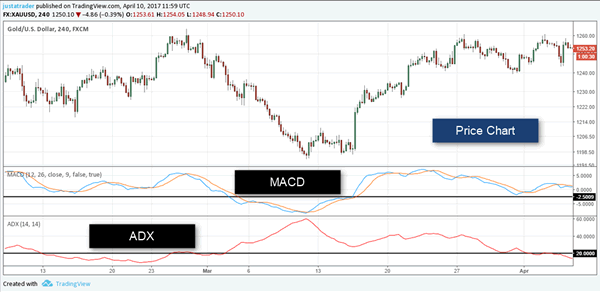
ADX and MACD applied on the price chart
Identifying the trends
The trend identification is very simple.
In an uptrend, you should see the MACD line above the signal line. It doesn't really matter if the MACD and the signal line are above or below the zero-line. Once the first criterion is met, the next rule is to look at the ADX line.
Typically, an ADX above 20 signals a moderate trend and above 30 signals a strong trend.
In a downtrend, the same rules apply. Look for the MACD line to be below the signal line while looking to the ADX to signal the trend strength.
The chart below gives a few examples.
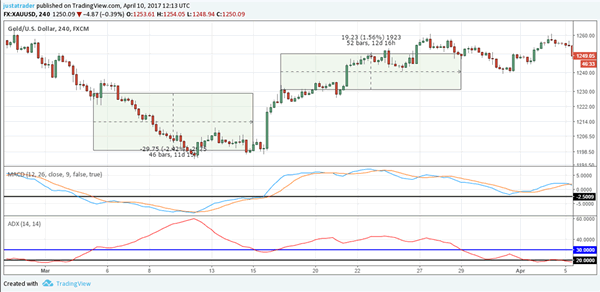
Downtrend and the uptrend examples using ADX and MACD
In the first example, you can see the downtrend that was signaled by the MACD and later confirmed as the ADX started to rise above 30. Of course, one can also start trading when the ADX rises above 20. It is a matter of personal opinion.
The short position is held until the ADX rises and then falls back to 30 or within the 20 - 30 level.
The first example positioned the trade to trade a move of $29.75 in gold.
A few sessions later, as the markets start to move sideways, the ADX also falls within the 20 - 30 level before starting to rise again, following the bullish trend signal given by the MACD oscillator.
Here, a long position is taken on the uptrend and this trade would have kept the trade running for a $19.23 move in gold.
In the second example note that we are no longer concerned by the subsequent bearish or bullish signals triggered by the MACD. Once a trade is entered, we simply exit when the ADX falls back to the 20 - 30 line.
Now that we have an understanding of how to use the ADX and the MACD, in the next part we will look at how to trade using this system.
Trade Idea : USD/JPY – Sell at 112.70
USD/JPY - 112.08
Most recent candlesticks pattern : N/A
Trend : Near term down
Tenkan-Sen level : 112.06
Kijun-Sen level : 112.03
Ichimoku cloud top : 112.73
Ichimoku cloud bottom : 112.38
New strategy :
Sell at 112.70, Target: 111.70, Stop: 113.05
Position : -
Target : -
Stop : -
Although the greenback has recovered after falling to 111.68 yesterday and minor consolidation above this level would be seen, as the selloff from 114.50 signals top has been formed there, reckon upside would be limited to the upper Kumo (now at 112.73) and bring another decline, below said support at 111.68 would extend the fall from 114.50 top to 111.50, then 111.20-25 but reckon 111.00 would hold from here due to loss of downward momentum.
In view of this, would not chase this fall here and would be prudent to sell dollar on recovery as 112.70-75 should limit upside. A firm break above resistance at 112.87 would defer and risk a stronger rebound to 113.10-20 but price should falter below resistance at 113.58, bring another selloff later.

Is Gold’s Corrective Wave Entering Its Final Stages?
Key Points:
- Despite recent bullishness, gold should reverse rather shortly.
- The ongoing ABC wave is likely to enter its final stages.
- Losses should not extend past the 1180.05 handle
Gold prices have been on the mend in recent weeks but, in doing so, they could be preparing the metal for another slide to the downside in the near-term. Indeed, the rally back to the 100 day moving average could simply be a prelude to a major tumble - the final push lower in the broader ABC pattern that we have been tracking for some time.
As shown below, despite reversing somewhat later than originally anticipated, gold has beenfairly faithful to the forecasted corrective wave and is now reaching the final reversal point in the structure. As a result, selling pressure should now be on the rise and the bears could soon be back in the driving seat for the metal. However, we don't have to rely solely on the chart pattern to reach this conclusion as numerous other technical signals also indicate that downside risks are increasing.
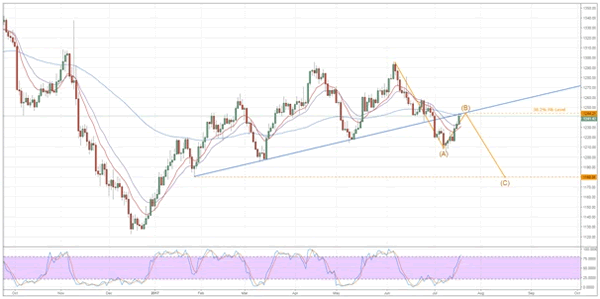
For one thing, the 12, 20, and 100 day moving averages are almost certainly goingto be having a bearish influence on the yellow metal. As shown, even after a notable uptick in buying pressure over the prior weeks, all three averages remain in the most bearish configuration possible. What's more, the 100 day measure is perfectly placed to encourage a reversal as it rests just above price action and, coincidentally, at the 38.2% Fibonacci retracement.
Further adding to our bearish bias is gold's proximity to the old trendline which could now prove to be a source of resistance, rather than support. However, the metal could also stray above this line briefly as the stochastic and RSI readings remain neutral which leaves the upside somewhat exposed to a brief surge in buying pressure - potentially from a fundamental or political upset.
Overall, keep a close eye on gold prices moving forward as the metal could still have some surprises instore. Nevertheless, for the reasons detailed above, the technical outlook is rather grim which should predispose gold prices to a reversal or at least mitigate the effects of any bullish fundamental results posted in the immediate future. In the event that we do see a reversal and subsequent downtrend, losses should be capped at around the 1180.05 handle. At this point, the bulls should stage a bit of a comeback and might even push the metal back to around the 1200.00 mark.
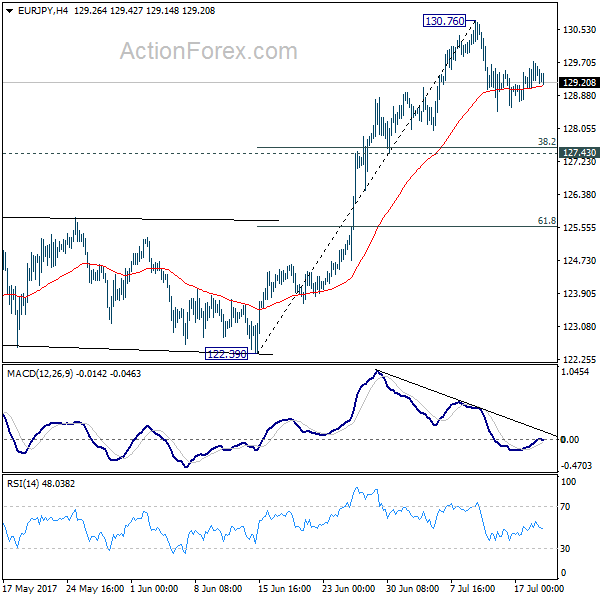
EUR/JPY Daily Outlook
Daily Pivots: (S1) 129.09; (P) 129.42; (R1) 129.77; More...
Intraday bias in EUR/JPY remains neutral as consolidation from 130.76 continues. Deeper fall might be seen. But downside should be contained by 127.43 cluster support (38.2% retracement of 122.39 to 130.76 at 127.56) and bring rebound. Above 130.76 will extend the larger rally to next key fibonacci level at 134.20.
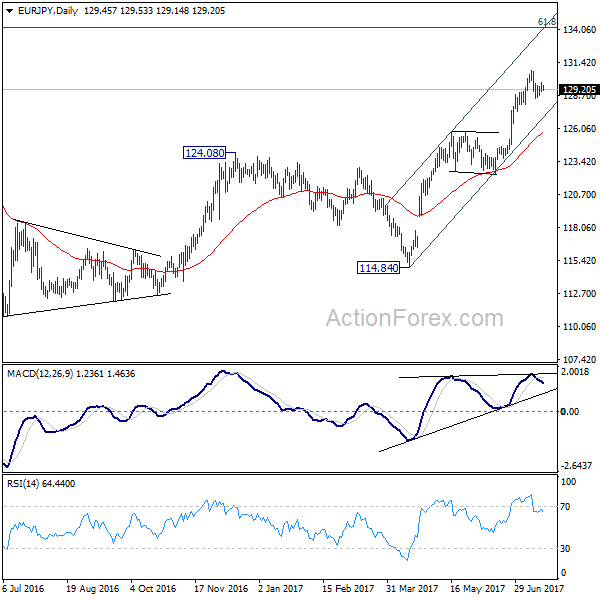
In the bigger picture, the down trend from 149.76 (2014 high) is completed at 109.03 (2016 low). Current rally from 109.03 should be at the same degree as the fall from 149.76 to 109.03. Further rise is expected to 61.8% retracement of 149.76 to 109.03 at 134.20. Sustained break there will pave the way to key long term resistance zone at 141.04/149.76. Medium term outlook will remain bullish as long as 124.08 resistance turned support holds.
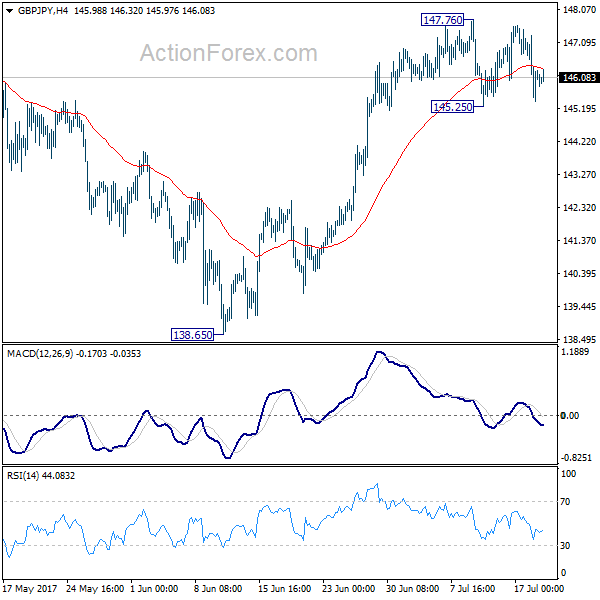
GBP/JPY Daily Outlook
Daily Pivots: (S1) 145.23; (P) 146.27; (R1) 147.16; More
GBP/JPY is staying in range of 145.5/147.76 and intraday bias remains neutral first. On the upside break of 147.76 will resume rise from 138.65. And firm break of 148.42 key resistance will also resume the whole rally from 122.36 to long term fibonacci level at 150.43 and above. Meanwhile, on the downside, break of 145.25 will revive the case of rejection from 148.09/42 resistance zone. Intraday bias would then be turned back to the downside for 55 day EMA (now at 143.88) and below.
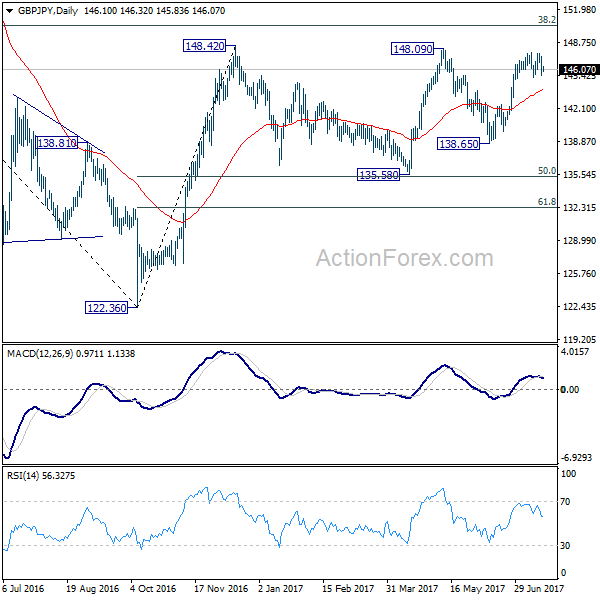
In the bigger picture, rise from medium term bottom at 122.36 is expected to continue to 38.2% retracement of 196.85 to 122.36 at 150.43. Decisive break there will carry long term bullish implications and pave the way to 61.8% retracement at 167.78. In case the sideway pattern from 148.42 extends, we'd be looking for strong support from 135.58 and 50% retracement of 122.36 to 148.42 at 135.39 to contain downside.
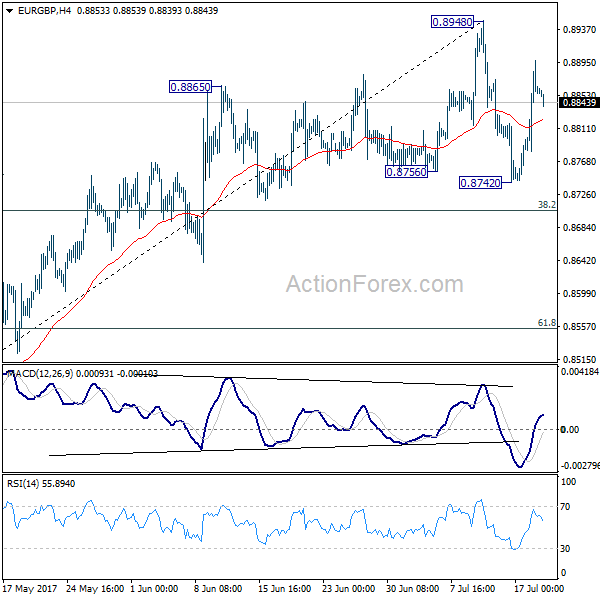
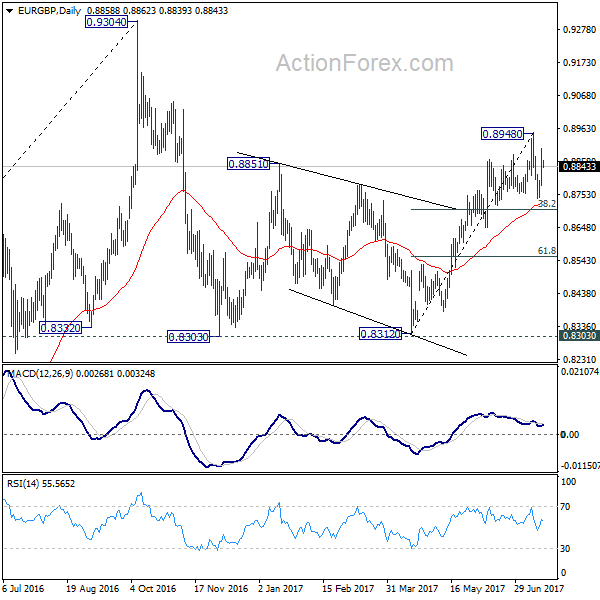
EUR/GBP Daily Outlook
Daily Pivots: (S1) 0.8794; (P) 0.8846; (R1) 0.8911; More
Intraday bias in EUR/GBP remains neutral for the moment as it's staying in range of 0.8742/8948. On the downside, below 0.8742 will target 38.2% retracement of 0.8312 to 0.8948 at 0.8705 first. Break will target 61.8% retracement at 0.8555 next. However, break of 0.8948 will extend the rebound from 0.8312 towards 0.9304 resistance.
In the bigger picture, price actions from 0.9304 are viewed as a medium term corrective pattern. It's uncertain whether it is finished yet. But in case of another fall, we'd expect strong support from 0.8116 cluster support (50% retracement of 0.6935 to 0.9304 at 0.8120) to contain downside and bring rebound. Whole up trend from 0.6935 is expected to resume after consolidation from 0.9304 completes.
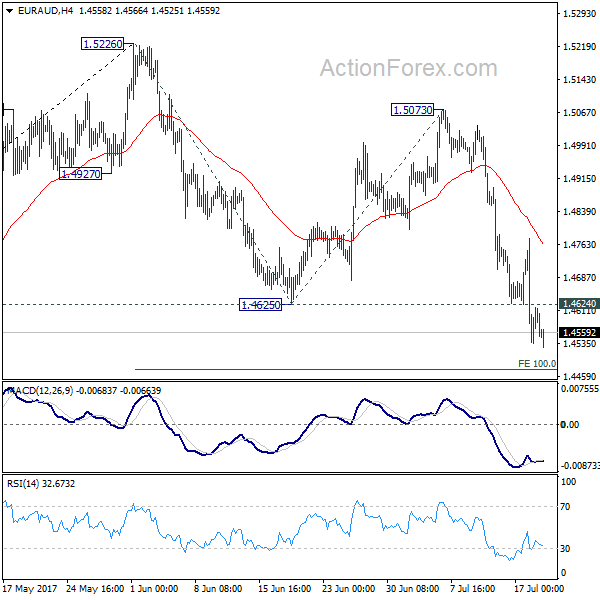
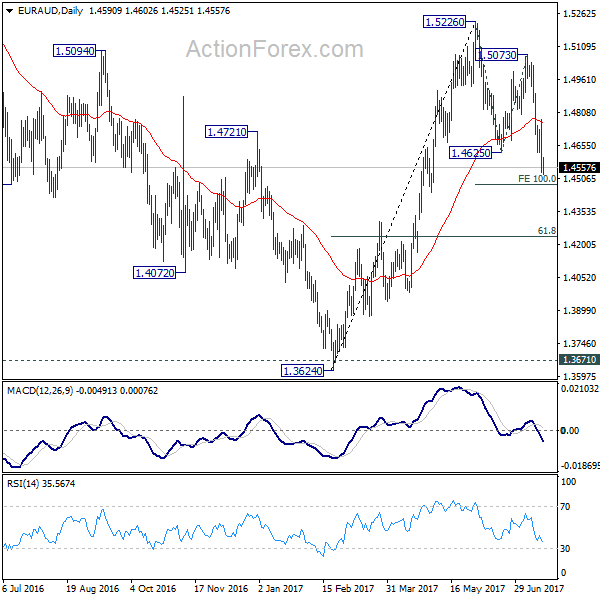
EUR/AUD Daily Outlook
Daily Pivots: (S1) 1.4492; (P) 1.4634; (R1) 1.4734; More...
Intraday bias in EUR/AUD remains on the downside as current fall from 1.5226 is targeting 100% projection of 1.5226 to 1.4625 from 1.4472 next. Firm break there would pave the way to larger fibonacci level at 61.8% retracement of 1.3624 to 1.5226 at 1.4236. On the upside, above 1.4624 minor resistance will turn intraday bias neutral first.
In the bigger picture, we're holding on to the view that corrective decline from 1.6587 medium term has completed at 1.3624. But we will monitor the structure of the decline from 1.5226 to adjust our view. Above 1.5226 will target a test on 1.6587 key resistance. However, further downside acceleration will dampen our view and would drag EUR/AUD lower to retest key support zone around 1.3624.
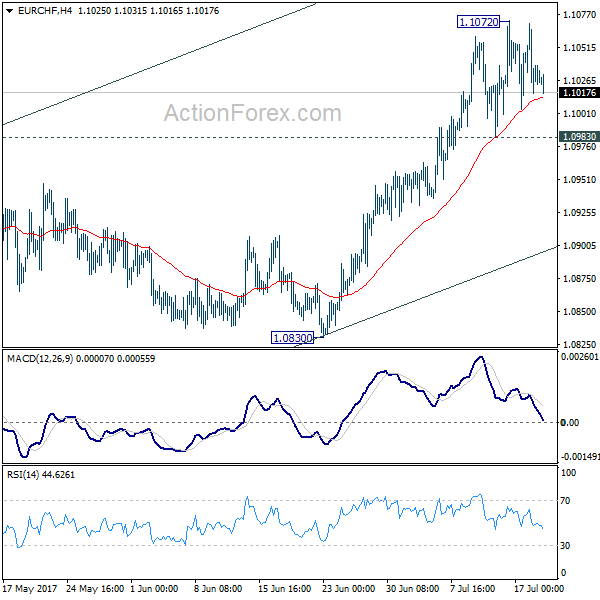
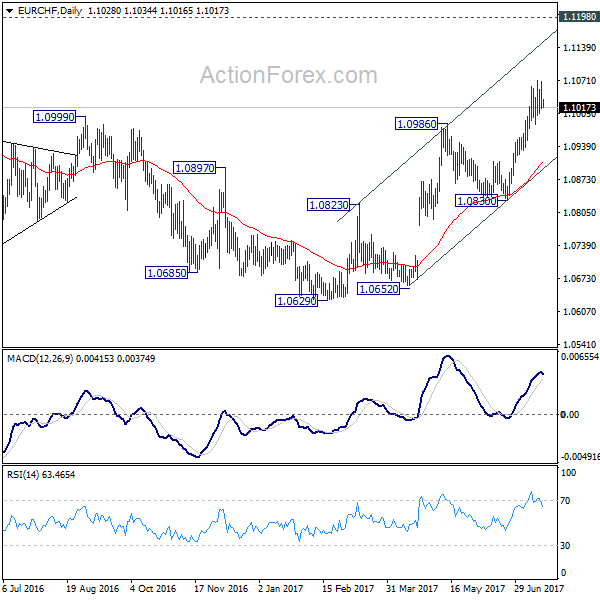
EUR/CHF Daily Outlook
Daily Pivots: (S1) 1.1010; (P) 1.1040; (R1) 1.1063; More...
EUR/CHF lost momentum after hitting 1.1072 and intraday bias is turned neutral first. As long as 1.0983 support holds, further rally is expected in the cross. Current rise from 1.0629 should target 1.1127/98 resistance zone. However, break of 1.0983 will indicate short term topping and turn bias back to the downside for 55 day EMA (now at 1.0906).
In the bigger picture, the price actions from 1.1198 are seen as a corrective move. Such correction could have completed after defending 38.2% retracement of 0.9771 to 1.1198 at 1.0653. Decisive break of 1.1198 will resume the long term rise from SNB spike low back in 2015. In such case, EUR/CHF could eventually head back to prior SNB imposed floor at 1.2000. However, rejection from 1.1198 will extend the multi-year range trading with another fall.
Is Silver About To Complete The Triangle?
Key Points:
- Silver continues to see supply/demand deficits in 2016.
- RSI Oscillator trending higher within neutral territory.
- Near completion of 5-drive suggests we could see a bullish wave.
Silver has been going through a cycle of declines of late as the precious metal has reacted to price action becoming trapped below a declining trend line and changing economics in the demand and production for Silver. However, presently there are some interesting technical indicators appearing on the daily chart which are likely to impact prices in the coming week.
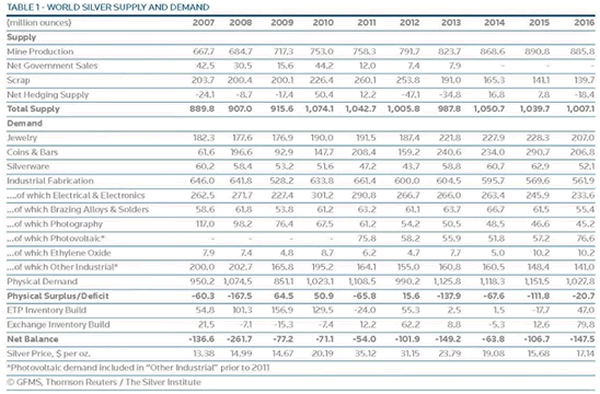
Fundamentally, economists have been squawking lately about the slipping demand for silver in the photographic trade. They are right to point out that in the space of a decade demand has fallen by over 65% as we have transitioned almost totally to digital cameras. However, to put that in context balancing supply and demand numbers still shows that there was a deficit of -20.7 million ounces in 2016 and that's with massively increased production. Subsequently, silver has experienced a supply deficit for every year since 2007, despite the fall in photographic demand.
Although the fundamental factors are long term in nature, the rising supply deficit largely agrees with what has been seen in the physical metals market with rising prices for actual silver coins and bars. Subsequently, it is no surprise that some bullish technical factors are now also starting to creep into the daily charts.
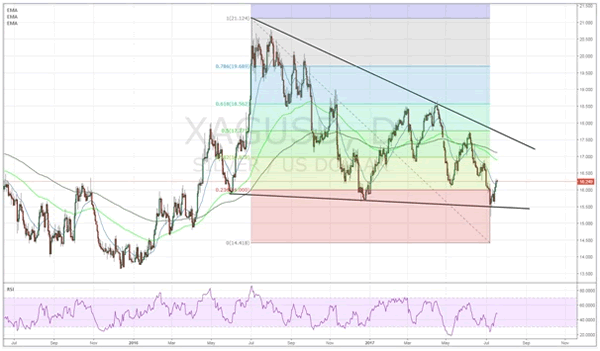
A cursory review of the various technical factors provides some illuminating hints at where the metal could be heading next. In particular, price action's recent rebound from support around the $15.50 mark seems to suggest that there is building momentum for an upside move in the coming weeks. In addition, a relatively clear 5-wave structure is in place and moving higher to completion, which is normally followed by another bullish cycle. Also, the recent spike in prices has seen the RSI Oscillator trend away from oversold territory, and into the neutral zone, suggesting that there could be some space to run on the upside.
However, to cement a concerted move higher, price action will need to rally through the top of the descending trend line. Taking an Elliot wave view of the recent movements, a break above this level would provide a sharp indication of price movement. At the time of writing, the upper constraint is sitting right on the $17.50/ounce mark and a break above this level is relatively conceivable in the coming weeks given a range of factors.
Ultimately, Silver is going to re-price in the coming weeks especially if it can break through the current descending trend line. A fairly likely scenario would be one where price action trends towards $17.50 in a wave pattern. However, as to how far the metal can push above that level will rely strongly on the medium sentiment, which as I'm sure everyone appreciates, is difficult to predict in the medium term.
Daily Technical Analysis: EUR/USD, GBP/USD Bearish Pullback To 1.15 And 1.30 Within Bullish Trend
Currency pair EUR/USD
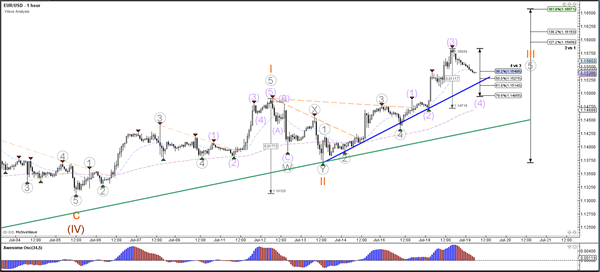
After the break above the 1.15 round level resistance, the EUR/USD continues the established bullish trend with yet another higher high. The uptrend shows no signs of weakening as yet and price is on its way towards the Fibonacci targets of wave 3 vs 1. Currently a retracement is taking place, which can be better seen on the 1 hour chart.
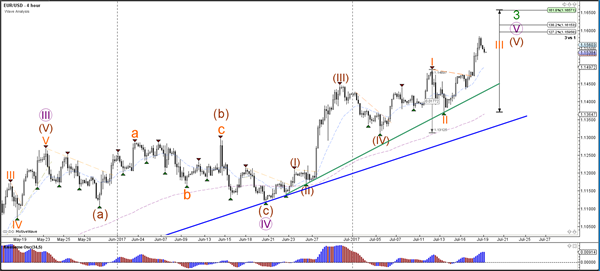
The EUR/USD has completed a wave 3 (purple) bullish momentum and price is most likely building a bearish correction within the uptrend. This retracement is indicated as a wave 4 (purple) and the Fibonacci levels of wave 4 vs 3 could act as support levels. A break below 1.15 makes a wave 4 unlikely.
Currency pair USD/JPY
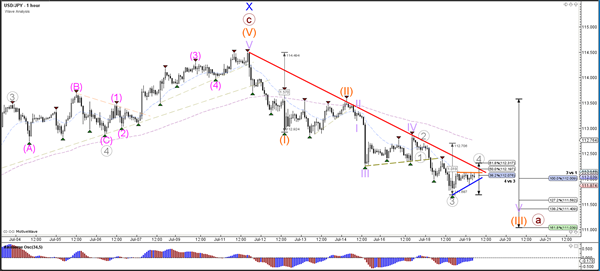
The USD/JPY bearish momentum continues with another lower low. Price could either be building an ABC zigzag or a 123 wave pattern (orange). For the moment the wave 3 has an edge but price will need to stay below resistance (red) and reach the 161.8% Fib target of wave 3 vs 1.
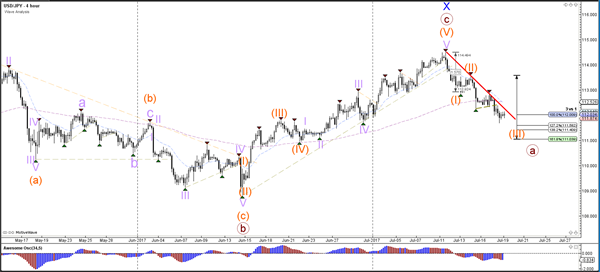
The USD/JPY could be building another wave 4 retracement (grey) within the downtrend. A break below support (blue) could indicate the continuation of the downtrend whereas a break above the resistance trend line (red) and 61.8% of wave 4 vs 3 invalidates the wave 4.
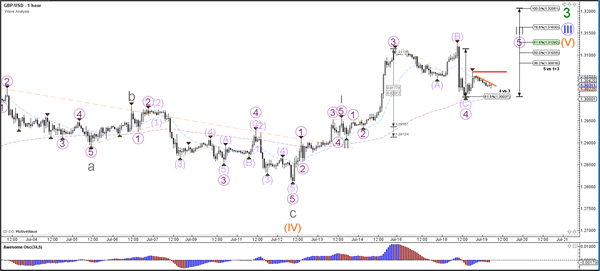
Currency pair GBP/USD
The GBP/USD broke above the 1.30 resistance but the weaker inflation level, which was announced yesterday, caused the GBP to retrace back from 1.31 to 1.30 The broken resistance could now become a potential support level within the larger uptrend.
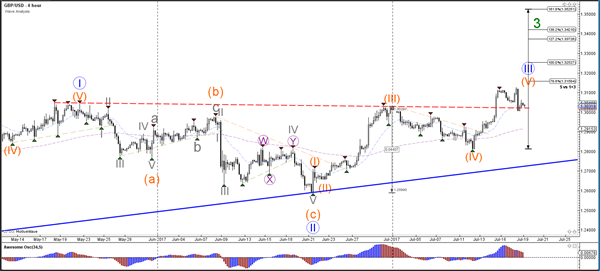
The GBP/USD seems to have completed an ABC (purple) correction within wave 4 (purple) and price has bounced at the 61.8% Fibonacci level. A break above resistance (red/orange) could start the uptrend continuation within wave 5 (purple).