Sample Category Title
Weekly Market Recap – USD Ruined by US Data
EUR/USD challenges long term resistance
We had volatility on the EUR/USD this week, has rallied on Tuesday and reached the 1.1466 major static resistance. Continues to stay below this major upside obstacle after the last day's sell-off. Today has rallied after the United States data were sent to the public, unfortunately the high impact figures have come in worse than expected. The greenback was punished by the poor data, the USDX plunged much below the 95.45 previous low and 95.18 low, could decrease further in the upcoming hours because is very heavy.
A further USDX's drop will send the EUR/USD much higher in the upcoming days, the perspective is bullish on the daily chart.
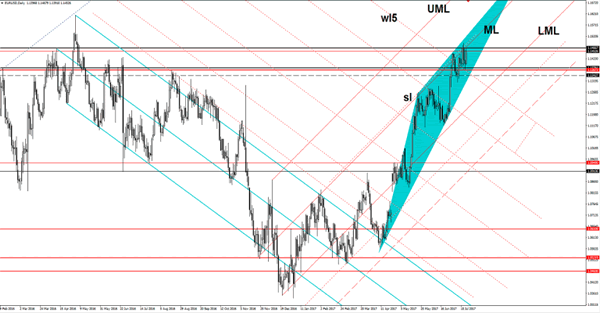
Price rallied today and is pressuring the 1.1466 level again, we have a very strong confluence between the median line (ml) with the mentioned static resistance. The false breakout above the median line (median line), the sliding line (sl) and above the 1.1466 level signalled and exhaustion, but the perspective remains bullish as long in trading above the 1.1376 static support.
GBP/USD crucial breakout in play
Price resumed the upside movement and has managed to jump much above the upper median line (UML) of the major descending pitchfork. Is trading above the 1.3047 previous high and above the 150% Fibonacci line (ascending dotted line) and looks determined to approach and reach the upside line of the up channel, where he could find temporary resistance.
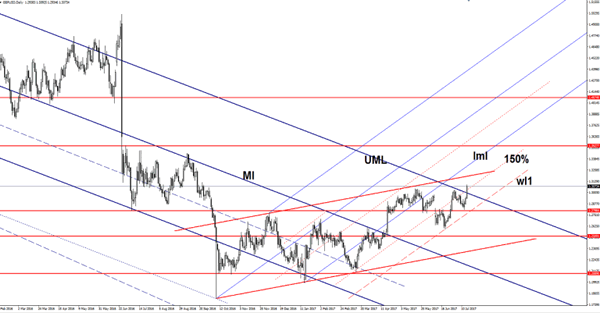
Was expected to increase after the failure to reach and retest the 1.2798 static support and the first warning line (wl1) of the ascending pitchfork. The breakout needs confirmation, we could have a buying opportunity if the rate will come back down to retest the upper median line (UML). Is premature to say that we have a valid breakout because we had other false breakout in the past.
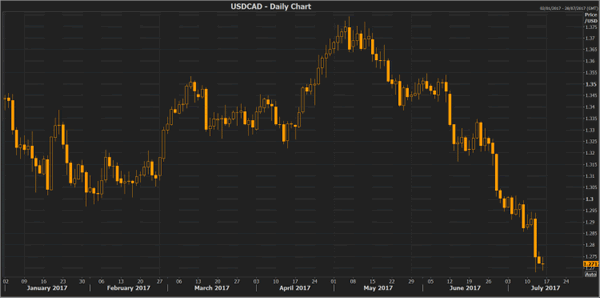
USD/CAD registered an unbelievable drop
The Loonie registered an amazing rally against its major rival (USD), the USD/CAD continues to drop after the poor US data and could reach fresh new lows because looks unstoppable. USD/CAD dropped more than 260 pips since Wednesday and ignored major support levels. Was driven lower by the fundamental factors, even if it was a little oversold at the start of this week.
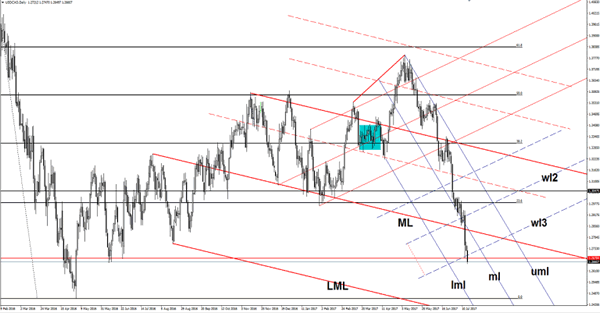
The rate plunged much below the median line (ML) of the major descending pitchfork, the third warning line (wl3) of the minor ascending pitchfork and below the 1.2678 static support, the next downside target will be at the lower median line (lml) of the minor descending pitchfork.
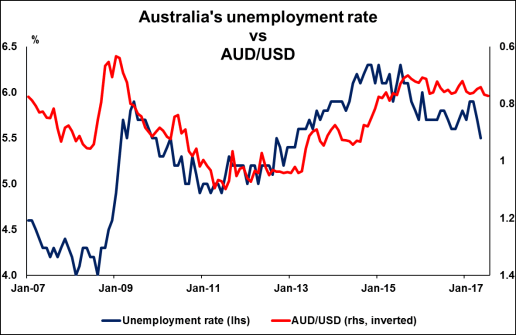
AUD/USD ignored major resistance levels
AUD/USD edged higher aggressively and ignored all resistance levels, now is very close to hit the major static resistance from 0.7835 swing high. Was almost to reach also the upper median line (uml) of the minor ascending pitchfork, where he could find resistance again.
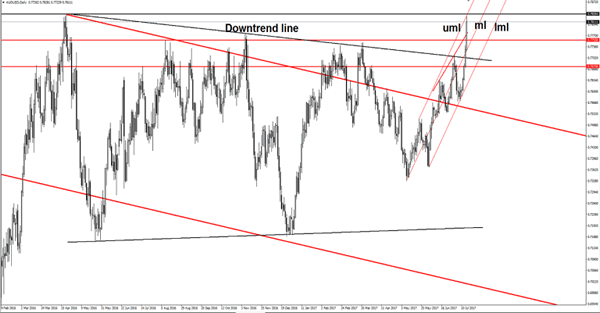
The pair has managed to breakout from the major extended symmetrical triangle and above the 0.7755 long term static resistance. We'll see how long this upside momentum will be and if the bulls will have more energy to push the rate much higher in the upcoming days.
BoC Acts as the Fed’s Dancing Mate – Will Others Join the Party?
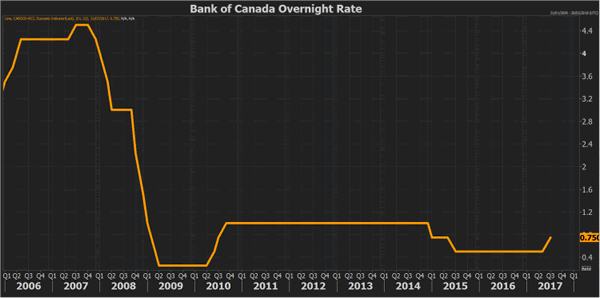
At the start of the year, the Federal Reserve was the only major central bank engaging in as well as communicating that it remains on a path of policy normalization. At that point in time, the Fed had already hiked rates twice since last reducing them back in 2008, while it has delivered two additional rate increases so far during the year. The Bank of Canada's decision to raise rates for the first time in roughly seven years could be a sign that a hiking trend is to follow amid signs for an improved outlook for the global economy.
After the decision by the BoC to raise its target for the overnight rate by 25 bps to reach 0.75% on July 12, the Canadian dollar rose versus its US counterpart to touch its highest in nearly thirteen months. Specifically, dollar/loonie fell to as low as 1.2680 (a fall reflects a strengthening loonie). The greenback later recovered part of its losses but still finished the day lower by a sizable 1.3%.
It is noteworthy that the Canadian dollar experienced significant gains in the weeks before the BoC decision. The rise in that period was in part attributed to the imminent rate increase by the Canadian central bank. In other words, the rate hike was already almost completely priced in by the markets before it officially materialized. It is thus interesting to examine what caused the loonie's surge on the day of the announcement - year-to-date, the loonie advanced 5.5% relative to the greenback.
In its accompanying statement, the Bank interpreted weak inflation data to be non-persistent, expressing that inflation is on track to reach its 2% target, as the Bank's Governor, Stephen Poloz, maintained an overall hawkish tone in his message. Moreover, the Bank expressed content for the country's economic recovery, while Poloz acknowledged the lag between monetary policy actions and future inflation (i.e. that it takes time for monetary policy decisions to have their intended effect on inflation). Therefore, it is clear that the loonie's jump higher was spurred by market participants expecting further hiking soon. The BoC is next scheduled to make a monetary policy decision announcement on September 6.
When asked about the credit-fueled boom prior to the 2007-09 financial meltdown, Chuck Prince, the then Citigroup chairman and chief executive, famously said that "as long as the music is playing, you've got to get up and dance". The BoC has just joined the dance in the party that was started by the Federal Reserve. This begs the question: Will other central banks soon join the party? According to financial market analysts, there is some reasoning for central bankers to follow through on the actions of their peers, especially if their currencies are moving in a direction that is detrimental for their respective economies.
It is also of interest that similar to Poloz, the European Central Bank head, Mario Draghi, recently played down not so strong inflation figures, attributing them to global factors. Back then, those comments by Draghi led to the euro rallying relative to other majors. Soon after, Bank of England officials, including Governor Mark Carney, followed suit with hawkish comments.
A Wall Street Journal report hitting the markets yesterday stated that the ECB is likely to signal in its September meeting that its asset purchase program will be gradually scaled down starting next year. In the case of the BoE, recent not-so-upbeat economic data, combined with political uncertainty (predominantly due to Brexit), might not allow its decision makers to enter a phase of normalization as soon as they would have otherwise wished. As of now, the Bank of Japan seems to be standing as the odd one out. Its Governor, Haruhiko Kuroda, delivered a broadly dovish message after the Bank's last meeting on June 16, saying that "there's some distance to achieving (the Bank's) 2% inflation" target. The BoJ maintaining its ultra-loose monetary policy at a time when others are either hiking rates or signaling readiness to normalize policy, is expected to add downside pressure on the Japanese currency over the short- to medium-term.
For history's sake, Chuck Prince's stance backfired, leaving Citigroup with a sizable exposure to the subprime mortgage market as the most damaging recession since the Great Depression of the late 1920s-early 1930s unfolded. It remains to be seen whether the world's central banks will face a similar faith; for the time being though such a scenario seems unlikely.
ECB & BoJ Policy Meetings, Key Economic Data in Focus
Next week's market movers
- In Eurozone, the ECB policy gathering will probably shed some light on whether the Bank is set to announce QE tapering soon, perhaps as early as September.
- In Japan, the BoJ is unlikely to take any action or make any notable changes to its bias with inflation still hovering near 0%.
- We also get key economic data from China, New Zealand, Australia, the UK, and Canada.
On Monday, during the Asian morning, we get China's GDP data for Q2. The forecast is for economic growth to have slowed slightly in yearly terms, something supported by the fact that both retail sales and industrial production slowed somewhat in April, and did not manage to recover in May. We also get the nation's industrial production, fixed asset investment and retail sales, all for June. Retail sales and fixed asset investment are both expected to have slowed slightly, further enhancing the case for a slowdown in GDP. Meanwhile, industrial production is forecast to have risen at the same pace as previously.
On Tuesday, the RBA releases the minutes from its latest policy gathering, where policymakers decided to leave interest rates unchanged. In the statement accompanying the decision, the Bank stated that indicators of the labor market remain mixed. Policymakers acknowledged that employment growth has been stronger over recent months, but they expressed concerns with regards to wage growth. They specifically noted that wage growth remains low, and that this is likely to continue for a while yet. As such, will look through the minutes for more details on how long the Bank expects this weakness to persist and how it can affect its future path of policy.
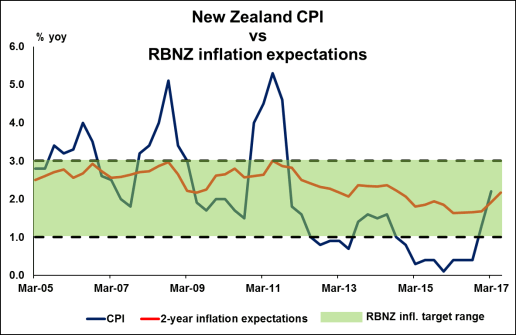
On Tuesday, during the Asian day, we get New Zealand's CPI data for Q2 and the forecast is for the nation's inflation rate to have declined to +1.9% yoy, from +2.2% yoy previously. The case for a slowdown is supported by the ANZ inflation gauge, which came in at +2.1% yoy in June. A decline in the nation's CPI rate could amplify our view that the RBNZ is likely to remain on hold in the foreseeable future, possibly throughout this year.
In the UK, the CPI prints for June will be in focus. The forecast is for the headline rate to have ticked down, but to still remain notably above 2%, while the core rate is expected to have remained unchanged. We see the risks surrounding the core forecast as skewed to the downside, considering that the nation's services PMI for June indicated that the rise in average prices was the slowest since July 2016. A potential pullback in these rates would probably ease some of the pressure on the BoE to raise rates in order to curb overshooting inflation.
On Wednesday, we have a relatively quiet day, with no major events or indicators due to be released.
On Thursday, during the Asian morning, the BoJ gathers to decide on monetary policy. At its latest meeting, the Bank kept its QQE with yield-curve control framework untouched, providing no signals regarding a QE-exit plan as had been suggested by some media reports back then. With inflation still hovering near 0%, we expect the Bank to provide little changes at this meeting, if any. Even if policymakers communicate a future exit from monetary stimulus, we think that they will do so without giving the impression that this is on the agenda any time soon. Our view is enhanced by the latest comments from BoJ Governor Kuroda, who noted that the Bank will maintain QQE with yield curve control for as long as needed to achieve 2% inflation in a stable manner.
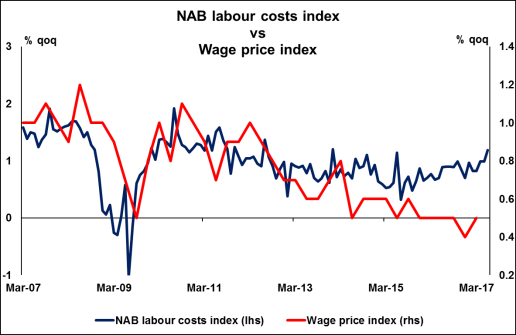
From Australia, we get employment data for June, though no forecast is available yet. Our own view is that the nation enjoyed another month of stellar employment gains. We base that on the ANZ jobs advertisements indicator, which showed that jobs ads accelerated notably in June. Nevertheless, given that the RBA already acknowledged the progress in employment growth, but remained concerned on the wages front, the indicators that will probably play the biggest role with regards to the Bank's future policy are the wage price index for Q2 and average weekly earnings for H1, released on the 16th and 17th of August respectively, after the RBA's next gathering. Even though the NAB business survey for June showed that wage growth accelerated in Q2, we don't expect any major changes in the Bank's language when it meets next. Officials may prefer to wait for concrete signs that wages are indeed picking up.
As for the rest of the day, the main event will be the ECB policy decision. Given that no change in policy is expected, market focus will probably be on whether the Bank will remove any more dovish aspects from its forward guidance and specifically, the bias that the QE program can be expanded in terms of size if needed. For background, we should note that the ECB has removed dovish aspects from its guidance at both the March and the June meetings, initially signaling that it is no longer willing to use all instruments within its mandate and then removing its interest rate easing bias.
We see two scenarios that can play out. In the hawkish one, the ECB indeed removes its easing bias regarding an expansion of the QE programme. With this move, policymakers would likely set the stage for a potential announcement in September that QE-tapering may begin early next year. Now on the other hand, policymakers could decide to be patient, and wait for the September meeting in order to remove the QE-expansion bias. This scenario could come as a disappointment to EUR-bulls and possibly lead to notable correction in EUR.
On balance, we believe that the former case is more likely. The minutes of the ECB's June meeting showed that there was a discussion regarding the removal of the QE expansion bias. Policymakers noted that even though any changes (expanding QE) had become less likely, leaving this part of the forward guidance in place was considered preferable on the whole, at that time. The fact that a debate already took place raises the odds that the Bank implements such a change in the near-term, in our view. Also, the language in which the discussion is described suggests that leaving the QE bias in place was not a clear-cut decision, but was instead a relatively close call.
What's more, it was announced recently that ECB President Draghi will deliver remarks at the Fed's Jackson Hole symposium in late August. The last time he spoke at Jackson Hole was in 2014, in what was later seen as an initial signal that the Bank planned to introduce QE. His return to the conference three years later has raised speculation that he might send the opposite signals this time and hint at tapering, preparing the ground for a formal announcement a couple of weeks later at the September gathering.
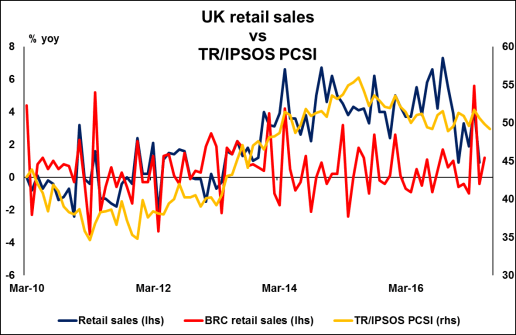
Turning to the economic data, UK retail sales for June are due out and expectations are for a rebound following a sharp decline in May. The case for a rebound is support by the BRC retail sales monitor, a gauge of the official print, which rebounded notably in June, reentering the positive territory. Even though the TR/IPSOS and the Gfk consumer sentiment indices declined somewhat during the month, we think that the BRC print may be a better tracker of the UK sales during the month.
On Friday, we get Canada's CPI data for June. In the absence of any forecast, we see the case for the nation's headline and core inflation rates to have remained unchanged, with risks tilted to the downside. The Markit manufacturing PMI for the same month indicated that factory gate price inflation slowed to its least marked since February. Even if inflation slows further though, we doubt that it will deter the BoC from hiking rates again this year. In the latest Monetary Policy Report, which was released when the Bank raised rates, the Bank anticipated inflation to slow somewhat further in Q3, before picking up again. At this stage, we think that it would take a truly dreadful inflation report to stop the BoC from hiking again in the near-term.
Yen Weakens As Central Banks Hint Of Further Tightening
- Eyes On Inflation in Sweden - Peter Rosenstreich
- ECB rate decision up next - Peter Rosenstreich
- Yen Weakens As Central Banks Hint Of Further Tightening - Yann Quelenn
- Bitcoin: Trade The Fork - Yann Quelenn
- Virtual Reality
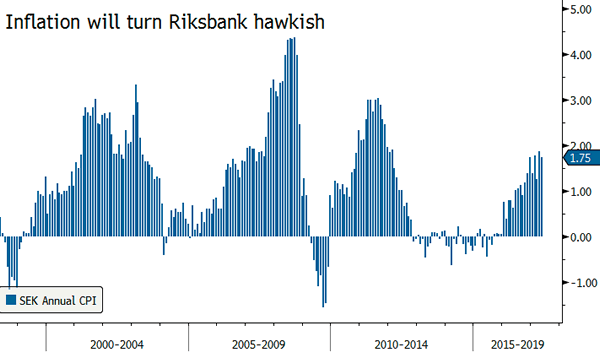
Economics - Eyes On Inflation In Sweden
With the shift of global central banks towards "normalizations" the debate over inflation creation has been renewed. Yet the debate looks to have ended for policymakers. Central banks are no longer waiting for wage growth to convincingly turn into domestic inflation before tightening monetary policy. For those traders looking to build a mid-term trading approach using fundamentals a core focus on price data is critical. Judging from the market's reaction to the US strong labor data (muted) verse inflation (significant), we clearly see that adjustments in inflation data and expectations will trigger an asymmetrical market reaction. Sourcing outperformers in the G10 we need to isolate those nations that will struggle with rising prices.
Recently, the Riksbank ended its easing bias taking a baby, but real, step toward normalization by removing possibility of additional repo rate cuts in projections. The banks held on to its cautious stance and provided no indication that a shift towards hawkishness was coming soon. Yet since then the diminishing growth risks, higher inflation reads and modification of tone globally suggests a change is coming. Sweden June CPI inflation quickened more than markets and central banks forecast expected by printing at 1.7% y/y. On the release, front-end yields further steepening reinforcing the view of 10bp in hikes over the next 8 months.
Yet persistent inflation over the next few months, which is likely, increases the risk of an earlier move. Sweden sensitivity external demand makes Riksbank nervous. Considering the broad trade data improvement the risk are high that price pressures continue to build in Sweden. Steady improvement in domestic data indicates that inflation will remain elevated and accelerated expectations of tightening. We remain bullish on SEK especially against low yielding currencies such as CHF and JPY.
Economics - ECB Rate Decision Up Next
Summer trading is clearly on us. Despite the best-effort hype of corporate earnings and constant political uncertainty emulating from the US, volatility and liquidity continues to dry up. The expectations for global central bank shift towards normalizations that sent shockwaves through financial markets, pushing yields up 25bp across the curve, has faded. While central bank after central bank in the G10 seem to have suddenly reverse bias investors were left with a lot of rhetoric and not much evidential support. Yellen toed the line but perhaps provided slightly less hawkish commentary in front of congress. While the BoC seem to have backed shift with a 25bp hike, external economic headwinds (specifically soft oil prices) and reality of modern inflation dynamics makes aggressive tightening less likely.
But the main event will be ECBs 20th July rate decision and press conference markets. Draghi recently smashed conventional wisdom with his hawkish shift sending EUR on a bullish tear. The change in ECB tone was response to solid growth (both domestic and international) rather than reassessments of inflationary risk. Draghi will have a challenging time to dial back his hawkish shift while at the same time prepare the markets for tapering on 26th October (hawkish action while not seemingly sounding hawkish). We anticipate the ECB will remove emergence measure sooner then expected. And by September have the ground work for a reduction in asset purchases. We expect the ECB QE program to be finalized around mid-2018 (depending on market reaction and economic data) and rate increase by the end of 2018.
Economics - Yen Weakens As Central Banks Hint Of Further Tightening
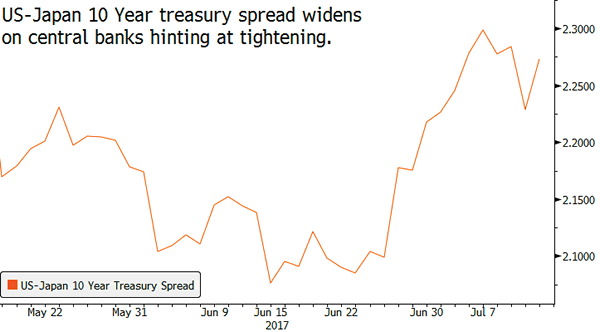
As the US Federal Reserve signals the end of zero-interest-rates, and the interest rate spread between 10-year government bonds from the US and Japan widens, the JPY just keeps on falling. The USD is now at around 113 JPY, the yen's weakest since mid-May, compared to levels of around 100 JPY in September of 2016. JPY's movements against the EUR have been similar.
This is good news for the Bank of Japan, which for years has been battling deflation, and is likely to capitalise on a softening yen to help reignite inflation. But at this step, this is only hope as no action from the BoJ has sparked an increase in consumer prices. For the time being, the Japanese inflation only lies at 0.4% y/y far from the central bank's target of 2%.
Also dragging the yen down is a slowing in the Japanese economy. This weeks' data marked the publication of Japan's machinery orders for May 2017. They were down 3.6% from April, which in turn had fallen 3.1% from March levels. May industrial production also came in lower at -3.6% after a decline of -3.3%.
We consider that the yen's decline is mostly driven be monetary tightening from other central banks: first the US Federal Reserve, then the ECB, with similar moves expected from the Bank of England, Bank of Canada, Norway's Norges Bank and Sweden Riksbank.
Meanwhile, nothing has changed in BoJ's monetary policy. The Japanese institution is still set to purchase an unlimited amount of bonds at a defined yield. The Bank of Japan looks likely be the only major central bank that will not to raise its interest rates this year. This is one great reason why investors are staying away from the JPY.
However the relative geopolitical calm should not make investors forget that the yen is constantly under pressure and that upside risk may arise very quickly due to the political stability of the country.
Digital Currencies - Bitcoin: Trade The Fork
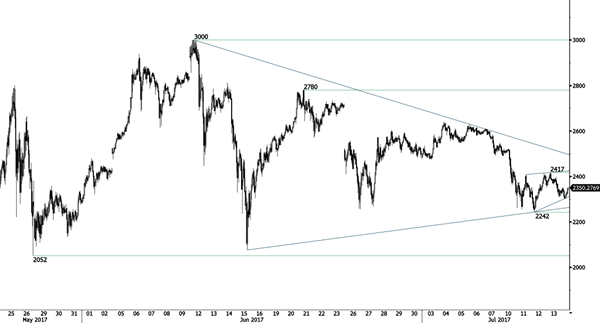
The most infamous digital currency has exploded this year reaching $3000 before bouncing back lower. Since then, downside pressures are increasing and the cryptocurrency market has entered a bear market. Yet, there is a very important date which accounts for the sudden selling. On 1st of August there may be the most important event for this elderstatesmen's of cryptocurrency.
Indeed, the future of Bitcoin as we know it may change. First let's understand the issue. For the time being Bitcoin blockchain is unable to process massive number of transaction (around 7 per seconds) and the only way to increase speeds of transaction is to increase the size of the blockchain (size of the decentralized database) by modifying the code.
There are two changes likely to happen: A soft or a hard fork. A fork is simply a change in the blockchain structure. A soft fork ensure that new blocks are valid in older version while the hard fork renders impossible to use old blocks but requires larger acceptance (by miners, wallets, merchants).
What makes markets nervous is that both soft and hard fork needs large acceptance (WAY larger for the hard fork) and both may lead to a split like what happened with Ethereum now split in Ethereum (ETH) and Ethereum Classic (ETC).
At this stage, markets believe the soft fork will win and we also consider the Bitcoin split unlikely at this stage. This is why we remain bullish on Bitcoin and we target $2500 for one bitcoin in the short-run as a relief rally.
Technical Analysis
- Bitcoin is located in a medium-term bearish trend while very short-term momentum is slightly bullish. Hourly resistance can be found at 2417(13/07/2017 high) and hourly support is given at 2242 (12/07/2017 low).
- In the long-term, the digital currency has had an exponential growth. There are decent likelihood that the asset will consolidate above $1500. Long-term support is given at $1464 (04/05/2017 low).
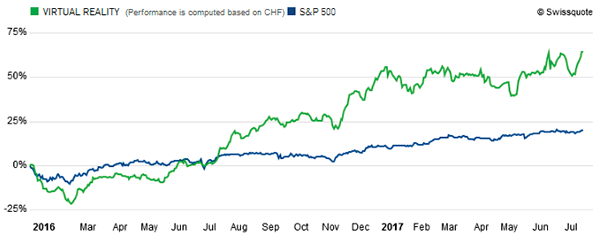
Themes Trading - Virtual Reality
Is this a simple gadget, a new tech bubble or a revolution? It's hard to say at the moment, but one has to admit that the concept is fascinating. Virtual reality takes users to simulated worlds. It might sound like a new generation of video game consoles at best, but we believe it's going to be much more than that. For example, visiting a potential new home or looking for a doctor's advice from the comfort of your home could become a new normality. Features could go well beyond mere play or entertainment: in fact, we believe this technology could represent the same kind of step change as the introduction of smartphones and PCs - a whole new way to seek out information and interact.
According to a recent survey by statista.com, the user base is also set to explode, rising to 171 million users from 43 million this year. Forbes is also saying that revenues could reach CHF 21.2 billion in 2018, compared with around CHF 150 million this year. Suffice to say that potential growth may be immense.
For this theme, we have chosen companies that are either mainly focused on virtual reality or have adopted a strategic stance towards this new technology. For example, AMD and NVIDIA have designed a full range of graphics cards ready for virtual reality, while Qualcomm is developing virtual reality applications. The selected companies are also investing significant amounts, demonstrating that things are moving apace. Facebook bought Oculus for $2 million in 2014, while Qualcomm and AMD invested $30 million in Matterport for virtual reality real estate tours. There will not be any half-and-half results: either the market will explode or it won't!
Australia & New Zealand Weekly
Week beginning 17 July 2017
- Views on RBA and AUD.
- RBA: meeting minutes, speeches from Heath, Debelle and Bullock.
- Australia: employment, Westpac-MI Leading Index.
- NZ: CPI.
- Japan: BoJ policy decision.
- China: GDP.
- Euro Area: ECB policy decision.
- US: housing starts, building permits.
- Key economic & financial forecasts.
Views on RBA and AUD
Despite some market speculation, the Governor issued a Statement, following the July 4 Board meeting, which did not contain any hint of a tightening bias. Despite that action, markets have again moved to price in a rate hike of 25 basis points by August next year.
This action by the market seems to be in response to firming expectations of policy tightening in overseas markets complemented by the recent buoyant Employment Reports. We have not changed our view that rates will remain on hold throughout the remainder of 2017 and 2018.
That view is predicated around a number of key forecasts. Firstly, we expect that growth in Australia will slow materially through 2018. Our current forecast of 2.5% growth is in contrast with the Reserve Bank's current forecast of 3.25% growth in 2018 - an expected lift in the growth momentum from 2017. That 3.25% is around 0.5% above the assessed trend growth rate and is, arguably, consistent with the market's expectation of a rate hike in 2018. Of course that does not mean that the RBA is committed to a rate hike in 2018. The Bank regularly emphasises the uncertainties around growth forecasts. It has the flexibility to assess the incoming data to determine whether it is consistent with its current growth expectations.
There are a number of reasons behind our cautious approach to growth next year. Firstly, it seems clear from the dwelling approval data that the housing construction cycle has peaked. We expect that, through 2018, housing construction will be a negative influence on growth subtracting around 0.25% from growth compared to a contribution of 0.3% in 2016.
As we saw in the July Consumer Sentiment Report, the consumer remains downbeat. Tepid wages growth is the key behind this cautious mood of the consumer. As we are seeing in other countries such as US; UK; Germany; Japan and New Zealand, even full employment has not been able to boost wages growth in these countries. With ample spare capacity set to remain in the Australian labour market, our prospects for the recovery in wages growth that has been projected in official circles seem remote. Consequently we expect a below trend contribution to growth in 2018 from consumer spending.
Dwelling construction and consumer spending are key drivers of jobs growth. With both those factors underwhelming, we expect spare capacity in the labour market to persist with the unemployment rate edging back to 6% in 2018. Ongoing soft wages growth coupled with further pressures on retail margins are likely to maintain a frustrating undershoot for inflation with the risk that the Bank's preferred inflation measures remain below the 2% threshold.
Businesses have been cautious investors through this whole cycle. A downturn in domestic sales growth as consumers and housing activity slow is hardly likely to reboot business investment in 2018.
Finally, the RBA is likely to feel a lot more comfortable about asset markets through 2018. We expect house price inflation to largely disappear over the course of the next year or so - just as we experienced in 2015/2016. That adjustment in 2015/16 was engineered by rising interest rates, which were initiated by the banks in response to tighter official lending guidelines and increased capital requirement. The banks also tightened lending policies.
In that 2015/2016 period the banks raised mortgage rates by an average of 27 basis points. So far in this cycle rates are up by an average of 28 basis points although the mix is different. More pressure has been put on to interest only loans (nearly 40% of banks' mortgage books) with no increases on owner occupied principal and interest loans (compared to 17 basis points in 2015). As in 2015 banks are also implementing tighter lending policies. It appears that regulators are determined to slow lending particularly for investors (investor interest only loan rates are up by 76 basis points in the recent months) while commercial property loans are likely to receive attention.
From an interest rate perspective these conditions we envisage for 2018 would, under other circumstances, look conducive to even lower rates. Indeed I would have to say that if rates do move next year it is more likely to be down than up. However, the experience of the rate cuts in May and August 2016 will not be forgotten by Governor Lowe. As discussed we saw house price inflation come under control by mid-2016 under the weight of the macro prudential tightening. That effect largely dissipated in the wake of those rate cuts. House price inflation returned quickly through the second half of 2016 while the objective of those cuts - to restore underlying inflation to the 2 - 3% band - was not achieved. That experience, under Lowe's predecessor will be vividly recalled.
One development which we expect over the course of 2018 which support growth prospects for 2019 is a sharp fall in the Australian dollar.
We expect the AUD to fall back to USD 0.65 by end 2018.
We are not particularly surprised that AUD is currently around USD 0.77.
Recognition of a significantly weaker profile for the AUD is not expected to gather momentum until the first half of 2018.
Factors that we consider will change sentiment in the AUD from current market positioning are the following:
- US interest rates are expected to rise much more quickly than current market expectations. We envisage a US rate hike by September or certainly December with two more hikes in 2018. Market pricing currently anticipates only a 50% probability of a hike by year's end and only one further hike in 2018. While Chair Yellen noted that rates were nearing her assessment of neutral she also emphasised that she expected the neutral rate to rise over the course of the next two years or so. Overall, we expect a further 0.75% increase in the Federal funds rate over the next two years compared to market expectations of around 0.40%.
- There has also been an "overshoot" in negativity around the US and the USD in the face of disappointment in Trump's progress toward heath care; tax; infrastructure; and regulatory reform. Despite three rate hikes in December; March; and June the USD Index (DXY) has actually fallen by 2% since prior to the US election in November. DXY is actually down 7% since its peak in December last year as markets have lost confidence in prospects for reform in the US. Markets now seem vulnerable to some upside surprises.
- While there is no way of assessing markets' direct expectations for growth in Australia the fact that a 0.25% rate hike is now factored in by August next year implies that markets are expecting a much stronger growth environment in Australia than our view (see above). We continue to expect rates to remain on hold through 2018.
- Consequently our expectation for the short term yield differential between Australia and the US by end 2018 is minus 0.40% compared to market expectations of plus 0.20%. We consider that, based on historical evidence, Australian rates falling below US rates will have an exponential impact on confidence in the AUD.
- Consider the only previous examples of AUD short rates falling below US rates. Over the year from July 1997 when the AUD cash rate fell 0.5% below the Federal funds rate the AUD tumbled from USD 0.75 to USD 0.57. In August 1999 when AUD also fell back to 0.5% below US rates the AUD fell from USD 0.67 to USD 0.58.
- To be sure, the AUD will remain at higher levels in the next expected episode of negative interest rate differentials due to a much more supportive level for commodity prices. However we do envisage a considerable fall in the key commodity prices through 2018. Through 2018 we expect a 26% fall in the bulk commodity Index, including a 30% fall in the iron ore price. That adjustment will be underpinned by a marked slowdown in Chinese industrial demand, as the government resumes its rebalancing policies. We also expect a lift in Australian and Brazilian production of iron ore. Because these producers have much lower cost curves than other marginal producers who prosper when demand is booming prices can fall back towards the cost curves of the highly efficient Australian and Brazilian producers. Industry reports estimate current cost curves of around USD 20 per ton in both Australia and Brazil. Our end target level of USD 40 per tonne will still be an attractive proposition for these low cost producers.
In summary our expectation that US rates and policy will surprise to the upside while Australian growth and rates will surprise to the downside coupled with a slowdown in China and weaker commodity prices still supports our outlook for the Australian dollar in 2018.
Data wrap
May housing finance approvals
- The May housing finance data was largely in line with expectations. The number of owner occupier loans rose 1% vs market expectations of 1.5% (Westpac +1%). The value of investor loans declined 1.4% but were still up 8.8%yr.
- Note that the this is the second monthly observation since APRA's macro prudential tightening announced in late March and associated increases in increase rates with larger rises for investor and 'interest only' loans.
- Some of the rise in owner occupier loans in May is likely due to switching between investor and owner occupier loan products. A lift in refinancing suggests we may also be seeing existing borrowers move from interest only to standard loans. Total new owner occupier loans ex refi were down 0.1% in the month.
- Due to these compositional effects, our main focus is on the value of investor loans and total value of loans. These both look to have held up a bit better than expected in May with a mild 1.4% dip in the value of investor loan approvals and total ex refi flat at +0.1%.
- The detail around owner-occupier approvals showed another strong rise for construction finance approvals (+2.4%mth, 6.2%yr) with annual growth running at the strongest pace since 2014. That in turn suggests non high rise dwelling construction may be lifting a touch. Finance for purchase of newly built dwellings - which includes for settlement of 'off the plan' purchases, rose 3.7% to be up 8.6%yr.
- The total number of owner occupier approvals (ex refi) by state showed small gains in NSW and Vic more than offset small declines across the other major states.
- Overall, the May approvals update tells us little about the extent of the slowdown following the macro-prudential tightening. Other, timelier indicators such as auction activity and price growth show a material slowdown coming through although both remain fairly mild to date (for price growth in particular). Even this largely pre-dates the impact of a second round of mortgage interest rate increase in June. It also predates increased assistance for first home buyers introduced by state governments in NSW, Vic and Qld from July. While finance approvals will provide more guidance in coming months the full picture of how these factors are resolving is unlikely to emerge until much later in the year.
Jun NAB busines survey
- The NAB business survey reported that business conditions strengthened in June, led higher by the construction and manufacturing sectors, while confidence edge higher.
- The survey was conducted from June 26 to 30.
- In June, the conditions index rose 4pts to 15, more than reversing the 3pt decline spread over the previous two months. This is well above the long-run average for this series, of +1 (dating from 1989), but below the highs of 2007 ahead of the GFC.
- The components of business conditions for June were: trading conditions up 6pts to +21; profitability up 5pts to +15; and employment conditions held onto earlier gains, steady at +7.
- Business confidence moved higher, edging up 1pt to +9. Confidence has improved since 2016 and is at above average levels, although it continues to trail conditions.
- How to interpret the survey? The elevated level of the business conditions index is overstating actual conditions across the broader economy, as it has tended to do since the GFC (see chart overleaf).
- Directionally, the survey suggests that the Australian economy is experiencing a trend improvement in underlying conditions after the slowdown in mid-2016, which was associated with the July Federal election.
- The official data was mixed early in 2017, impacted by weather disruptions. More recently, partial indicators have improved (retail sales, exports, jobs), lending support to our view that the economy will rebound in 2017 from these temporary disruptions, although be constrained by lacklustre consumer spending at a time of weak wages growth.
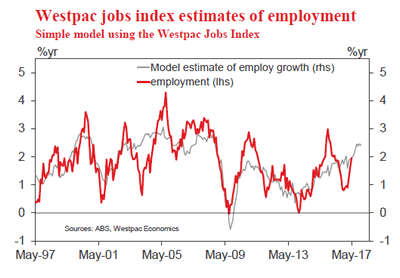
- On employment growth, the previously weak official data has fallen into line with the positive signal from the private business surveys, meeting our expectations. This highlights the value of the private business surveys.
- The ABS reports that a hiring burst over the three months March to May has lifted annual employment growth to 2.0%, up from 0.9% in December. This brings actual employment growth into line with the NAB employment conditions index (see chart opposite). The survey suggests that the recent trend improvement in employment will be sustained in coming months.
- By industry, a trend improvement in business conditions is evident in mining (supported by higher commodity prices); construction (as the mining investment drag reduces and with a boost from public works and commercial building); manufacturing (benefitting from construction, mining, agriculture and the lower AUD); as well as wholesale and transport & utilities. Conditions in finance, business & property have cooled, as lending conditions for housing have tightened. As to the consumer sectors, recreational & personal has moderated, while the previously very weak retail sectors has recovered somewhat.
- By state, business conditions for June are positive in all six states. Trend conditions are most favourable in the major nonmining state of NSW and Victoria. The improvement in overall conditions between 2016H2 and 2017H1 is largely driven by the mining states of WA and Qld, as well as SA.
Jul Westpac-MI Consumer Sentiment
- The Westpac Melbourne Institute Index of Consumer Sentiment rose by 0.4% in July from 96.2 in June to 96.6 in July.
- This is the eighth consecutive month where the Index has printed below 100 indicating that pessimists continue to outnumber optimists. The Index is not sending encouraging signals about the outlook for consumer spending.
- Having said that, developments around interest rates during the month could have been much more damaging for confidence than turned out to be the case. Banks increased rates on 'interest only' mortgages while there was considerable media speculation about prospects for rising rates overall.
- In the event confidence amongst respondents with mortgages actually rose by 4.8%. However, the interest rate increases may have contributed to softer reads in some sub-groups with higher exposure to investor housing - sentiment down about 10% in the month for those aged over 55.
- The key components of the Index gauging respondents' assessments of their own financial position were mixed. The component measuring assessments for family finances relative to a year ago lifted slightly by 1.2% while the component tracking assessments of the outlook for finances over the next 12 months fell by 4.2%.
- Overall however both of these components are down significantly over the year by around 4%. While-ever respondents remain concerned about their own finances prospects for a marked lift in spending patterns will remain remote.
- On the other hand there was an improvement in how respondents assess conditions in the labour market. The Westpac Melbourne Institute Index of Unemployment Expectations fell by 3.1% (a lower number indicates that fewer consumers expect unemployment to rise) but really only recouped the increase we saw in the last month. Over the last year this Index has remained fairly steady despite the encouraging developments in the stunning employment reports which indicate that 141,000 jobs were added in the three months to May.
- Other components of the Index were also mixed. The 'economic conditions over the next 12 months' sub-index increased by 1.8% while the 'economic conditions over the next five years' sub-index fell by 1.5%. Over the last year, 12 month prospects have increased by a modest 1.1% while 5 year prospects have fallen by 8%.
- The 'time to buy a major household item' sub-index improved by 4.2% to be up 1.0% over the year.
- Conditions in the housing market appear to be stabilising, at least for the time being. The 'time to buy a dwelling' index lifted by 3.1% in the month - the first significant increase we have seen for this year. Recall that in the first half of 2017 this indicator fell consistently by just over 10%. Recent increases in state government assistance for first home buyers appears to have been a big factor in the July rise with the 'time to buy a dwelling' sub-index for 25 - 34 year olds surging 36% in the month.
- The outlook for house prices also partially reversed the recent deterioration. The Westpac Melbourne Institute Index of House Price Expectations increased by 8.6% following the cumulative 11.8% fall we saw in the previous two months. With banks raising some mortgage rates and overall confidence soft it is too early to call a recovery in confidence in the housing market.
New Zealand: week ahead & data wrap
The RBNZ continues to face a number of challenges ...
Over the past week, we have seen updates on several key aspects of the economic outlook. Putting these together, we're continuing to see an environment where inflation pressures remain very well contained.
... with inflation set to soften in the near term ...
First up, inflation is looking like it will come in on the softer side of the RBNZ's expectations. We expect a subdued 0.1% rise in the CPI for the June quarter, which would see annual inflation recede from 2.2% to 1.8%. New Zealand's inflation figures are often thrown around by temporary factors, and so far this year has been no different. There was an unusually large 1% rise in prices over the March quarter, led by gains in food and fuel prices. Those two items will also play an important role in the June quarter figures, though this time their net impact on the inflation rate will be negative.
Our forecast is lower than the 0.3% quarterly increase that the Reserve Bank forecast in its May Monetary Policy Statement. However, a downside surprise on inflation is unlikely to be too much of a concern for the Reserve Bank, which had already concluded that the recent pickup was temporary and that inflation would be well below 2% again by next year.
Taking out food and fuel prices gives us a clearer picture of where inflation is heading. On this metric, inflation bottomed out some time in 2015 and has risen gradually since then, though it remains below the 2% midpoint of the Reserve Bank's target band. This is consistent with our view that while the economy is growing at a solid pace, it's not at risk of overheating.
... housing market conditions weakening ...
Next up, we are seeing increasing signs of softness coming through in the housing market. The past year has seen, house price inflation slow sharply and a large decline in house sales. These developments have come on the back of a tightening in lending conditions and the creep higher in mortgage rates. Initially the impact of these changes had been concentrated heavily in Auckland. However, the latest REINZ housing market report indicates that other regions are now slowing materially. Notably, sales throughout the country have fallen sharply through mid- 2017, and by much more than the usual winter lull. In addition, Auckland prices have continued to fall and are now down 4% since January, while much of the earlier resilience in house prices in other regions has also faded.
The slowdown in the housing market has important implications for the New Zealand economy, with housing market conditions being a key driver of household spending. Indeed, already through the earlier part of this year, the spending on durables have been relatively flat. With mortgage rates to continue to push higher, and house prices to continue easing, this signals an important headwind for economic activity over the year ahead.
... and the NZD grinding upwards.
Lastly, the New Zealand dollar has continued to push higher against the greenback, and on a trade-weighted basis, is around 3% higher than what the RBNZ was expecting. As well as adding to the challenges for exporters, lingering strength in the NZD/USD will continue to dampen imported inflation. Indeed, the strong rise in the New Zealand dollar over 2016 has still not yet fully been reflected in the prices of imported goods such as clothing, cars, electronics and home furnishings.
OCR to remain on hold for some time.
Putting this all together, it is looking very unlikely that inflation will threaten the upper-limit of the RBNZ's target band anytime soon. This reinforces our expectation that the RBNZ will keep the Official Cash Rate on hold through 2017 and 2018. This presents a challenge to financial markets, which in our view are too eager to assume that the RBNZ will soon join the club of central banks that are contemplating interest rate hikes. Markets are pricing in an OCR hike by June next year.
Data previews
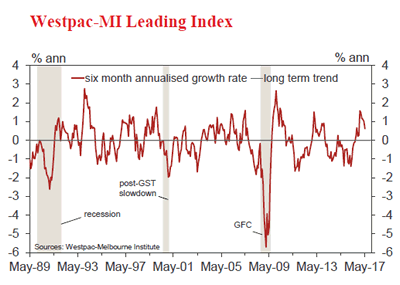
Aus Jun Westpac - MI Leading Index
Jul 19, Last: 0.62%
- The six month annualised growth rate in the Leading Index, a guide to the pace of economic activity three to nine months into the future, eased from 1.01% in April to 0.62% in May. The index is pointing to a clear slowing in momentum but remains comfortably above trend. The easing mainly reflects a less supportive backdrop for commodity prices and in global financial markets.
- The June read looks likely to be another weak one with more soft updates on a range of components including: the Westpac-MI Consumer Expectations Index ( - 1.4% vs - 3.2% last month); and commodity prices ( - 5.3% vs - 4.8%); dwelling approvals ( - 5.6% vs +4.8%). The yield spread has also narrowed ( - 12.5bps vs a 1.8bps widening last month). More imporantly the the six month rate is now cycling past the big lift in commodity prices in late 2016.
Aus June Labour Force employment '000
Jul 20, Last: 42.0k, WBC f/c: 20k
Mkt f/c: 15k, Range: -12k to 30k
- In May total employment rose 42.0k compared to a market's forecast for 10k.
- The Australian labour market went through a soft patch in 2016, particularly from August to November, but as we moved through 2017 there has been a distinct uplift in employment. In the last three months the annual pace lifted from 0.9%yr in Feb to 2.0%yr in May. Compare this to the 106k gain, or 0.9%yr, in the year to Feb. In May the 42k gain in employment resulted in a 141.1k gain over the last three months or an average of 47k per month.
- Westpac's Jobs Index currently suggests employment growth should be around 2.0%yr before accelerating to 2½%yr by November. Our forecast for a 20k gain in June holds the annual rate at 2.0%yr.
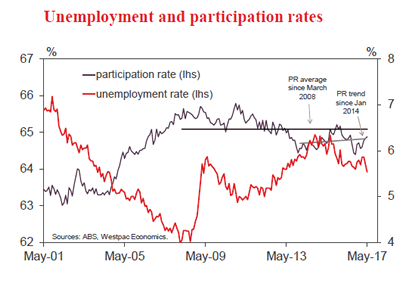
Aus May Labour Force - unemployment %
Jul 20, Last: 5.5% WBC f/c: 5.6%
Mkt f/c: 5.6%, Range: 5.5% to 5.7%
- The solid May gain in total employment was associated with a 0.1ppt lift in participation, to 64.9, driving a 23.4k gain in the labour force. This rise in the labour force limited the fall in the unemployment rate to 5.5% from 5.6% - at two decimal places the unemployment rate was 5.53%. We had been looking for the unemployment rate to fall over the next few months but we had not expected it to get to 5.5% so soon.
- The rise in participation in the month was all with females. Male participation was flat at 70.5 while female participation lifted to 59.4 from 59.3. And more surprising was that just about all of the gain in participation can be attributed to the rise in female participation in NSW, from 57.3 to 58.1.
- Holding participation flat in May lifts the labour force by 25k seeing the unemployment rate rounding up to 5.6%.
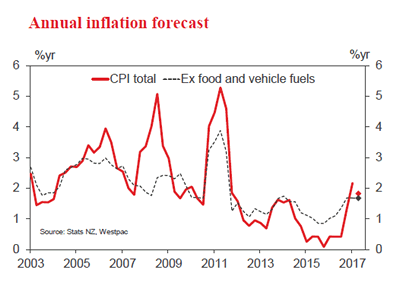
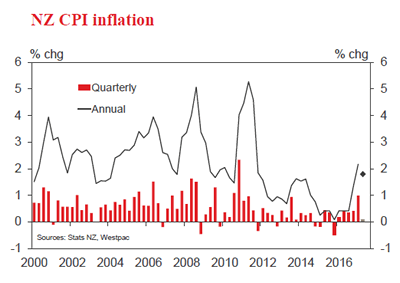
NZ Q2 CPI
Jul 18, Last: 1.0%, Westpac f/c: 0.1%, Mkt f/c: 0.2%
- We expect a 0.1% rise in the Consumer Price Index for the June quarter. This would bring the annual inflation rate down from 2.2% to 1.8%.
- A well-publicised spike in vegetable prices has been offset by a fall in fuel prices. We expect other seasonal influences to be a slight negative on balance.
- Our forecast is below the Reserve Bank's estimate of a 0.3% quarterly rise. However, the Reserve Bank was already expecting the recent pickup in inflation to recede over the coming year. We expect the OCR to remain unchanged until 2019, in contrast to market expectations of a rate hike by mid-2018.
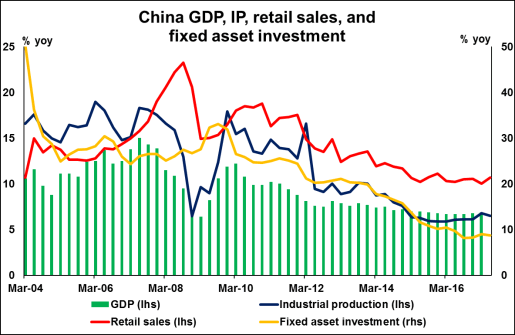
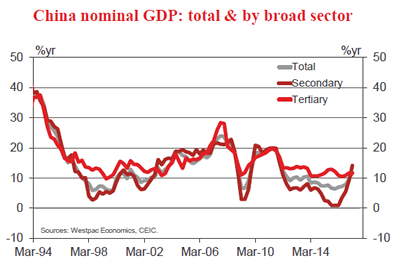
China Q2 GDP
Jul 17, Last: 6.9%, WBC 6.8%
- The March quarter followed December's beat with a second consecutive upside surprise, annual real GDP growth accelerating from 6.8%yr to 6.9%yr against expectations for an unchanged result.
- Compared to authorities' 2017 annual growth target of "around 6.5%yr", Q1 was certainly a strong start which provides a solid foundation to meet (or exceed) the 2017 growth target of 6.5%.
- Available PMI data for the June quarter points to continued robust growth over the past three months. Though the deterioration in employment conditions does warrant some caution over momentum in the services sector.
- We look for annual growth to edge down to 6.8% in Q2 on its way to a 6.6% result for 2017 overall. Nominal growth will continue to be supported by commodity prices.
ECB July meeting
Jul 20, Last: -0.4%, WBC -0.4%
- The market has continued to speculate over a near-term change in the stance of policy by the ECB in recent months. Optimsim in the region is unquestionably strong and this has supported robust gains in the Euro.
- The reality is that no announcement is likely until at least September, when the ECB's next set of forecasts will be released. The actual stance of policy wont change until the beginning of next year. During 2018, the pace of asset purchases will be curtailed, but only slowly.
- In terms of the key themes, the focus for post-meeting communications will be on: underutilisation of labour and associated weak wages growth; consequent expectations for core inflation; and the balance of activity growth between consumption and investment.
Hatrick of Disappointments For US Data
It's been a rotten week for the dollar, with Janet Yellen's acknowledgement on Wednesday that there are concerns within the Federal Reserve about persistent low inflation hitting the currency quite hard as traders revised lower their expectations for another rate hike this year. This comes at a time when traders were already doubting whether the Fed would follow through on plans for a third hike.
The data from the US has been relatively uninspiring, particularly on the inflation side and the numbers today will have done nothing to give policy makers any more confidence. While CPI may not be the Fed's preferred measure of inflation, it is released three weeks before the core PCE price index and therefore offers plenty of value. The PCE price index may be a little lower than its CPI alternative but they tend to follow similar trends and today's drop in headline CPI doesn't bode well for it.
The consumer figures were no better, with retail sales falling for a second month and continuing a worrying trend this year. What's more, the UoM consumer sentiment survey indicated that things are not going to improve, with current conditions actually exceeding forecasts but expectations falling far short, dragging the overall reading much lower.
As is to be expected, the US dollar has not fared well since the data was released and is currently down around half a percent on the day with sterling trading at a near 10 month high against it and a number of other currencies testing similar levels. Even the yen, which has struggled in recent months, is performing well against the greenback although as it stands, there's little reason to believe this is anything more than a correction.
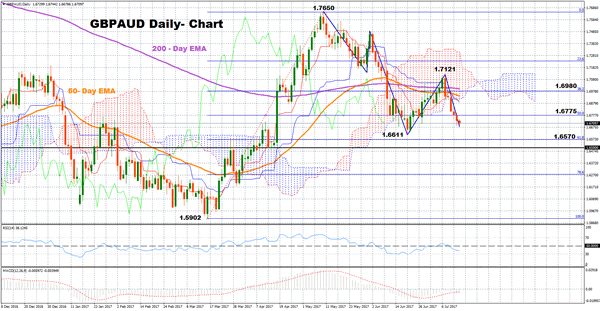
GBPAUD Bearish Bias Intact; Medium-Term Outlook Stays Neutral
GBPAUD has recorded a downtrend since last peaking at a nine-month high of 1.7650 on May 10. However, the pair is currently finding difficult to reach above 1.70 handle as the short-term bias remains bearish, while medium-term outlook continues to be neutral.
In the near-term, technical indicators do not point to any disruption of the current bearish bias pattern. Instead, there is more risk to the downside, as prices have crossed below the Ichimoku cloud, as well as the 50-day and 200-day exponential moving averages (EMA), while if prices fall below the previous low of 1.6611, an extension of the current downtrend might occur. Moreover, the RSI and the MACD give an additional bearish signal, fluctuating below their thresholds. The RSI has been trending down under 50 since July 10, whereas the MACD despite pushing higher on June 30, has flattened out in negative territory.
Should the pair build on the downside momentum, it would find support first at the previous low of 1.6611 and then at 1.6570, which is the 61.8% Fibonacci level of the March-May upleg from 1.5902 to 1.7650. Further declines, would touch the 78.6% Fibonacci of 1.6257.
Alternatively, resistance is expected at the 50% Fibonacci mark of 1.6775, while a stronger barrier to upside movements is likely to be found around the 38.2% Fibonacci of 1.6980, between the two EMAs and within the Ichimoku cloud. The latest top of 1.7121, could also act as a potential resistance.
Looking at the medium-term picture, the market maintains neutral as long as it ranges between 1.7800 and 1.5742.
Dollar Tumbles on Disappointing Inflation; Kuwait’s OPEC Governor Boosts Oil
The dollar tumbled against all majors after a set of disappointing US data releases. The dollar index fell to a fresh 10-month low of 95.25 immediately following the release. The weaker dollar boosted other majors as well as gold.
Both US CPI and retail sales numbers for June came in short of expectations, pushing the dollar to 112.38 yen from 113.04.
Headline CPI was weaker than estimated at 0.1% month-on-month in June, mirroring the prior increase of 0.1%. It was expected to increase by 0.2%. Meanwhile, year-on-year, CPI rose 1.6% versus a prior 1.9% and below the expected 1.7%. Core inflation maintained the momentum with a 1.7% year-on-year increase, as forecasted.
The US retail sales data ex-autos showed a 0.2% month-on-month decline in June, well below the expected 0.2% gain, but an improvement from the prior 0.3% fall. Total retail sales were also down by the same amount and the control group (ex-auto, gasoline, food service and building materials) declined 0.1%. There were some minor upward revisions to May's total figure but not enough to offset the shortfall in June.
Today's weak data along with the earlier dovish-perceived take on US monetary policy by Federal Reserve Chair Janet Yellen, confirms markets skepticism of another rate hike this year.
The dollar was additionally pressured by a report showing US consumer sentiment worsened in July. The preliminary University of Michigan index fell to 93.1 from June's final reading of 95.1 and came in below the forecast of a 95.0 reading.
Aside from US data, investors also had their focus on Federal Reserve Bank of Dallas President Robert Kaplan (an FOMC voting member) who is scheduled to speak at a conference in Mexico today.
In the absence of notable economic data releases out of the UK and the eurozone, the US data release dictated most of the forex trading today. On the back of dollar weakness, the euro rose to $1.1451, while the pound breached above the 1.3000 level, hitting a two-month high. The Canadian dollar also gained with dollar/loonie dropping to 1.2682.
Oil prices continued gaining for the second consecutive day, rising by around 1% today. WTI and Brent got a boost in late European session following the news that Kuwait's OPEC governor Haitham Al-Ghais said in an interview to Reuters that the market was on a recovery track due to increasing global demand.
Inversely related to the dollar, gold prices rose as the dollar plunged in early US trading hours. The precious metal was last trading just above $1,230.00 an ounce.
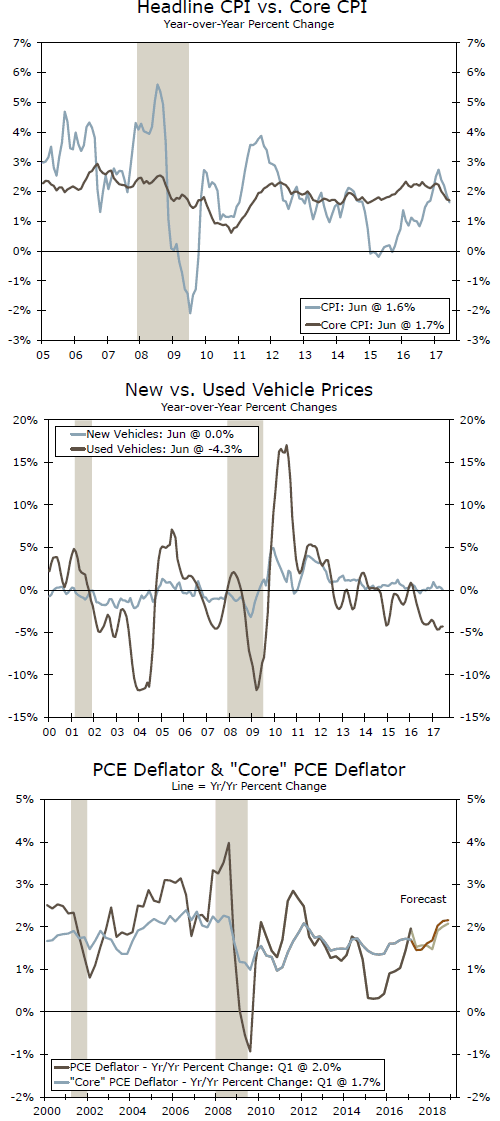
CPI Inflation Remains Tame in June
As financial market focus intensifies over the price environment, CPI inflation came in below consensus expectations in June, reinforcing the Fed's interest as they evaluate future monetary policy tightening action.
Another Soft Month
On balance, consumer inflation has registered soft performances over the prior four months and June was no exception as headline Consumer Price Index (CPI) was unchanged. The flat monthly performance was lower than the consensus expectation, and reinforces the view that the price environment exhibits little upward momentum as we enter the second half of the year. Year-over-year, headline CPI has steadily declined from its 2.7 percent recent high in February to its current reading of 1.6 percent.
Looking at the two components that can heavily influence the headline, the energy index declined for the second straight month, -1.6 percent, as all three component indices fell. The food index was unchanged on the month, after registering gains over the previous five months.
Excluding food and energy, the core CPI rose 0.1 percent on the month, the third consecutive increase at that below trend pace. A perennial group of components accounted for the softer-than-expected gain with apparel declining for the fourth straight month, new & used cars falling for the sixth consecutive month, airfares contracting for the third straight month, and wireless services down for the fourth consecutive month. That said, some of the larger components of core CPI saw larger price gains, including rent and owners' equivalent rent both rising 0.3 percent and medical care services also advancing 0.3 percent on the month. The three month annualized rate of core CPI firmed to a 1.0 percent pace, but remains below the 1.7 percent year-over-year pace and, therefore, suggest there is little upward pressure on core consumer inflation as Q3 unfolds.
Inflation Performance Takes Pivotal Role to Future Rate Hikes
At this past week's monetary policy testimony before Congress, Chair Yellen reiterated the Fed's view that the "recent lower reading on inflation are partly the result of few unusual reductions in certain categories of prices." Today's report placed more pressure on that view as a broad base of components shows little sign of let up. That said, officials did cut their 2017 headline and core PCE deflator projections - their preferred measures of consumer inflation - in the June economic outlook (down to 1.6 percent and 1.7 percent year-over-year, respectively, for Q4). We too have recently lowered our consumer inflation projections, taking headline and core CPI down to 1.8 percent and 1.9 percent year-over-year, respectively, in Q4 (we also cut our headline and core PCE deflator projections to 1.6 percent yearover- year each in Q4). Our updated forecasts generally agrees with Fed officials' sentiment that recent weakness should not be extrapolated into the second half of the year, but that any gains are also likely to be limited. There is a lot of runway left before the December FOMC meeting where we believe the Fed may be in position to hike interest rates again, but a return to a quickening pace of inflation is critical to that call.
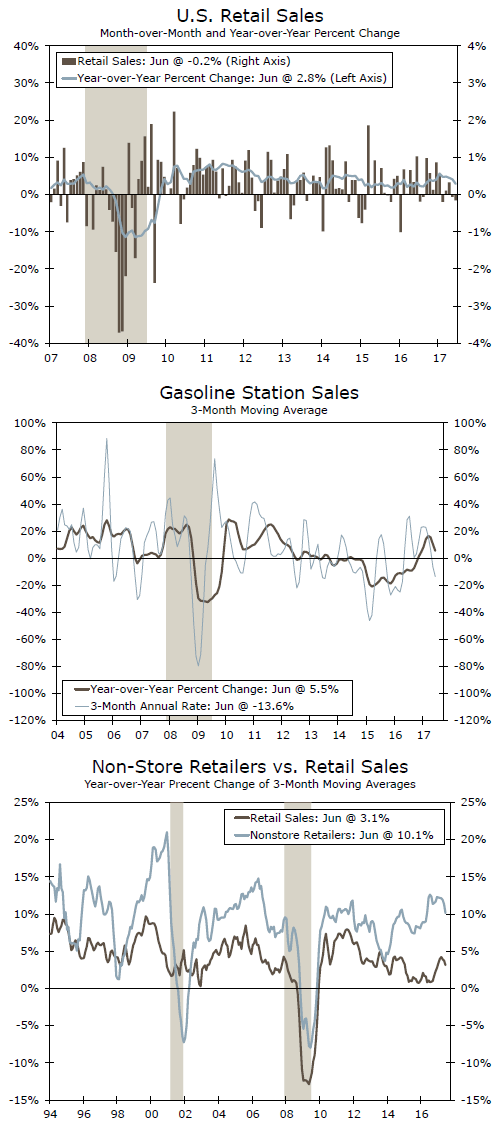
Gasoline Sales Exerting Downward Pressure on Retail Sales
Retail sales came in lower than market expectations, down 0.2 percent in June, while the 0.3 percent decline in May was upwardly revised to a decline of 0.1 percent. Once again gasoline sales were down in the month.
Weakness in Retail Sales Persists
American consumers continued to disagree with themselves in June as consumer confidence has remained high but has still not translated into much higher consumption. Once again, nominal retail sales dropped in June, this time by 0.2 percent, driven by a 1.3 percent decline in gasoline sales, the fourth consecutive monthly decline for this sector of retail as gasoline prices continued to come down. However, gasoline sales were not the only culprit for the weakness. Food and beverage consumption declined 0.4 percent while clothing sales did so by 0.1 percent. Sporting goods sales were down 0.6 percent and remained the worst performing sector on a year-over-year basis, down 7.7 percent, non-seasonally adjusted.
Although general merchandise sales increased 0.4 percent during the month and are up 2.3 percent on a year-earlier basis, department stores sales were down once again, this time by 0.7 percent, and were the second worst performing sector on a year-earlier basis, down 4.2 percent. Meanwhile, miscellaneous store retail sales slumped 3.1 during the month after declining 0.7 percent in May. Miscellaneous store retail sales were very weak, up 0.8 percent, on a year-earlier basis in June. The last weak sector was eating and drinking places sales, which represents the service side of the report. Those sales were down 0.6 percent in the month.
On the positive side, motor vehicles and parts sales were up a third consecutive month, increasing 0.1 percent, and reversing the strong weakness shown during the first quarter of the year. On a year-earlier basis, motor vehicle sales were up 4.3 percent. Meanwhile, furniture sales and electronics sales were up 0.1 percent month on month while they were up 3.5 percent and 1.6 percent on a year-earlier basis.
Building materials sales were up 0.5 percent in June after declining 0.6 percent in May while health and personal care sales improved 0.3 percent. Perhaps the only sector that continues to beat the trend, not surprisingly, is non-store retailer sales, which increased 0.4 percent after doing so by 0.8 percent in May. This sector continues to be the strongest sector of retail, growing at a 9.9 percent on a year-earlier basis.
Overall a Disappointing Performance for Retail Sales
Although personal consumption expenditures are expected to bounce back during the second quarter of the year, the bounce back may not be as strong as what we were expecting if these numbers remain as they were originally published, which is a big if. Furthermore, this is a nominal report, meaning that the real numbers may do the trick to help consumer demand growth in the second quarter. However, that is no help for retailers looking for higher revenues on their sales efforts.