Sample Category Title
Dairy Product Prices Drop For Second Straight Time
'Prices for nearer-dated contracts lifted more than prices for later dated ones, suggesting some buyers need whole milk powder more urgently than others.' — Susan Kilsby, AgriHQ
Dairy product prices fell for the second consecutive time at the latest auction held on Tuesday in New Zealand, official data showed. The GDT Price Index dropped 0.4%, following a 0.8% decrease registered at the preceding auction, with an average selling price of $3,303 per tonne. During the Tuesday auction, some 28,574 tonnes of dairy products were sold, compared with 21,171 sold previously. The price of skimmed milk powder fell 4.5% to $2,090 per tonne, the price of anhydrous milk fat dropped 3.5% to $6,596 per tonne. On the other hand, lactose gave up 3.3%, falling to $839 per tonne, while prices of cheddar retreated 3.2% to $4,051 per tonne. Moreover, the price of rennet casein fell 2.7% to $6,133, whereas butter prices showed a slight decline of 0.1% to $5,775. Though, the price of butter was still more than two times higher since June 2016. Some experts suggested that it was too early to expect dairy product prices to resume the downside trend. Some 127 out of 165 bidders won, with the majority of buyers coming from the Middle East and North Asia.
Elliott Wave Analysis: AUDUSD Undergoing A Three Wave Reversal Lower
AUDUSD made a sharp and strong recently, which we now see it as a start of a three wave reversal lower. This sharp reversal also suggests that a bigger correction within black wave IV is completed and that more weakness may follow. At the moment we see black wave A/1 in action, that can search for support around 0.7537 level.
AUDUSD, 4H
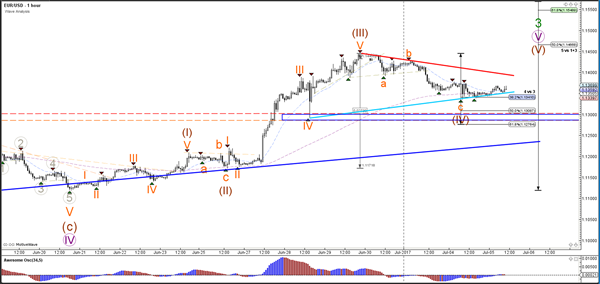
Daily Technical Analysis: EUR/USD, USD/JPY Setup Contracting Triangle Chart Patterns
Currency pair EUR/USD
The EUR/USD pullback is creating a contracting triangle chart pattern via the trend lines (blue/red). A bullish break above resistance (red) could see price approach the Fibonacci targets of wave 5 (purple) which could complete wave 3 (green). A bearish break could see price retest the broken resistance levels.
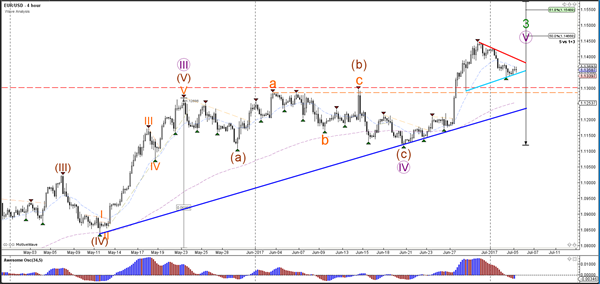
The EUR/USD is still completing its ABC zigzag correction (orange) within wave 4 (brown). The Fibonacci levels of wave 4 vs 3 (brown) plus the broken resistance levels (blue box) are a key support zone. A bullish bounce confirms the wave 4 whereas a bearish beak invalidates it.
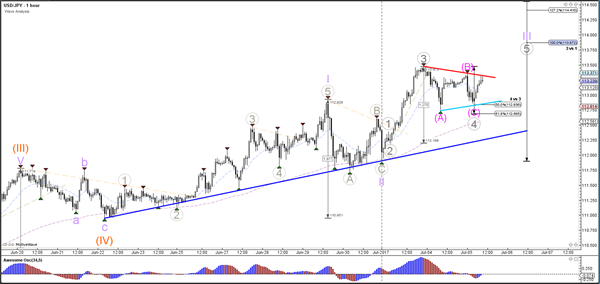
Currency pair USD/JPY
The USD/JPY uptrend is still intact as long as price stays above the support trend line (blue). A new higher high could indicate a bullish continuation towards the Fibonacci targets of wave 3 (purple) and wave 5 (orange).
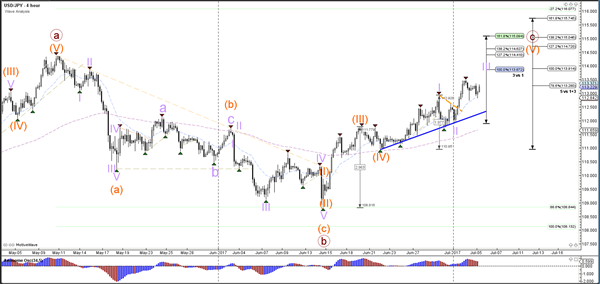
The USD/JPY is in a contracting triangle chart pattern (blue/red lines) after completing an ABC correction (pink). A break below the 61.8% invalidates the wave 4 (grey) whereas a bullish break confirms the wave 5 (grey).
Currency pair GBP/USD
The GBP/USD bullish momentum is losing steam as price is falling lower. The resistance level (red) could be proving to be too tough to break. The support trend lines however could still provide a potential turn around (green/blue).
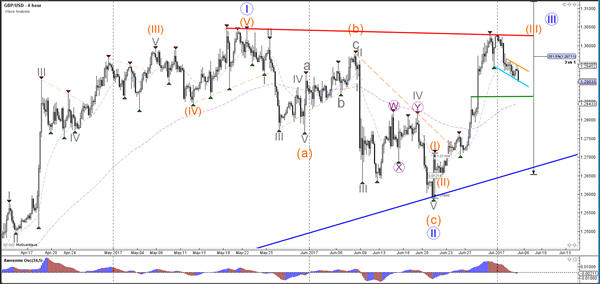
The GBP/USD is attempting to break below the support levels (blue) and 61.8% Fibonacci of wave 4 vs 3, which would invalidate the retracement.
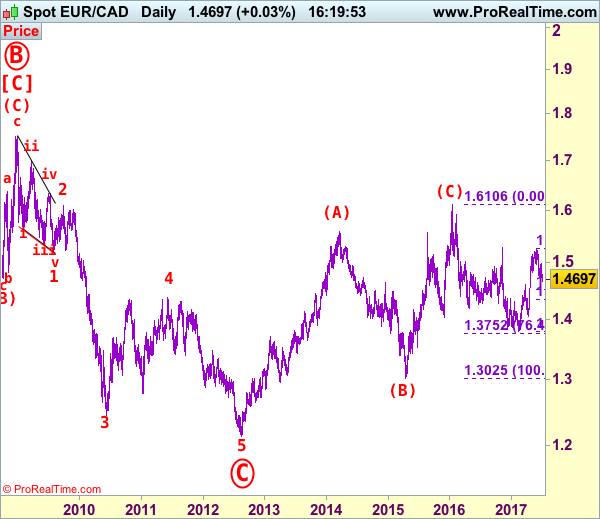
EUR/CAD Elliott Wave Analysis
EUR/CAD – 1.4693
EUR/CAD: Wave 4 ended at 1.4380 and wave 5 as well as circle wave C has possibly ended at 1.2129, major (A)-(B)-(C) correction has commenced and indicated target at 1.6000 had been met.
The single currency only recovered to 1.4980 (we recommended to sell at 1.5000 in our previous update and missed the entry) before dropping again, adding credence to our view that top has been formed at 1.5259 last month, hence downside bias remains for this fall from there to extend weakness to 1.4600, then 1.4520-25 (50% Fibonacci retracement of entire rise from 1.3784-1.5259), however, near term oversold condition should limit downside to 1.4480-85 and reckon support at 1.4397 would hold from here, risk from there is seen for a strong rebound to take place later.
Our latest preferred count is that larger degree wave [C] from 1.3289 as well as circle wave B ended at 1.7509 in Dec 2008 with (A): 1.6325, (B): 1.4719 followed by wave (C) at 1.7509, hence circle wave C is unfolding with wave 1 ended at 1.5186 (diagonal wave 1), wave 2 at 1.6096, impulsive wave 3 has ended at 1.2451, followed by wave 4 at 1.4380, in view of recent strong rebound, we are now treating the wave 5 as well as larger degree circle wave C has ended at 1.2129, hence (A)-(B)-(C) correction has commenced from there with impulsive wave (C) now unfolding and indicated initial upside target at 1.6000 had been met and reckon 1.6500 would hold.
On the upside, whilst initial recovery to 1.4730-35 and possibly 1.4780 cannot be ruled out, reckon upside would be limited to 1.4830-35 and bring another decline later. Above 1.4900 would risk another test of said resistance at 1.4980, break there would signal first leg of decline from 1.5259 top has ended, risk a stronger rebound to 1.5050 and possibly towards 1.5100-10 but price should alter well below said resistance at 1.5259 and bring another decline later this month.
Recommendation: Sell at 1.4770 for 1.4570 with stop above 1.4870.
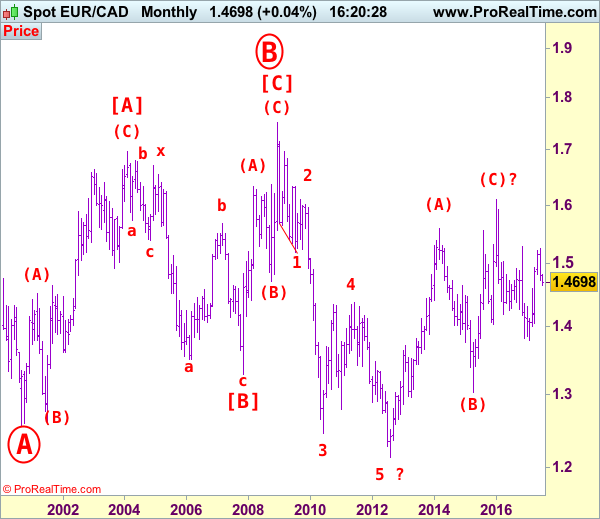
On the bigger picture, our long-term count on the monthly chart is that a big sideways consolidation from 2000 low of 1.2557 has possibly ended at 1.7509 as circle wave B with [A]: 1.6976 ( (A): 1.4513, (B): 1.2612, (C): 1.6976), wave [B]: 1.3289 is a double three with 1st a-b-c: 1.5384, x: 1.6709 and 2nd a-b-c: 1.3289. As indicated above, the wave [C] has ended at 1.7509. The selloff from there is now unfolding which itself should be labeled as an impulsive wave with wave 1: 1.5186 (diagonal wave 1), followed by wave 2: 1.6096 and wave 3: 1.2451, wave 4: 1.4380, wave 5 as well as larger degree circle wave C has possibly ended at 1.2129 and major correction has possibly commenced for retracement of recent decline towards 1.4000, then 1.4180-90 (38.2% Fibonacci retracement of 1.7509-1.2129). Below said support at 1.2129 would risk weakness to psychological support at 1.2000 and then 1.1851 (50% projection of 1.7509-1.2451 measuring from 1.4380) but reckon 1.1500 would remain intact, bring reversal later.
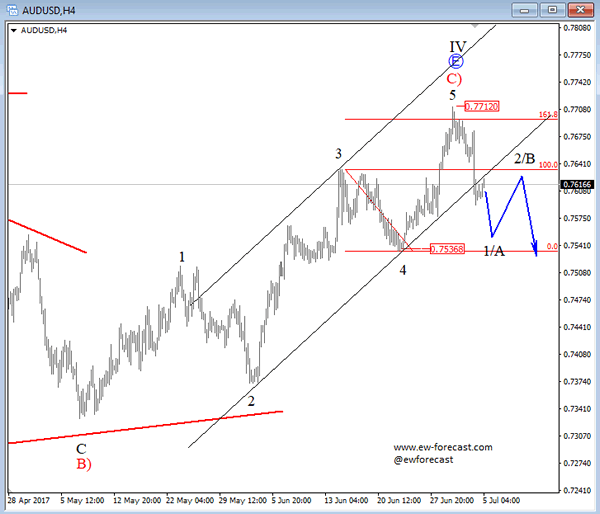
AUD/USD Elliott Wave Analysis
AUD/USD – 0.7615
AUD/USD – Wave 5 of C and (B) has possibly ended at 1.1081
Although aussie rose to as high as 0.7717 late last week, the subsequent sharp retreat from there suggests a temporary top has been formed and consolidation with initial downside bias is seen for weakness towards support at 0.7535, however, still reckon downside would be limited to 0.7490-00 and bring another rise later, above 0.7680-85 would bring retest of 0.7717, however, loss of upward momentum should prevent sharp move beyond previous chart resistance at 0.7750, bring another retreat later.
We are keeping our count that top has been formed at 1.1081 (wave 5 of V) and major correction (A-B-C-X-A-B-C) has commenced, indicated downside targets at 0.7945 (61.8% Fibonacci retracement of entire rise from 0.6007-1.1081) and 0.7750 had been met and downside bias is seen for further weakness to 0.6800, then 0.6700 but reckon 0.6500 would hold from here.
Our preferred count is that the rally from 0.6007 to 0.7270 (7 Jan 2009) is marked as wave A, the retreat to 0.6248 (2 Feb 2009) is wave B and the subsequent upmove is labeled as wave C with wave (iii) and wave (iv) ended at 0.8265 and 0.7700 respectively and wave (v) as well as 3 ended at 0.9407, then wave 4 ended at 0.8066 (instead of 0.8578). The wave 5 has met our indicated projection target of 1.1060 and could ended at 1.1081, this level is now treated as the peak of wave (C) as well as larger degree wave B, hence major fall in wave C has commenced, our initial downside target at psychological support at 0.7000 has just been met and further weakness to 0.6500 would be seen later.
On the downside, whilst initial pullback to 0.7535 support cannot be ruled out, reckon downside would be limited to 0.7490-00 and bring another upmove later. Below 0.7455-60 would abort and suggest the rebound from 0.7329 has ended instead, bring further fall to 0.7415 support, however, as broad outlook remains consolidative, indicated strong support at 0.7372 should remain intact.
Recommendation: Buy at 0.7500 for 0.7700 with stop below 0.7400.

Our alternate count on the daily chart treated the top formed in 2008 at 0.9851 could be a larger degree wave I and was followed by a deep and sharp correction in wave II to 0.6007 and wave III is unfolding from there.
The long-term uptrend started from 0.4775 (2 Apr 2001) with an impulsive structure. Wave I is labeled as 0.4775 to 0.9851 (15 Jul 2008), wave II has ended at 0.6007 (Oct 2008) and wave III is still in progress which may extend further gain to 1.1265.

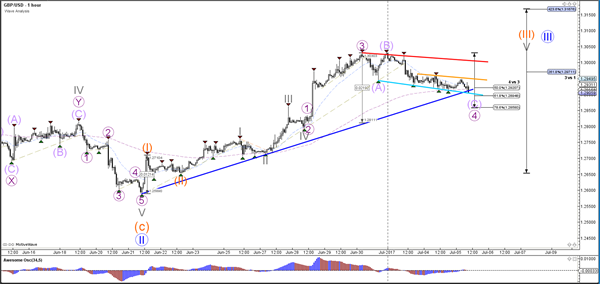
Trade Idea: GBP/USD – Buy at 1.2835
GBP/USD – 1.2906
Recent wave: Wave V of larger degree wave (III) has ended at 1.1986 and major correction has commenced from there for gain to 1.3000 and 1.3140-50
Trend: Near term up
Original strategy :
Buy at 1.2870, Target: 1.3020, Stop: 1.2810
Position: -
Target: -
Stop: -
New strategy :
Buy at 1.2835, Target: 1.3000, Stop: 1.2800
Position: -
Target: -
Stop:-
As sterling has slipped again today, suggesting near term downside risk remains for the corrective fall from 1.3030 temporary top to bring retracement of recent upmove, hence weakness to previous resistance at 1.2861 (now support) cannot be ruled out, however, reckon 1.2830-35 (50% Fibonacci retracement of 1.2640-1.3030) would limit downside and bring another rise later, above 1.3000 would bring test of said resistance at 1.3030, break there would extend the rise from 1.2589 low towards recent high at 1.3048 but break there is needed to retain bullishness and bring subsequent headway towards 1.3090-00.
Our preferred count on the daily chart is that cable's rebound from 1.3500 (wave (A) trough) is unfolding as a wave (B) with A ended at 1.7043, followed by triangle wave B and wave C as well as wave (B) has ended at 1.7192, the subsequent selloff is the larger degree wave (C) which is still unfolding with minor wave (III) of larger degree wave 3 ended at 1.1986, hence wave (IV) correction is in progress which could either be a triangle wave (IV) of a complex formation but upside should be limited to 1.3500 and price should falter well below 1.4000, bring another decline in wave (V) of 3 for weakness to 1.1500, then 1.1200.
On the downside, whilst initial pullback to 1.2900 is likely, reckon 1.2861 (previous resistance turned support) would limi downside and 1.2830-35 should hold, bring such a rise. Below support at 1.2794 would abort and signal top is formed instead, risk further fall to 1.2750, then towards 1.2706 support.
US Dollar Steady Ahead Of Fed Minutes, Euro, Sterling Modestly Up
Following yesterday's low trading activity during the US session amid the 4th of July holiday in the US, not much data has been released during today's Asian session either. Both, the euro and sterling modestly gained against the dollar. Looking at commodities, both oil prices and gold were up.
The Australian dollar retraced some of yesterday's losses, last trading at $0.7614, after tumbling on Tuesday as a result of the Reserve Bank of Australia's decision to maintain a neutral policy stance. It seems that traders dismissed a mixed bi-weekly global dairy auction report that showed average dairy prices edged lower from the prior period, but whole milk powder, a key New Zealand export, rose.
The greenback held steady against the yen during the Asian trading session, following some weakness yesterday. The dollar was trading at 113.26 yen, ahead of the European trading session. Looking ahead, the release of the Fed's meeting minutes will be the focus of the day that could induce significant moves in the US dollar. Ahead of Friday's key jobs report, investors want to gauge how committed the Fed was to hiking rates again this year, as well as any details on plans to wind back its balance sheet.
The euro gained against the US dollar during the Asian session, retracing yesterday's losses on a more cautious tone regarding the monetary policy outlook by the ECB's Chief Economist, Peter Praet. Upside in the Spanish services PMI provided a boost to the euro. At 58.3, June services PMI came in above the expectations of 56.5 and the prior month's 57.3. Euro/dollar was last trading at 1.1364. Looking ahead, the pair could be driven by services PMI data that are scheduled to be released for the eurozone and a number of its member countries, including Germany, France and Italy.
The pound also gained modestly against the greenback during the Asian session, with pound/dollar last trading at 1.2922. Similar to the eurozone, focus in the UK will be on services PMI for June. At 53.5, the forecast is just slightly below May's reading of 53.8.
In the commodities markets, gold rose for the second consecutive day, last trading above the $1,225 an ounce handle. The precious metal has been gaining as it is perceived as a safe-haven in the wake of another long-range missile test by North Korea.
Oil prices across have been rising as the European session was starting. WTI inched higher, reaching $47.13 a barrel, following several days of gains. Brent crude has been also gaining, up 0.26%, last trading at $49.76 a barrel.
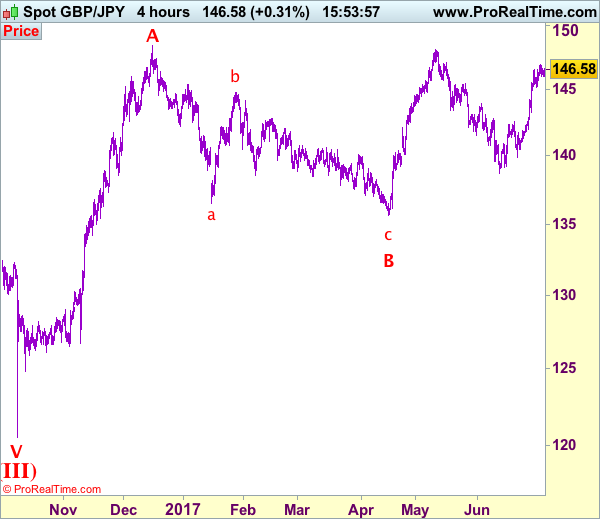
Trade Idea: GBP/JPY – Buy at 145.15
GBP/JPY - 146.55
Recent wave: Medium term low formed at 120.50 and (A)-(B)-(C) major correction has commenced with (A) leg ended at 148.45, hence wave (B) is unfolding for retreat to 131.00-10.
Trend: Near term up
Original strategy:
Buy at 145.15, Target: 147.15, Stop: 144.55
Position: -
Target: -
Stop: -
New strategy :
Buy at 145.15, Target: 147.15, Stop: 144.55
Position: -
Target: -
Stop:-
As sterling has maintained a firm bias after recent rally, suggesting bullishness remains for further gain to 147.10 (previous resistance), having said that, loss of near term upward momentum should prevent sharp move beyond 147.50-60 and price should falter below recent high at 148.10, risk from there is seen for a retreat later.
In view of this, would not chase this rise here and we are looking to buy sterling on subsequent pullback as support at 145.15 should limit downside. Below 144.60-70 would defer and risk test of previous resistance at 144.20, break there would abort and signal a temporary top is formed, bring correction of recent rise to 143.90-00 but support at 143.30 should remain intact.
Our preferred count is that larger degree wave V with circle is unfolding from 251.12 with wave (I) 219.34, (II): 241.38 and wave (III) is subdivided into 1: 192.60, 2: 215.89 (23 Jul 2008) and wave 3 ended at 118.87 earlier in 2009. The correction from there to 162.60 is wave 4 which itself is a double three and is labeled as first a-b-c ended at 151.53, followed by wave x at 139.03, 2nd a ended at 162.60, 2nd b at 146.75 and 2nd c leg of wave 4 ended at 163.00. Therefore, the decline from 163.00 to 116.85 is now treated as wave 5 which also marked the end of larger degree wave (III), hence wave (IV) major correction has commenced for retracement of the wave (III) from 241.38 and upside target at 183.95-00 (50% Fibonacci retracement of the wave (II) from 241.38) had been met, a drop below 160.00 would suggest wave (IV) has ended at 195.85, bring decline in wave (V) for initial weakness to 130 (already met) and 120.
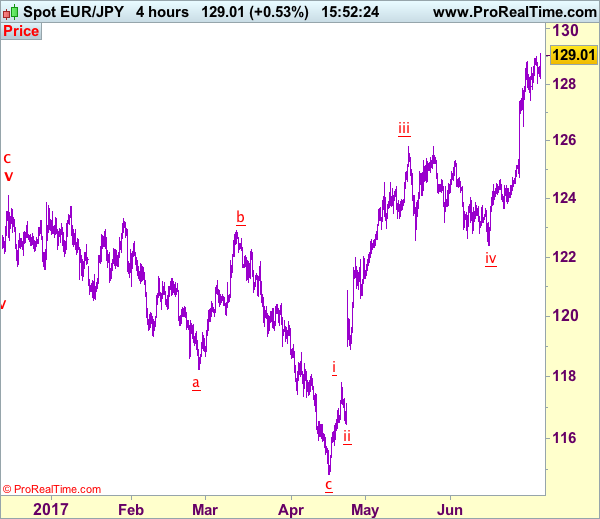
Trade Idea: EUR/JPY – Buy at 127.00
EUR/JPY - 128.90
Recent wave: wave v of (C) ended at 94.12 and major correction in wave A has ended at 149.79
Trend: Near term up
Original strategy:
Buy at 127.00, Target: 129.00, Stop: 126.40
Position: -
Target: -
Stop: -
New strategy :
Buy at 127.00, Target: 129.00, Stop: 126.40
Position: -
Target: -
Stop:-
Although the single currency has continued edging higher after resuming recent upmove and further gain to 129.50-60 cannot be ruled out, loss of near term upward momentum should prevent sharp move beyond psychological resistance at 130.00, risk from there has increased for a retreat to take place later. Below 128.00-05 would suggest a minor top is formed, bring correction to 127.40-50 but renewed buying interest should emerge around 127.00, bring another rise later.
In view of this, we are looking to reinstate long on pullback as 127.00 should limit downside. Below support at 126.49 would defer and suggest top is possibly formed, risk correction to 126.00 and later towards 125.40-50.
Our latest preferred count is that wave (ii) is ABC-X-ABC which ended at 123.33 and wave (iii) is unfolding with wave iii ended at 100.77, followed by wave iv at 111.57 and wave v as well as the wave (iii) has ended at 97.04, followed by wave (iv) at 111.43 and wave (v) has ended at 94.12 which is also the end of the larger degree v, this also implied the major wave (C) has also ended there, hence major correction has commenced from there with (A) leg unfolding in its lower degree wave c which has possibly ended at 145.69. Under this count, A-B-C wave (B) has commenced with A leg ended at 136.23, wave B at 143.79 and wave C has possibly ended at 149.79.
Our larger degree count is that the decline from 139.26 is wave (C) and is sub-divided into a diagonal triangle i-ii-iii-iv-v with wave i - 105.44, wave ii- 123.33, wave iii - 97.03, wave iv - 111.43, followed by the final wave v as well as the end of wave (C) at 94.12, this also mark the bottom of larger degree wave B. Under this count, major rise in wave C has commenced as an impulsive wave with minor wave III ended at 145.69, wave V is still in progress for further gain to 150.00. Having said that, this so-called wave V could well be the first leg of larger degree 5-waver wave C and this wave C should bring at least a retest of wave A top at 169.97 (July 2008).
Foreign Exchange Market Commentary: EUR/USD, USD/JPY, GBP/USD, GOLD, WTI CRUDE, DJIA, FTSE100, DAX
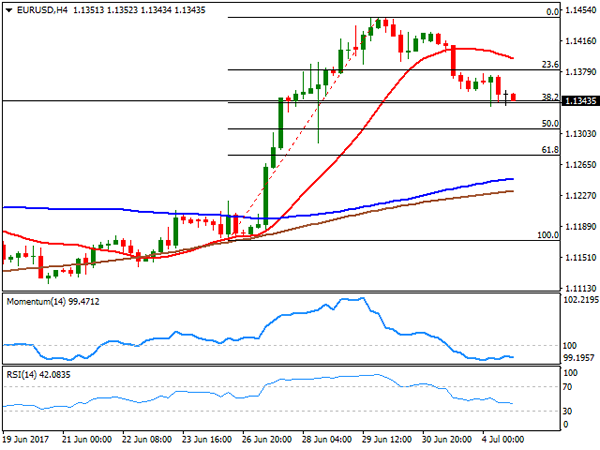
EUR/USD
The greenback edged higher for a second consecutive day against the common currency, with the pair trading as low as 1.1335 before settling a few pips above it. A holiday in the US forced markets into an early close this Tuesday, with action only limited to the Canadian dollar during the last trading hours of the day. The EUR/USD pair advanced up to 1.1373 early Asia, but pulled back afterwards, helped by poor EU PPI figures, as inflation at factory levels fell by 0.4% in May, doubling expectations of a 0.2% decline and well -below the 0.0% printed in April. On a positive note, the EU commission approved the rescue of Italian Banca Monte dei Paschi di Siena by a 5.4 billion-euro capital injection from the local government. This Wednesday, the EU will see the release of the final Markit services and composites PMIs for June, but attention will center in the upcoming FOMC Minutes in the US afternoon.
From a technical point of view, the pair is pressuring the 38.2% retracement of last week's rally at 1.1340, still unable to break below it, but gaining short-term bearish traction as bounces from the level stalled short of the next Fibonacci level, now the immediate resistance at 1.1380. In the 4 hours chart, the 20 SMA turns south above the current level, whilst technical indicators remain within bearish territory, although with limited downward strength amid the absence of volume. The key support anyway, remains to be 1.1290, the low set on June 28th, with a break below it favoring a steeper decline ahead.
Support levels: 1.1340 1.1290 1.1250
Resistance levels: 1.1380 1.1420 1.1460
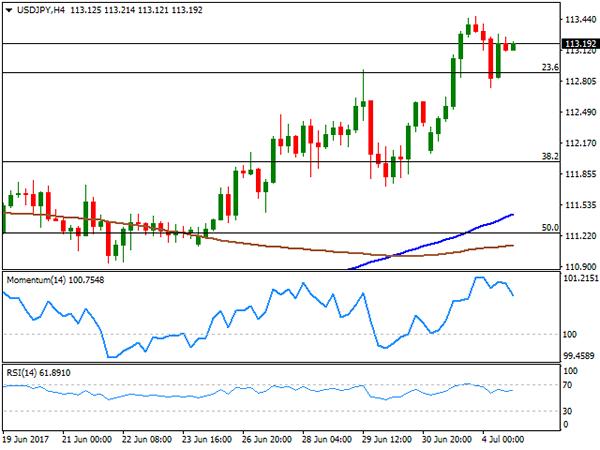
USD/JPY
The USD/JPY pair bounced from a daily low of 112.73 reached at the beginning of the day after North Korea said it successfully test fired an intercontinental ballistic missile. The sour sentiment extended into the European session, with most indexes closing in the red. The pair recovered early London as the dollar got once again investor's favor, but the rally was contained around the current 113.20 level. The June Markit services PMI will be released during the upcoming Asian session, last seen at 53, while in the US, attention will center on the FOMC Minutes, to be released later on Wednesday. Also, backing the recovery in the pair were US Treasury yields, which held at the two-month highs reached on Monday. The short term picture for the pair shows that the upward momentum eased, but also that the risk remains towards the upside, as the 100 SMA extends its advance above the 200 DMA, both well below the current level, while the RSI indicator consolidates around 61. Additionally, the pair recovered after briefly breaking below the 23.6% retracement of its latest decline, the immediate support at 112.90.
Support levels: 112.90 112.50 112.10
Resistance levels: 113.45 113.90 114.40
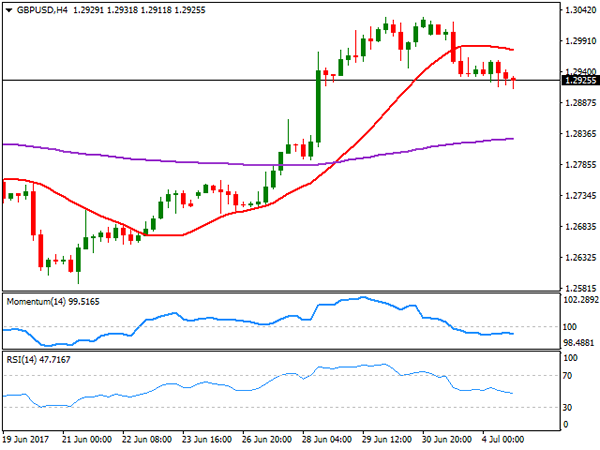
GBP/USD
The Pound maintained the sour tone this Tuesday, extending its decline against the greenback down to 1.2911, its lowest since last Wednesday. The Sterling suffered from the release of the Markit Construction PMI, as the index came at 54.8 in June, down from 56.0 in May. The report attributed the slowdown in the construction sector to risk aversion among clients, reflecting concerns about the economic outlook and political uncertainty. The UK services PMI will be released this Wednesday, expected at 53.5 from previous 53.8. Should the release miss expectations, the GBP will be subject of further sells. Technically, the 4 hours chart shows that the pair is biased lower, as its developing below its 20 SMA, currently at 1.2975, whilst technical indicators remain within bearish territory, with the RSI now at 47, anticipating some further slides on a break below 1.2910. A first line of selling interest waits around 1.2960, the immediate short term support, with the downward pressure easing on a recovery beyond it.
Support levels: 1.2910 1.2870 1.2825
Resistance levels: 1.2960 1.2995 1.3040
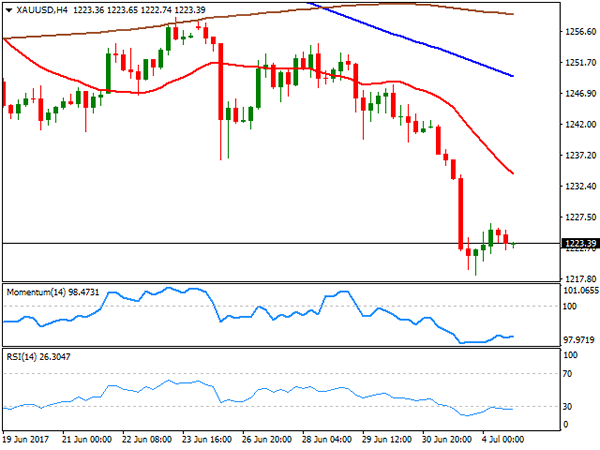
GOLD
Spot gold saw limited action this Tuesday, ending the day barely up at $1,223.39 a troy ounce, as mounting risk aversion on geopolitical tension in Asia, triggered demand for the safe-haven asset, later reverted by renewed dollar's demand. The bright metal was confined to a tight range at the lower end of Monday's range, as investors were cautious ahead of the FOMC Minutes´ release this Wednesday. The US Federal Reserve is not expected to surprise markets, but a hawkish change in the wording could fuel recent dollar's advance. From a technical point of view, the daily chart shows that the early advance was rejected by selling interest around the 200 DMA, whilst technical indicators lost their bearish strength, but hold near oversold levels, supporting the ongoing downward move. In the 4 hours chart, the price is developing below a strongly bearish 20 SMA, while indicators consolidate within oversold territory, in line with the longer term perspective.
Support levels: 1,219.30 1,211.10 1,203.80
Resistance levels: 1,224.40 1,236.50 1,241.80
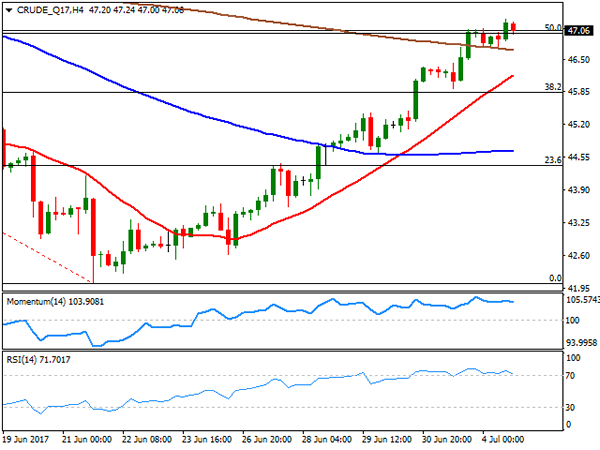
WTI CRUDE OIL
Crude oil prices managed to advance modestly at the beginning of the day, but closed it pretty much unchanged, with WTI futures settling at $47.06 a barrel. The commodity started the day with a soft tone, easing down to 46.73 before bouncing to set a fresh multi-week high of 47.30. Early Asia, the US will release its API crude stockpiles report, although the EIA one, usually more relevant, has been delayed to Thursday amid the 4th of July holiday. The US benchmark closed for a second consecutive day around the 50% retracement of its latest daily decline between 51.98 and 42.04, maintaining the positive tone in the daily chart, as the price remains well below its 20 DMA, whilst technical indicators hold well-above their mid-lines, losing their upward momentum only due to the ongoing holiday. Shorter term, and according to the 4 hours chart, the risk remains towards the upside, as technical indicators consolidate within overbought territory, whilst the price remains above all of its moving averages, with the 20 SMA accelerating its advance after crossing above the 100 SMA.
Support levels: 46.70 46.10 45.50
Resistance levels: 47.30 48.00 48.70
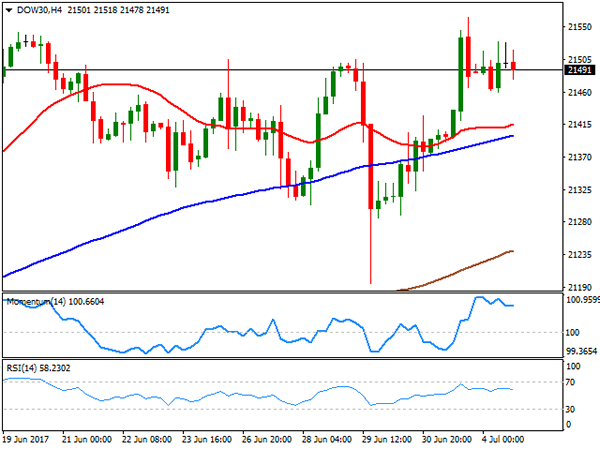
DJIA
Wall Street remained closed this Tuesday amid the celebration of the 4th of July in the US, with the DJIA latest registered close at 21,479.27. Despite the negative tone of Asian and European equities, the index managed to gain modestly in electronic trading, heading into Wednesday's opening at 21,491. Risk aversion seen early Tuesday seem to have eased, although Asian shares will determinate whether the index can resume its advance during the upcoming session. From a technical point of view, the daily chart for the index shows that it holds above a bullish 20 DMA, and far above the larger ones, while technical indicators stand within positive territory, but with limited upward strength, maintaining the risk towards the upside. In the 4 hours chart, technical indicators have partially corrected from overbought readings before turning flat well above their mid-lines, whilst the index remains far above its moving averages, also supporting some further gains ahead.
Support levels: 21,462 21,420 21,361
Resistance levels: 21,506 21,563 21,600
FTSE100
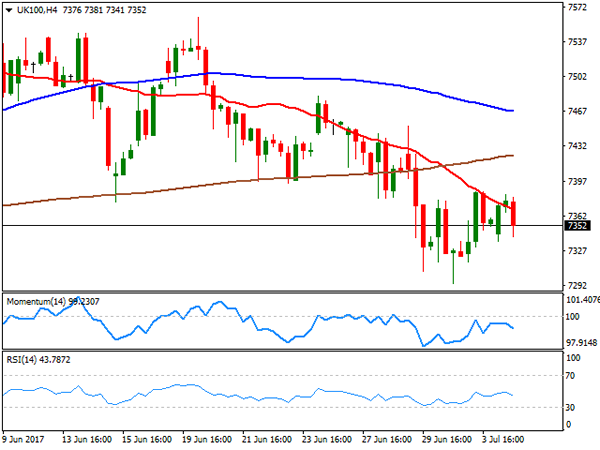
The FTSE 100 extended its slide by 19 points, and closed the day at 7,357.23, with an advance in the mining-sector limiting risk aversion slides. Worldpay Group out-stood, adding 27.70% after the company confirmed it has been approached by U.S. rival Vantiv about a possible takeover. Among the best performers were Randgold Resources that added 2.01%, and Fresnillo that gained 1.16%. Provident Financial led decliners, ending the day 1.98% lower, followed by Smith & Nephew that shed 1.88%. From a technical point of view, the index has made no progress, still at risk of falling further as an intraday advance was once again rejected by selling interest around the 100 DMA, whilst the 20 DMA extended its decline above the largest, and technical indicators hold within bearish territory, turning south. In the shorter term, and according to the 4 hours chart, a bearish 20 SMA limited advances, now at 7,365, whilst technical indicators hover within negative territory, still lacking directional strength.
Support levels: 7,331 7,294 7,256
Resistance levels: 7,380 7,424 7,452
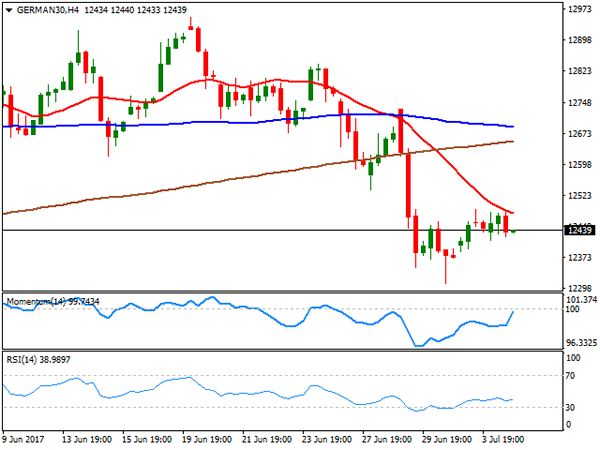
DAX
European equities closed lower this Tuesday, led by a decline in tech and industrial equities. The German DAX lost 0.31% or 38 points, to end at 12,437.13, with banks mixed, as Deutsche Bank was the best performer, up 1.64%, while Commerzbank led losers' list with a 2.07% decline. Sentiment was dented by news that North Korea launched an intercontinental ballistic missile, claiming that it can hit the US state of Alaska. Activity, however, was limited by US markets being closed on holidays. As for the technical outlook, the daily chart shows that the index held above a bullish 100 DMA, but confined within Monday's range, and with technical indicators flat well-below their mid-lines, limiting chances of a stronger recovery at the time being. In the 4 hours chart, a bearish 20 SMA continues to cap advances, while technical indicators recovered, but remain within negative territory, also limiting the upward potential.
Support levels: 12,420 12,364 12,310
Resistance levels: 12,490 12,536 12,587