Sample Category Title
Trade Idea: AUD/USD – Sell at 0.7650
AUD/USD – 0.7618
Recent wave: Wave 5 ended at 1.1081 and major correction has commenced for fall to 0.7000 and then towards 0.6500-10
Trend: Near term up
Original strategy :
Exit long entered at 0.7595
Position: - Long at 0.7595
Target: -
Stop: -
New strategy :
Sell at 0.7650, Target: 0.7500, Stop: 0.7690
Position: -
Target: -
Stop:-
Yesterday’s selloff suggests suggests top has possibly been formed at 0.7712 and consolidation with mild downside bias is seen for test of 0.7575-80, however, break there is needed to add credence to this view, bring retracement of recent rise to 0.7535 support, break there would extend further fall towards 0.7500 which is likely to hold from here due to near term oversold condition.
In view of this, we are looking to sell aussie on recovery as 0.7650 should limit upside. Above 0.7683 resistance would abort and suggest the retreat from 0.7712 has ended instead, bring retest of this level first, then towards 0.7750.
On the 4-hour chart, the move from 0.8066 is the wave 5 with i: 0.8860, ii: 0.8315, wave iii is an extended move ended at 1.0183, iv: 0.9706 and wave v has ended at 1.1081 (also the top of entire wave 5). The subsequent selloff is the major correction which is unfolding as ABC-X-ABC and 2nd A leg has ended at 0.8848, followed by a-b-c wave B which ended at 0.9758, hence, 2nd C wave is now in progress and indicated downside target at 0.7000 and 0.6950 had been met, so further fall to 0.6710-20 cannot be ruled out.

Euro Surges As Draghi Hints At QE Taper
The common currency posted one of its best one-day rally against the U.S. dollar in nearly a year last week. Alongside the gains in the currency, bond prices fell sharply. The reaction came as the European Central Bank president, Mario Draghi signaled that the central bank could begin to wind down its stimulus program.
The hawkish comments from the ECB president come just a few days after the Bundesbank president, Jens Weidmann who also serves on the ECB's governing council signaled his preference for tighter monetary policy.
The surprisingly hawkish remarks from the ECB president Draghi, on the other hand, came just a day after he said that there were risks to prematurely tightening monetary policy. At the time of making the comments, the Eurozone flash inflation estimates were yet to be released.
Any potential policy moves from the ECB towards cutting back the bond purchases will be similar to that of the Fed's tapering. The intention to tighten policy was first executed by winding down the QE before interest rates began to rise.
The ECB's QE was at 80 billion, before being cut to 60 billion in March this year. The next expected cut to QE is likely around September, which will bring the QE purchases to 40 billion. The ECB's bond purchases were expected to run until December 2017 with the potential to extend beyond December if need be.
Draghi at the Economic Policy Conference
Draghi's comments last Tuesday came at the economic policy conference that was hosted in Portugal. Despite the main headline being hawkish, Draghi's speech was full of caution. However, for the market participants, this was the comment that they were waiting for since the ECB's last meeting.
Speaking at the conference, Draghi said, "All the signs now point to a strengthening and broadening recovery in the euro area."
Investors bid the euro higher which rallied as much as 1.4% on the day. It was also the biggest jump seen since June 2016, and the EURUSD closed the day (Tuesday) at $1.1340, after comfortably breaking past the $1.1300 hurdle.
EURUSD reaction to Draghi's comments
There were also rumors from “unknown sources at the ECB' that the market was misinterpreting Draghi's comments. The euro fell but quickly recovered off the $1.130 technical support.
The ECB has been buying eurozone bonds to the tune of 2.3 billion euro. Bond yields rose with prices falling. It also included bonds from Germany and Italy as well.
With the political risks now becoming tailwinds, the path ahead for the ECB is likely to be smooth, provided the current pace of economic recovery is maintained, and inflation shows signs of a pickup.
The ECB's next policy meeting is due in mid-July where the central bank could give out further details on how it intends to taper its bond purchases.
Consumer climate in Germany and France expected to drive growth in the Eurozone
On Thursday, the Gfk's consumer climate data showed a pickup with the upswing in the mood among consumers in Germany. For July, the Gfk's forward looking indicator projected a 0.2 point increase to 10.6, up from 10.4 the month before. The research institute said that its forecast for real private consumer spending would rise 1.5% in 2017.
Gfk German Consumer Climate (July 2017)
Besides the German consumer climate, French consumer mood was also seen rising to the highest levels in nearly 10 years, suggesting that the economic recovery is slowly becoming firmly entrenched.
Eurozone flash inflation estimates
On Friday, the Eurozone's flash inflation estimates were released by the eurozone. The preliminary data on inflation for June showed that headline consumer prices increased 1.3%, while core consumer prices rose 1.1%.
This was higher than the previous month's inflation report which showed headline CPI rising 1.4% and 0.9% a month before.
With the flash inflation estimates more or less validating that inflationary pressures were rising, the ECB could very well be on track with its tightening policy.
Forex Technical Analysis: EUR/USD, USD/JPY, GBP/USD
EUR/USD
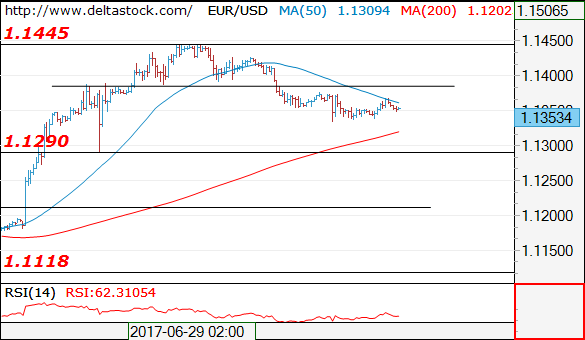
Current level - 1.1353
The bias remains bearish, for a tight test of 1.1290 major support. The latter should provide a reliable base for the next upswing towards 1.1550. Initial intraday resistance lies at 1.1385.
| Resistance | Support | ||
| intraday | intraweek | intraday | intraweek |
| 1.1385 | 1.1450 | 1.1290 | 1.1020 |
| 1.1425 | 1.1610 | 1.1290 | 1.0838 |
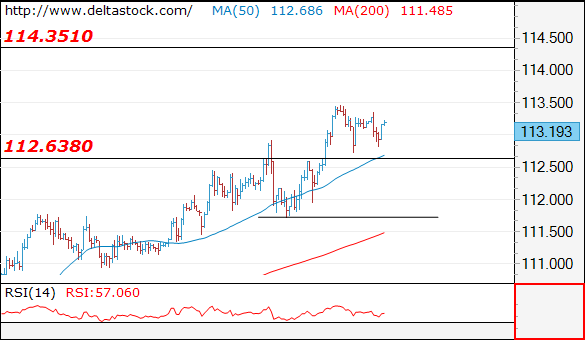
USD/JPY
Current level - 113.19
The pattern below 113.45 is by all means corrective in nature, thus preceding another leg upwards, to 114.30. Initial support lies at 112.60.
| Resistance | Support | ||
| intraday | intraweek | intraday | intraweek |
| 113.45 | 114.30 | 112.60 | 110.30 |
| 114.30 | 115.50 | 111.70 | 108.81 |
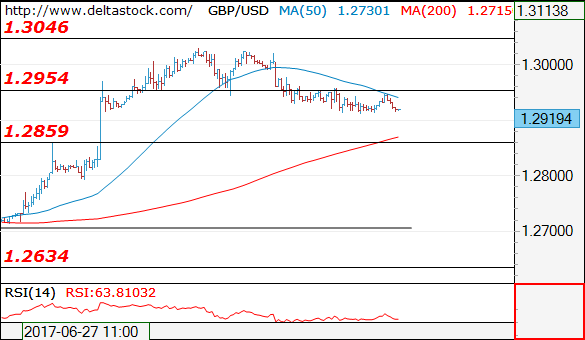
GBP/USD
Current level - 1.2919
The minor downtrend from 1.3030 is still intact, heading towards 1.2860 support zone. Initial resistance lies at 1.2960.
| Resistance | Support | ||
| intraday | intraweek | intraday | intraweek |
| 1.2960 | 1.3130 | 1.2860 | 1.2635 |
| 1.3050 | 1.3500 | 1.2790 | 1.2480 |
NZD/USD Candlesticks and Ichimoku Analysis
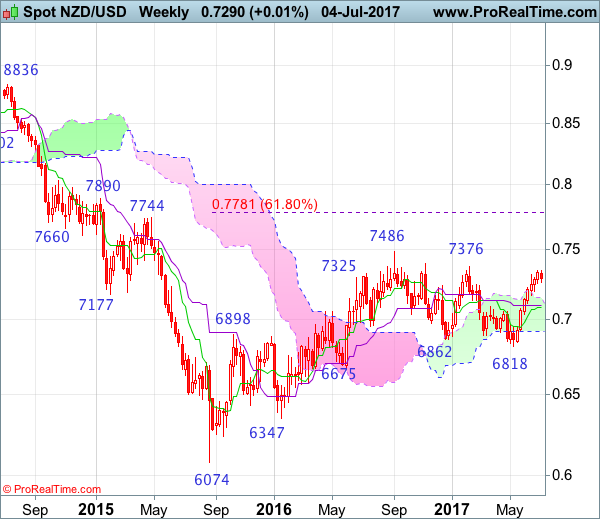
Weekly
• Last Candlesticks pattern: Shooting star
• Time of formation: 5 Sep 2016
• Trend bias: Down
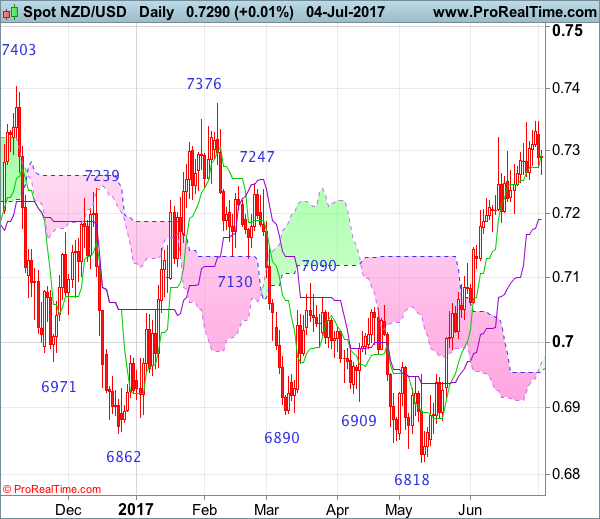
Daily
• Last Candlesticks pattern: Hammer
• Time of formation: 14 Mar 2017
• Trend bias: Near term up
NZD/USD – 0.6974
As kiwi has eased after marginal rise to 0.7346 earlier this week, suggesting consolidation below this level would be seen and below 0.7250-55 would bring pullback to 0.7200, then towards 0.7171, however, reckon downside would be limited to 0.7100 and bring another rise later. Above said resistance at 0.7346 would extend recent upmove from 0.6818 low to previous resistance at 0.7376, having said that, loss of near term upward momentum should prevent sharp move beyond 0.7400 and price should falter below previous chart resistance at 0.7486.
On the downside, whilst initial pullback to 0.7200-10 cannot be ruled out, reckon downside would be limited to 0.7100 and bring another rise later. A daily close below support at 0.7058-60 would abort and suggest a temporary top is formed, bring weakness to 0.7005-10 but reckon downside would be limited to 0.6985-90 and previous resistance at 0.6950 should remain intact, bring another upmove later.
Recommendation: Buy at 0.7100 for 0.7300 with stop below 0.7000.
On the weekly chart, although kiwi edged higher this week and bullishness remains for the rise from 0.6818 to extend gain to previous resistance at 0.7376, break of another previous resistance at 0.7403 is needed to confirm early retreat from 0.7486 top has ended there, bring retest of this level later. Looking ahead, kiwi needs to penetrate this level to confirm erratic upmove from 0.6074 (2015 low) has resumed and extend gain to 0.7550 and later towards 0.7680 which is likely to hold from here.
On the downside, although pullback to 0.7200-10 is likely, reckon the Kijun-Sen (now at 0.7097) would limit downside and bring another rise later. Only below support at 0.7035 would suggest top is possibly formed, risk test of 0.7000 but downside should be limited to 0.6950 and bring another rebound later. Below 0.6915-20 would defer and suggest the rebound from 0.6818 has possibly ended instead, risk further fall to 0.6880 first but said recent low at 0.6820 should hold on initial testing.
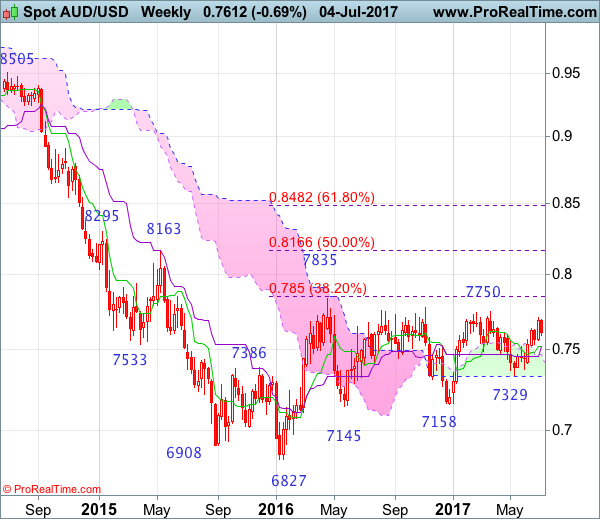
AUD/USD Candlesticks and Ichimoku Analysis
Weekly
• Last Candlesticks pattern: Shooting doji
• Time of formation: 20 Feb 2017
• Trend bias: Sideways
Daily
• Last Candlesticks pattern: Bearish engulfing pattern
• Time of formation: 21 Mar 2017
• Trend bias: Near term down
As aussie has retreated after rising to 0.7712 late last week, suggesting consolidation below this level would be seen and minor correction to 0.7575-80 is likely, however, reckon downside would be limited to support at 0.7535 and 0.7490-00 would hold and bring another rise later, above 0.7685 would bring retest of 0.7712 but break there is needed to extend recent upmove from 0.7329 low to previous resistance at 0.7750, having said that, only break there would retain bullishness and encourage for headway to 0.7800-10 first.
On the downside, whilst pullback to 0.7575-80 is likely, reckon indicated support at 0.7535 would limit downside and bring another rise later. A daily close below 0.7500 would suggest the rebound from 0.7329 low has ended and bring at least a correction of recent rise to 0.7455-60, then towards 0.7400-10 but support at 0.7372 should remain intact. Looking ahead, only below 0.7372 would revive bearishness and bring retest of 0.7329.
Recommendation: Buy at 0.7510 for 0.7710 with stop below 0.7410.

On the weekly chart, aussie traded with a firm undertone after staging a strong rebound from 0.7329, adding credence to our view that the retreat from 0.7750 has ended at 0.7329 and consolidation with upside bias remains for further gain to 0.7680, however, break there is needed to add credence to this view and bring retest of this level later. Looking ahead, only a break above 0.7750 would another leg of the major rise from 0.6827 low is underway for retest of 0.7778, then towards last year’s high at 0.7835.
On the downside, expect pullback to be limited to 0.7500-10 and bring another rise. Below the Kijun-Sen (now at 0.7458) would prolong consolidation and risk weakness to 0.7410-15 but break of support at 0.7372 is needed to signal the rebound from 0.7329 has ended, bring retest of this level first. A break below there would extend recent decline from 0.7750 to 0.7290-00 and possibly towards 0.7230, however, downside should be limited to 0.7200 and price should stay well above previous support at 0.7158, risk from there is seen for a rebound to take place later.
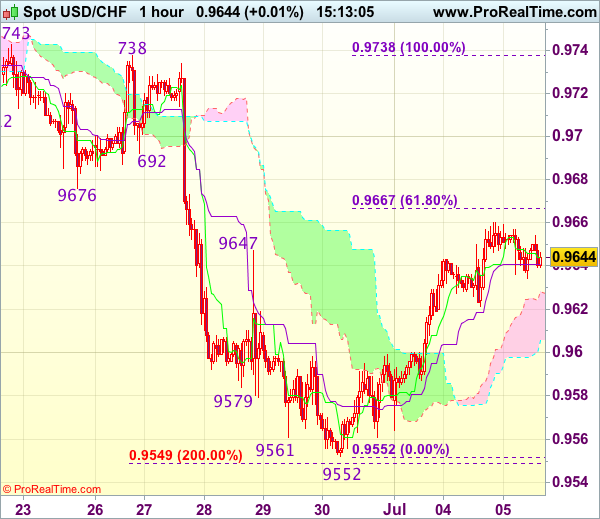
Trade Idea : USD/CHF – Buy at 0.9600
USD/CHF - 0.9647
Most recent candlesticks pattern : N/A
Trend : Near term down
Tenkan-Sen level : 0.9644
Kijun-Sen level : 0.9641
Ichimoku cloud top : 0.9628
Ichimoku cloud bottom : 0.9606
Original strategy :
Buy at 0.9600, Target: 0.9700, Stop: 0.9565
Position : -
Target : -
Stop : -
New strategy :
Buy at 0.9600, Target: 0.9700, Stop: 0.9565
Position : -
Target : -
Stop : -
As the greenback has maintained a firm undertone after staging a strong rebound from 0.9552 (last week’s low), retaining our view that a temporary low has been formed there and consolidation with mild upside bias is seen for this move to bring retracement of recent decline, hence gain to 0.9667-76 (61.8% Fibonacci retracement of 0.9738-0.9552 and previous support turned resistance) is likely, however, reckon upside would be limited to 0.9700 and price should falter below resistance at 0.9738.
In view of this, we are looking to turn long on pullback as 0.9600 should limit downside and bring another rise later. Below 0.9565-70 would abort and signal intra-day top is formed, risk retest of 0.9552 first.
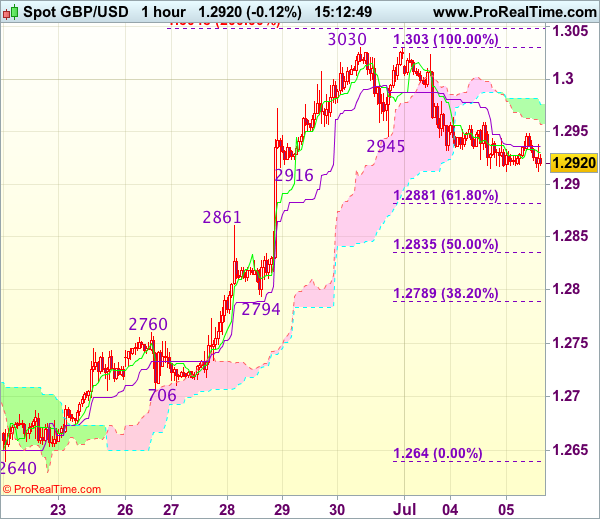
Trade Idea : GBP/USD – Buy at 1.2865
GBP/USD - 1.2905
Most recent candlesticks pattern : N/A
Trend : Near term up
Tenkan-Sen level : 1.2925
Kijun-Sen level : 1.2931
Ichimoku cloud top : 1.2976
Ichimoku cloud bottom : 1.2956
Original strategy :
Buy at 1.2865, Target: 1.3000, Stop: 1.2830
Position : -
Target : -
Stop : -
New strategy :
Buy at 1.2865, Target: 1.3000, Stop: 1.2830
Position : -
Target : -
Stop : -
Although the British pound has remained under near term downward pressure and initial downside risk remains for the corrective fall from 1.3030 (last week’s high) to bring retracement of recent upmove to 1.2880-85 (38.2% Fibonacci retracement of 1.2640-1.3030), reckon downside would be limited to 1.2865-70 and bring another upmove later, above 1.2960 would signal low is formed, bring rebound to 1.3000 but break of said resistance at 1.3030 is needed to signal recent upmove has resumed and extend further gain towards recent high 1.3048.
In view of this, we are looking to buy cable again on further corrective fall as previous resistance at 1.2861 should turn into support and contain downside, bring another rise. Below 1.2830-35 (50% Fibonacci retracement of 1.2640-1.3030) would abort and signal top is formed, bring further fall towards support at 1.2794.
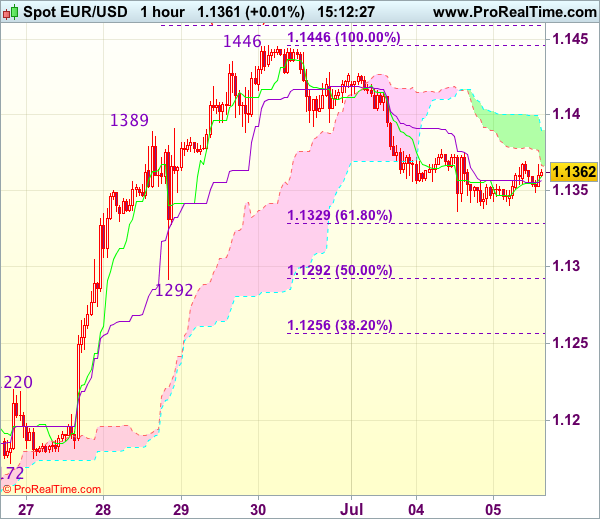
Trade Idea : EUR/USD – Buy at 1.1300
EUR/USD - 1.1366
Most recent candlesticks pattern : N/A
Trend : Near term up
Tenkan-Sen level : 1.1359
Kijun-Sen level : 1.1357
Ichimoku cloud top : 1.1390
Ichimoku cloud bottom : 1.1366
Original strategy :
Buy at 1.1300, Target: 1.1400, Stop: 1.1265
Position : -
Target : -
Stop : -
New strategy :
Buy at 1.1300, Target: 1.1400, Stop: 1.1265
Position : -
Target : -
Stop : -
The single currency met strong resistance at 1.1445 last week and has retreated since, suggesting initial downside risk remains for retracement of recent upmove to 1.1325-30 (38.2% Fibonacci retracement of 1.1139-1.1446), however, reckon support at 1.1292 (as well as 50% Fibonacci retracement) would hold and bring another rise, above 1.1400-10 would bring retest of said resistance at 1.1446, break there would extend recent rise to 1.1455-60 (61.8% projection of 1.1119-1.1389 measuring from 1.1292), then 1.1480.
In view of this, would not chase this rise here and would be prudent to buy euro on pullback as 1.1292 (previous support as well as 50% Fibonacci retracement of 1.1139-1.1446) should limit downside, bring rebound. Below 1.1270 would abort and signal a temporary top is formed, bring correction to 1.1250-55 first.
GBP/JPY Daily Outlook
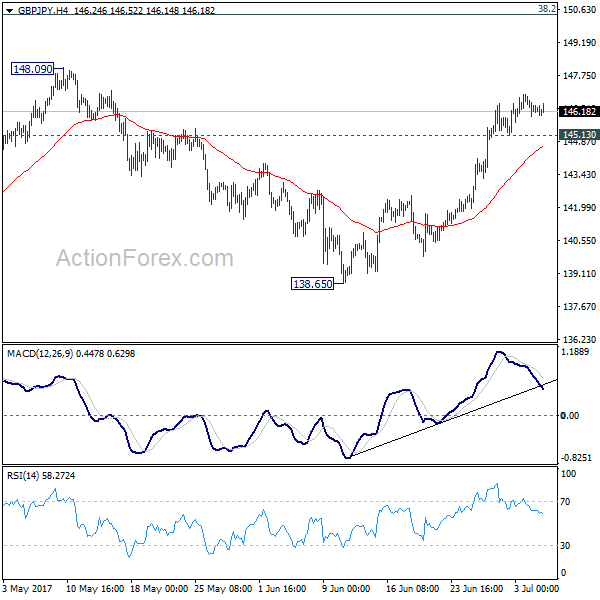
Daily Pivots: (S1) 145.91; (P) 146.38; (R1) 146.78; More....
With 145.13 minor support intact, further rise is expected in GBP/JPY to 148.09/42 resistance. Decisive break there will extend whole rally from 122.36 to long term fibonacci level at 150.43 next. On the downside, below 145.13 minor support will turn intraday bias neutral and bring consolidation again before staging another rally.
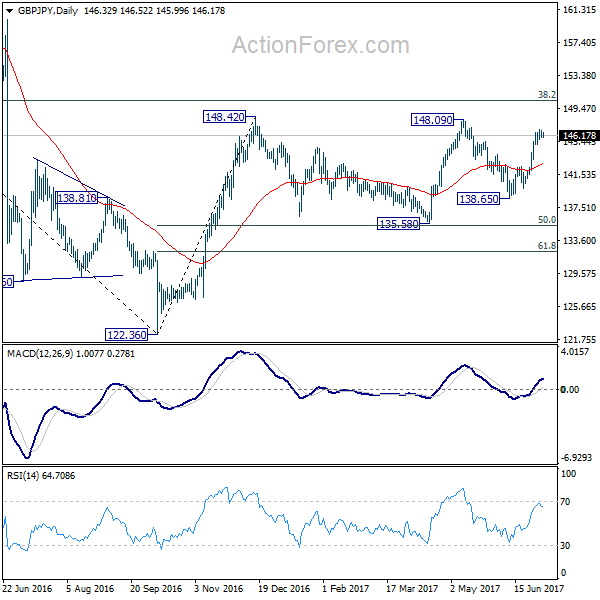
In the bigger picture, rise from medium term bottom at 122.36 is expected to continue to 38.2% retracement of 196.85 to 122.36 at 150.43. Decisive break there will carry long term bullish implications and pave the way to 61.8% retracement at 167.78. In case the sideway pattern from 148.42 extends, we'd be looking for strong support from 135.58 and 50% retracement of 122.36 to 148.42 at 135.39 to contain downside.
US Markets Reopen With FOMC Meeting In Focus
The US dollar was seen trading mixed yesterday. The US markets were closed on account of the Independence Day holiday. The greenback was seen trading stronger against most of its peers. The exception was the Canadian dollar which fell sharply after comments from the BoC Governor, Poloz. Mr. Poloz said that he expects inflation to be in an uptrend by the first half of 2018 and said that policy normalization would be required.
In the UK, the construction PMI data fell to 54.8 suggesting weaker growth momentum in the construction sector. Survey participants said that there was renewed risk aversion among clients.
Looking ahead, the FOMC meeting minutes will be the main event of the day alongside the US factory orders. In the UK, the services PMI will be released with expectations of a modest decline to 53.6 from 53.8 previously. In the Eurozone, the final services PMI data will be released.
EURUSD intraday analysis
EUR/USD(1.1356): The EURUSD extended the declines for three consecutive days after briefly breaking above the $1.1400 handle. Price action is currently seen consolidating near the 1.1357 level. Resistance is likely to be developed here which could push the currency pair towards 1.1300 in the near term. Below $1.1300, further declines could see EURUSD falling towards the support level at 1.1129. To the upside, considering the three day decline, if price action manages to stay supported above 1.1357, then we can expect some near-term gains back towards 1.1400 handle.
GBPUSD intraday analysis
GBPUSD (1.2932): The British pound continued the declines for a second day and closed below 1.2975. Any near-term gains could see price action testing 1.2975 region where resistance could be developed once again. If the resistance holds, GBPUSD could be seen settling lower in the near term with the support at 1.2800 coming into focus. The services PMI data could be the catalyst for GBPUSD to post the declines. Alternately, in the event that GBPUSD breaks above 1.2975, then we could expect further gains to be maintained in the currency pair.
AUDUSD intraday analysis
AUDUSD (0.7616): The Australian dollar posted strong declines yesterday. The Aussie gave up the gains following the RBA's monetary policy release. The central bank was seen coming down as dovish with references made to the Australian dollar's exchange rate. AUDUSD fell to lows of 0.7591 before closing the day at 0.7605. In the near term, price action could be seen testing the resistance level at 0.7624 with the potential to retest 0.7653 where the next minor resistance level exists. To the downside, expect AUDUSD to post declines towards the support level at 0.7514.