
Sample Category Title
Currencies: US Data To Help The Dollar
Sunrise Market Commentary
- Rates: Will the sell-off take a pause or will strong US data hit especially US bonds?
The US ISM could be stronger than expected today, but traders might be hesitant to react ahead of tomorrow's holiday. We do expect strong US labour market data later this week, which might give US Treasuries the lead in the global sell-off. German bonds face tough resistance. A sell-on-upticks might therefore be appropriate, unless a break occurs. - Currencies: US data to help the dollar
US data will be key this week. Today, the US manufacturing ISM is expected at a decent level. An upward surprise might restore confidence on the US recovery and on the dollar. If so, last week's EUR/USD top might become a first resistance.
The Sunrise Headlines
- US stocks closed Friday with slight gains (S&P 500 at +0.15%). Asian stock markets continue on this path as they also struggle to gain traction in early trading.
- Japanese PM Abe's Liberal Democratic Party suffered an historic defeat in an election in Tokyo (losing half of its seats), signalling trouble ahead for the Abe, who has suffered from slumping support because of a favouritism scandal.
- Japan's Tankan survey of business conditions at Japan's large manufacturers jumped to 17 in Q2 from 12 in Q1, besting a median forecast of 15. Business conditions also improved more than predicted for SME manufacturers
- The Japanese Nikkei-Markit PMI increased to 52.4 in June from 52 in May. Manufacturers upped their purchasing activity on new orders and higher production requirements. Employment rose too.
- The China Caixin-Markit manufacturing PMI rose to 50.4 in June after falling into contraction in May (49.6 in May, consensus of 49.8). Growth in output and new orders rose marginally, while employment continued to contract.
- China and Hong Kong have launched a bond trading link that allows foreign fund managers to trade in China's $9 trillion government, agency and corporate debt markets without the need for an onshore account.
- The eco-calendar's most interesting releases are the UK's manufacturing PMI, the US manufacturing ISM and the Eurozone unemployment rate
Currencies: US Data To Help The Dollar
US data to help the dollar?
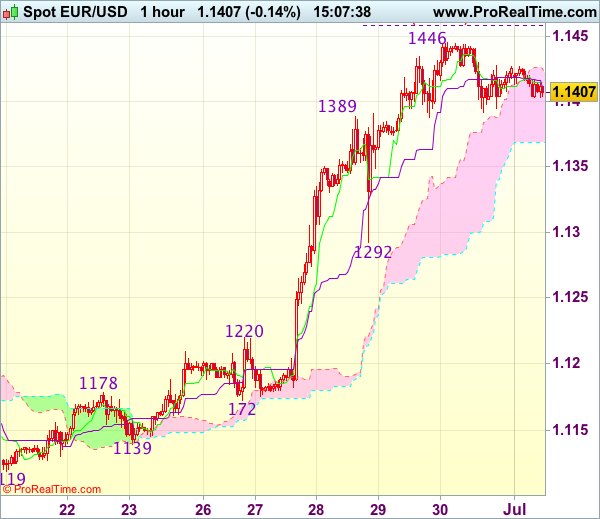
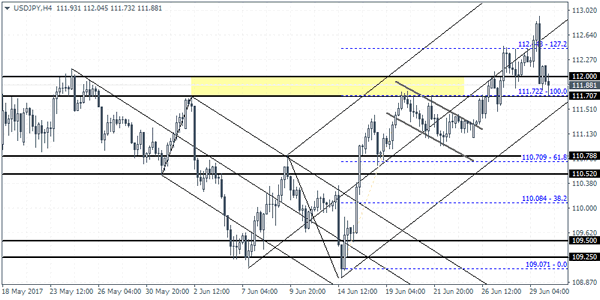
The strong three-day EUR/USD rally ran into resistance Friday, but there was also no real USD rebound. Yield differentials widened slightly in favour of the dollar. US equities outperformed European ones. EUR/USD closed at 1.1426 versus 1.1440 on Thursday. USD/JPY traded in a small band. The yen started strong, but USD/JPY closed with a small gain at 112.39 as US equities kept up well. Appetite to take additional positions was clearly missing, as it was the final the day of the quarter and as many US traders prepared for a long weekend with US markets closed for the 4th of July holiday tomorrow.
Overnight, Asian equities are trading mixed. The Japan Tankan business sentiment was stronger than expected (see headlines). The Caixin China manufacturing PMI also improved slightly. Decent regional data don't help the yen this morning. USD/JPY opened slightly in the red, but reversed the initial loss. A further rise in the oil price and a rise in US yields are supporting the dollar. USD/JPY trades in the 112.50 area. EUR/USD dropped slightly to the low 1.14 area and trades currently at 1.1415.
The attention turns this week to the US eco data. We expect an improvement after the lacklustre performance of late. EMU data are less important with today the final June manufacturing PMI and the unemployment rate. The US manufacturing ISM is expected to rise slightly, but we see risks to the upside of consensus. Further out this week the US labour market data will be of paramount interest. We see upward risks. The Minutes of the FOMC meeting might also be interesting to get a better take on the start of the balance sheet tapering and on the different value the Fed attributes to a strong labour market on the one hand and lower inflation on the other hand. The EMU data are less important, but after the bond sell off, it will be interesting whether ECB speakers will try to change market views on the outlook for policy.
In a daily perspective, we look out whether the US ISM might be strong enough to help a USD rebound against the euro. A decent report, which we expect, should help a topping out process after the recent EUR/USD rally. In case of good US labour data, we see also room for a re-widening of the USD/EMU interest rate differential as the recent rise in German/EMU yields was quite impressive. That said, the dollar remains vulnerable in case of a negative surprise. We start the week with a tentative USD-positive bias and look out whether last week's top in EUR/USD might become a more solid resistance. A decent US ISM and a constructive equity sentiment might also be a USD/JPY positive. However, it will be difficult to take out the recent top just below 113. For that to happen, as strong Payrolls report is probably needed.
Technical picture: USD looking for a bottom
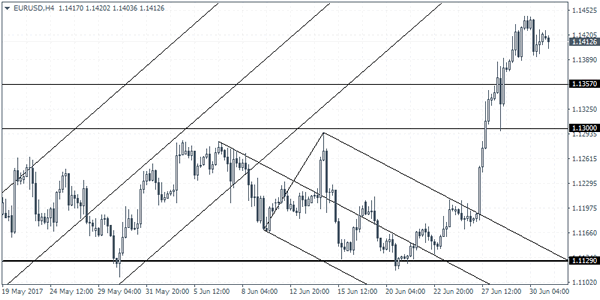
A combination of hawkish ECB comments and weaker US eco data pushed EUR/USD last week above the 1.1300/66 resistance area with a new high at 1.1448. The next resistance is now the 1.15 area. Further out LT correction tops are coming in at the 1.1616/1.1714. A break would end the long consolidation period that followed the sharp decline of EUR/USD in 2014/early 2015. Such a key area will be difficult to break for now. A drop below 1.1119 would suggest the pair enters calmer waters.
The USD/JPY rally ran into resistance in early May and the pair returned lower in the 108.13/114.37 range. The post-Fed USD rebound pushed the pair the 112.13 correction top early this week, but there were no real follow-through gains , So, the break isn't confirmed yet. A break would improve the ST-picture. Even so, were remain cautious on further USD/JPY gains.
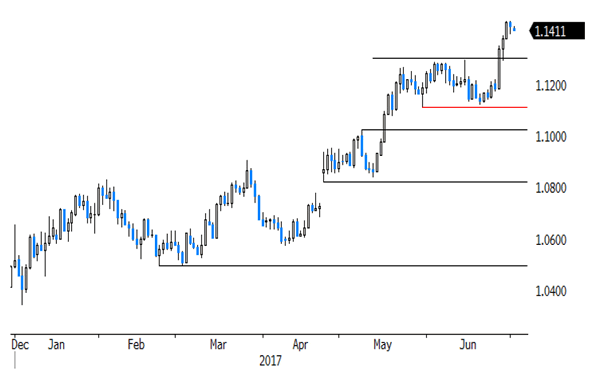
EUR/USD Will good US data support the dollar and cap the EUR/USD rally?
EUR/GBP
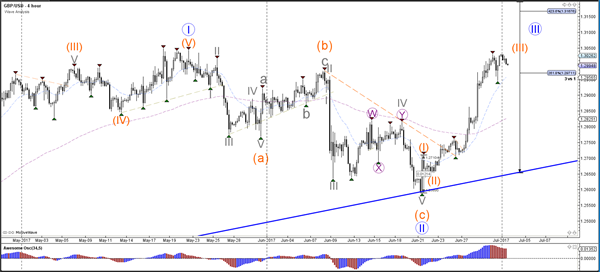
Sterling extends rebound
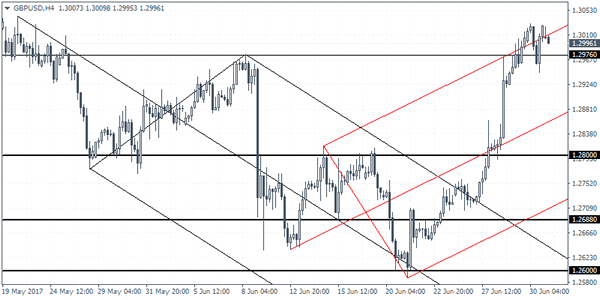
On Friday, cable approached key 1.3044 resistance in Asia, but a real test didn't occur, sending GBP/USD temporary lower again. UK data made no difference: Outdated Q1 GDP was confirmed at a weak 0.2% Q/Q. Trading in Cable and EUR/GBP was mostly technical in nature. Some sterling short-covering prevailed at the end of the month/quarter. EUR/GGBP closed the session at 0.8771 (from 0.876). Cable finished the day on a strong bid at 1.3030.
Today, the UK Manufacturing PMI is expected little changed at 56.3 from 56.7. This is still a healthy level and other UK data were not too bad of late. So, we assume that the report might be considered constructive in the markets. The past weakening of sterling is a positive for the UK manufacturing sector. So, the report might support a further technical comeback of sterling. The Brexit negotiations are on ongoing issue. Any progress on the rights of EU/UK citizens might suggested a less hard Brexit. All in all, we see EUR/GBP staying below the key resistance of 0.8866/80 and cable's fate will depend on EUR/USD. If the cross would move higher, cable may test the 1.3048 resistance but a break looks unlikely.
From a technical point of view, EUR/GBP set a minor top north of the 0.8854/66 resistance (2017 top), but a sustained break didn't occur. Recent setbacks will probably block further gains ST. A return below the 0.8655 correction low would indicate easing pressure on sterling. Such a break lower will be difficult. A EUR/GBP buy-on-dips approach remains favoured.
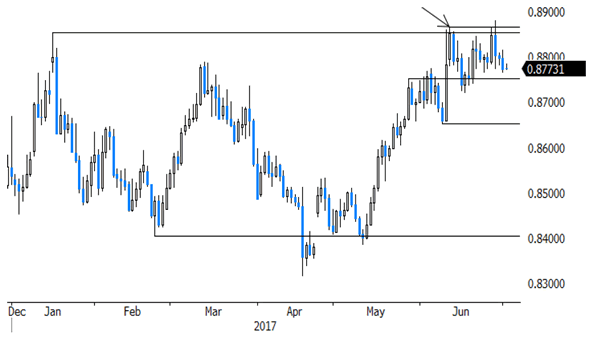
EUR/GBP topside test rejected. A modes/temporary sterling comeback might be on the cards
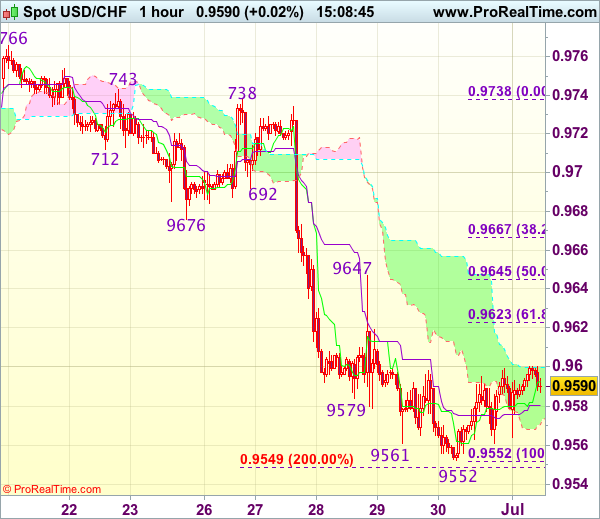
Trade Idea : USD/CHF – Sell at 0.9645
USD/CHF - 0.9595
Most recent candlesticks pattern : N/A
Trend : Near term down
Tenkan-Sen level : 0.9593
Kijun-Sen level : 0.9581
Ichimoku cloud top : 0.9600
Ichimoku cloud bottom : 0.9571
Original strategy :
Sell at 0.9645, Target: 0.9545, Stop: 0.9680
Position : -
Target : -
Stop : -
New strategy :
Sell at 0.9645, Target: 0.9545, Stop: 0.9680
Position : -
Target : -
Stop : -
Dollar’s recovery after falling to 0.9552 last week suggests minor consolidation would be seen and corrective bounce to 0.9620-25 (38.2% Fibonacci retracement of 0.9738-0.9552) is likely, however, reckon resistance at 0.9647 would limit upside and bring another decline later, below said support would signal recent decline from 0.9771 top is still in progress, hence further weakness to 0.9545-49 (2 times extension of 0.9771-0.9676 measuring from 0.9738) would follow but reckon downside would be limited to 0.9525-30 (50% projection of 1.10100-0.9613 measuring from 0.9771) and 0.9500 should hold, price should stay above 0.9470 (61.8% projection), bring rebound later.
In view of this, would not chase this fall here and we are looking to sell dollar on recovery as resistance at 0.9647 should limit upside. Only above previous support at 0.9676 (now resistance) would defer and suggest a temporary low is formed, risk test of another previous support at 0.9692.
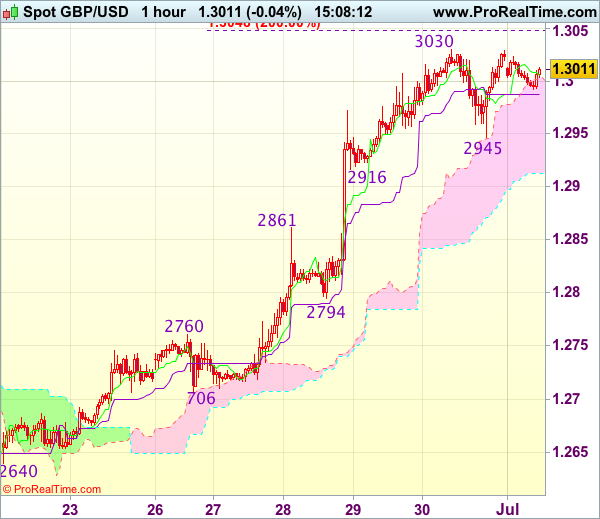
Trade Idea : GBP/USD – Buy at 1.2920
GBP/USD - 1.3013
Most recent candlesticks pattern : N/A
Trend : Near term up
Tenkan-Sen level : 1.3008
Kijun-Sen level : 1.2987
Ichimoku cloud top : 1.3003
Ichimoku cloud bottom : 1.2912
Original strategy :
Buy at 1.2920, Target: 1.3020, Stop: 1.2885
Position : -
Target : -
Stop : -
New strategy :
Buy at 1.2920, Target: 1.3020, Stop: 1.2885
Position : -
Target : -
Stop : -
As cable has maintained a firm undertone after last week’s rally, adding credence to our bullish view that recent upmove is still in progress and may extend further gain towards recent high 1.3048, however, loss of near term upward momentum should prevent sharp move beyond 1.3075-80 today and reckon 1.3100 would hold on first testing, risk from there has increased for a retreat to take place later.
In view of this, would not chase this rise here and we are looking to buy cable again on pullback as support at 1.2916 should limit downside and bring another rally. Below 1.2890-95 would defer and risk test of previous resistance at 1.2861, break there would suggest a temporary top is formed instead, risk weakness to 1.2830-35 but support at 1.2794 should remain intact.
Trade Idea : EUR/USD – Buy at 1.1330
EUR/USD - 1.1405
Most recent candlesticks pattern : N/A
Trend : Near term up
Tenkan-Sen level : 1.1413
Kijun-Sen level : 1.1411
Ichimoku cloud top : 1.1425
Ichimoku cloud bottom : 1.1369
Original strategy :
Buy at 1.1350, Target: 1.1450, Stop: 1.1315
Position : -
Target : -
Stop : -
New strategy :
Buy at 1.1330, Target: 1.1440, Stop: 1.1295
Position : -
Target : -
Stop : -
As the single currency met resistance at 1.1446 late last week and has eased, suggesting consolidation below this level would be seen and pullback to the lower Kumo (now at 1.1369) cannot be ruled out, however, reckon 1.1325-30 (38.2% Fibonacci retracement of 1.1139-1.1446) would limit downside and bring another rise later, above said resistance at 1.1446 would extend recent rise to 1.1455-60 (61.8% projection of 1.1119-1.1389 measuring from 1.1292), then 1.1480 but overbought condition should prevent sharp move beyond 1.1500, risk from there has increased for a retreat later.
In view of this, would not chase this rise here and would be prudent to buy euro on pullback as 1.1325-30 should limit upside. Below 1.1292 (previous support as well as 50% Fibonacci retracement of 1.1139-1.1446) would abort and signal a temporary top is formed, bring correction to 1.1255-60 later.
Greenback Looking To Open The Month On A Strong Note
The markets opened to a fresh trading month today with the US dollar likely attempting to consolidate some of the losses posted in the past couple of weeks. A number of high impact economic releases will no doubt keep the volatility alive in the markets. A busy day, the markets will be focusing on the manufacturing PMI numbers out of the Eurozone.
In the US the Institute of Supply Management (ISM) manufacturing PMI will kick off the week with expectations showing a modest increase from 54.9 previously to 55.0 last month. The UK manufacturing PMI data will also be closely watched especially after last week's hawkish rhetoric from central bankers.
EURUSD intraday analysis
EURUSD (1.1412): EURUSD rallied above 1.1400 on Friday, but price action was a bit bearish. We could expect to see some recovery to this momentum taking place with the previous high at 1.1297 likely coming in as support. However, there are minor support levels seen at 1.1357 and 1.1300 region. The pullback in EURUSD could into the high impact events such as the FOMC meeting minutes to name a few. In the near term, EURUSD could be seen consolidating above 1.1400 which will keep the bias to the upside. If price action breaks down below 1.1400, we can expect to see the declines push through towards 1.1300 - 1.1297 where support will most likely be tested. The risks of further downside could increase in the event of a break down below 1.1300 where we can expect EURUSD potentially falling towards 1.1129.
GBPUSD intraday analysis
GBPUSD (1.2996): GBPUSD rallied to close above 1.2975 technical level on Friday. Price action briefly tested the highs of 1.3000 as a result. Expect to see a pullback in prices in the near term if GBPUSD closes back below the 1.2975 level. In this case, expect the declines to see GBPUSD post a correction towards 1.2800 support level. A retest of this support will continue to see the bullish bias being maintained in the GBPUSD. However, if 1.2800 price level fails, then we can expect a decline in GBPUSD which will likely target 1.2688 support level to the downside. For the moment, on the 4- hour chart, we can see that there looks to be a near-term double top that was formed. Thus, watch for a break of the support at 1.2975 for the short-term decline to 1.2800.
USDJPY intraday analysis
USDJPY (111.88): USDJPY is looking to extend the gains from Friday after successfully closing above 112.00 price handle. This could see further near term gains being extended towards 113.36 which will mark the completion of the bullish flag pattern. So far, support has been formed at 111.70 region which has been tested. Price action will be required to break above the previous high of 112.81 following which the gains to 113.36 can be expected. Only in the unlikely event of a breakdown of support near 111.72 can we expect the downside bias to exist.
Trade Idea : USD/JPY – Hold short entered at 112.60
USD/JPY - 112.57
Most recent candlesticks pattern : N/A
Trend : Near term up
Tenkan-Sen level : 112.43
Kijun-Sen level : 112.23
Ichimoku cloud top : 112.33
Ichimoku cloud bottom : 112.14
Original strategy :
Sold at 112.60, Target: 111.60, Stop: 112.95
Position : - Short at 112.60
Target : - 111.60
Stop : - 112.95
New strategy :
Hold short entered at 112.60, Target: 111.60, Stop: 112.95
Position : - Short at 112.60
Target : - 111.60
Stop : - 112.95
Although the greenback opened lower earlier today, renewed buying interest emerged just below 112.00 and has rebounded again, suggesting further consolidation would be seen, however, as long as last week’s high at 112.93 holds, mild downside bias remains for another retreat, below 111.90-95 would bring test of indicated support at 111.73 but break there is needed to add credence to our view that a temporary top has been formed at 112.93, bring retracement of recent rise to 111.46 support first, then towards 111.15-20.
In view of this, we are holding on to our short position entered at 112.60. Only above said resistance at 112.93 would abort and confirm recent upmove has resumed for headway to 113.15-20 first, then towards 113.40-50.

Will The Greenback Recover The Week Ahead?
After posting the biggest quarterly declines since 2010 many investors are questioning whether the dollar will finally attract some bulls.
Although last week was quite with regards to the economic data releases, central bankers rattled global financial markets. Governors of the European Central Bank, Bank of England and Bank of Canada all sent similar signals indicating that the era of cheap money is getting closer to an end. Investors took the opportunity to adjust their position in FX markets by dumping the USD and sending the single currency to a 14-month high, the cable above 1.3, and the Canadian Lonnie to a multi-month high despite the fall in oil.
What seemed to be a coordinated action by monetary policy makers, the speeches impacted fixed income and equity markets heavily sending bond yields higher and stocks lower. Going forward I expect to see volatility returning during the process of normalization as monetary policies converge.
Fed Minutes
The Fed will release the minutes from its June 13-14 meeting on Wednesday. Most Fed speakers remained confident despite recent economic data falling short of expectations, especially that inflation continued to undershoot the 2% target. This led to the divergence in interest rates expectations as most market participants believe that four rate hikes along with the reduction in the Fed’s balance sheet is far from reach. I believe that the Fed statement will sound more cautious than Chair Janet Yellen’s press conference on June 14 as some Fed members might show different opinions in the economy’s strength, leading to continued weakness in the USD.
NFP
Friday’s non-farm payrolls report is of more importance I believe and will be a critical test to the USD. The charts are already showing oversold signals on the USD but this requires a fundamental catalyst to convince the bulls to return. The 138,000 jobs added to the economy in May came sharply below the expected 185,000. Wage growth also disappointed with average earnings rising 2.5% annually. If the jobs report managed to surprise to the upside this time, the USD will likely find a near-term bottom. However, the headline figure won’t be enough even if it came above 180,000. Wage growth is what’s needed to narrow the disparities between the Fed’s dot plot and the markets own dot plot.
U.S. manufacturing and service reports
Manufacturing data from the U.S. and other major economies are also on the calendar the week ahead. U.S. durable goods dropped 1.1% in May as new orders fell unexpectedly. The report added to the growing concerns that manufacturing in the U.S. might not be moving in the right direction. Although Monday’s ISM Manufacturing report isn’t considered a tier one release, I think at this stage it’s important to monitor all data coming out from the U.S. ISM Non-Manufacturing PMI will follow on Thursday with an expectation to drop slightly from 56.9 to 56.6.
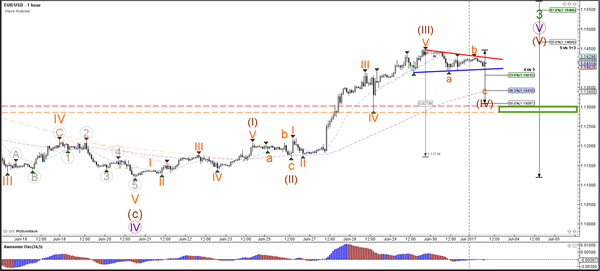
Daily Technical Analysis: EUR/USD Builds Wave 4 Correction With Strong Support Zone
Currency pair EUR/USD
The EUR/USD break above resistance (dotted lines) is showing strong bullish momentum. Price is approaching Fibonacci targets of wave 5 (purple) which could complete wave 3 (green).
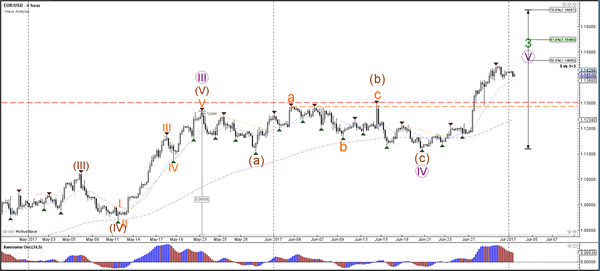
The EUR/USD is building a triangle correction (red/blue lines) within a wave 4 (brown). The Fibonacci levels of wave 4 vs 3 could act as potential support levels. A break above the resistance could start wave 5 (brown) whereas a break below the support (green) makes a wave 4 less likely.
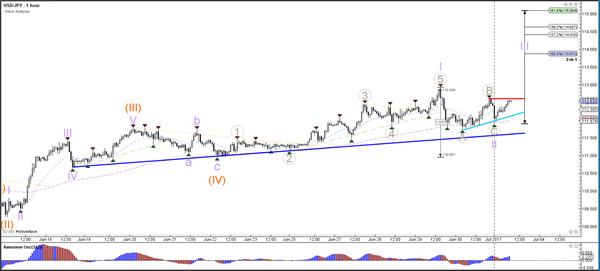
Currency pair USD/JPY
The USD/JPY is in a bullish trend channel which is indicated by the support (blue) and resistance (red) trend lines. A break above the channel could see a wave 3 (purple) develop within a larger wave C (brown) zigzag.
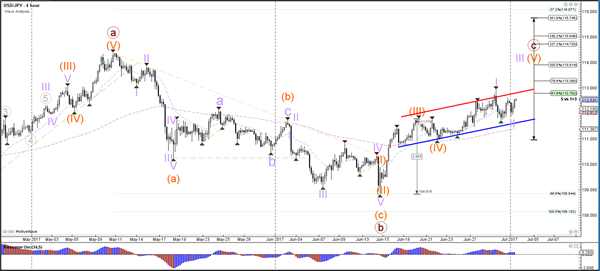
The USD/JPY potential break above the resistance (red) and top could indicate a wave 3 (purple) continuation.
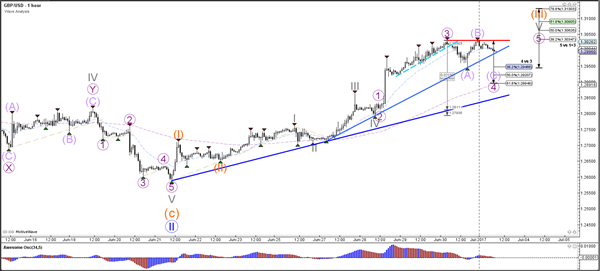
Currency pair GBP/USD
The GBP/USD is showing strong bullish momentum as price approaches the 1.30 round level resistance, which could be explained by a wave 3 (orange/blue) impulse.
The GBP/USD is building a correction within a potential wave 4 (purple). A bullish continuation could complete wave 4 and 5 (purple) within wave 3 (orange).
NZD Poised For Further Upsides This Week
Key Points:
- Momentum is slowing but may not be exhausted yet.
- The GDT Price Index could keep the bulls in play.
- Technical readings remain bullish, albeit to a lesser degree than last week.
The NZDUSD has been making remarkable progress over the past few weeks and the pair is now seeking fresh highs. Indeed, it looks as though the Kiwi Dollar is well on the way to reaching the 0.7374 mark – potentially inside of a week. As a result, it may be worth taking a closer look at what has been fuelling the pair recently and what could help to keep it bullish moving forward. Additionally, we might need to look at the technical bias and what this suggests is next on the cards.
The Kiwi Dollar continued to build on recent gains last week, reaching the 0.7329 handle by the close of trading on Friday. Much of this momentum stemmed from the technical bias which was quite bullish overall. However, the bulls were helped out by the broader swing against the USD resulting from the continued political turmoil in the US. Additionally, numerous NZ economic data releases came in better than anticipated. In particular, the ANZ Business Confidence and Building Consents Figures shot up to 24.8 and 7.0% respectively which saw sentiment remain with the pair throughout the week – even if the two releases were downed out on Thursday by the US GDP numbers.
As for the days ahead, it is yet another light week on the NZ news front but the GDT Price Index could prove to be particularly impactful this time around. This is largely due to the fact that its posting happens to fall on July 4th– a US public holiday – which means there is no American data to offset the dairy numbers. As a result, a solid uptick in the GDT figure could prove to be the spark needed to get the Kiwi Dollar to hit a high for the year at around 0.7374. As for the rest of the week, the US NFP data and the FOMC meeting minutes are likely to be the key risk events to watch for.
Moving on to the technical bias, the Kiwi Dollar remains rather bullish but becoming overbought will certainly see headwinds increasing moving ahead. Specifically, the bullish EMA and Parabolic SAR readings may no longer be enough to fuel the uptrend as both the RSI and stochastics have now moved into overbought territory. Additionally, the NZD may struggle to gain traction in the coming days as it is fast approaching fresh highs for 2017 which may be causing some of the bulls to spook.
Overall, expect further gains but resistance will be in place at the 0.7345, 0.7374, and 0.7454 levels. Conversely, support will be seen at the 0.7298, 0.7243, and 0.7194 levels.
EUR/USD Has Stabilised Above The 1.14 Level
Market movers today
Today, the June manufacturing PMI figures for Norway, Sweden, the euro area (including Spain and Italy), the UK and the US are due out .
The unemployment rate for the euro area in May is also due out today and we estimate it stayed at 9.3%. It is st ill our view that the unemployment rate will continue to fall this year as the economic recovery continues.
In the US, we estimate ISM manufacturing fell to 54.0 in June but regional PMIs and Markit PMI have pointed in different direct ions (an increase and a fall, respectively).
Tomorrow in Sweden, we expect the Riksbank to stay on hold but remove its small cut probability in the updated rate path.
Selected market news
Caixin China manufacturing PMI rose to 50.4 in June from 49.6 in May. Hence, the index is now signalling a slight expansion rather than a slight contract ion in Chinese manufacturing. It was somewhat bet ter than expected by consensus. The copper price rose on the news.
In Japan, the quarterly manufacturing business confidence survey released this morning showed t hat Japan's manufacturers are t heir most positive since 2014. This improvement was in line with consensus. Consequent ly, the market react ion to the data release was muted.
The recent rally in EUR/USD found additional justification on Friday from stronger euro area core inflation and weaker US PCE core inflation. In the euro area, core inflation rose to 1.1% y/y, while in the US it dropped to 1.4% y/y. EUR/USD has stabilised above the 1.14 level.
Oil prices Friday found support in the news that the number of oil rigs in the US dropped by two. This is the first sign so far of US crude oil producers reacting negatively to the recent slide in oil prices.
Dry weather in the US and Europe has been a cause for concern recently in the world wheat market . On Friday, a report from USDA added to those concerns, providing additional fuel to the recent rally in world grain prices. Overall, world food prices are up about 10% since the beginning of May – something that could also potentially come to the attention of major global central banks if it starts to pass through to inflation.