Sample Category Title
EUR/AUD Daily Outlook
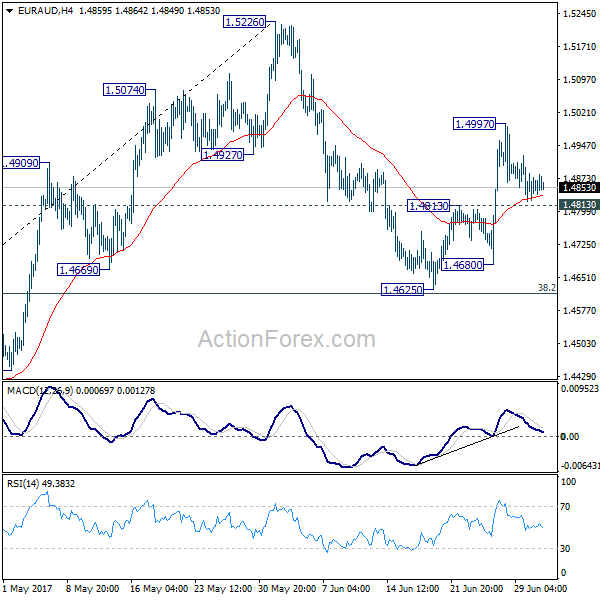
Daily Pivots: (S1) 1.4817; (P) 1.4858; (R1) 1.4895; More...
Intraday bias in EUR/AUD remains neutral for the moment. With 1.4813 minor support intact, holds, we're favoring the bullish case that pull back from 1.5226 has completed at 1.4625, ahead of 38.2% retracement of 1.3624 to 1.5226 at 1.4614. Above 1.4997 will turn bias back to the upside for 1.5226 first. However, break of 1.4813 will dampen this view and turn bias back to the downside for 1.4625 support.
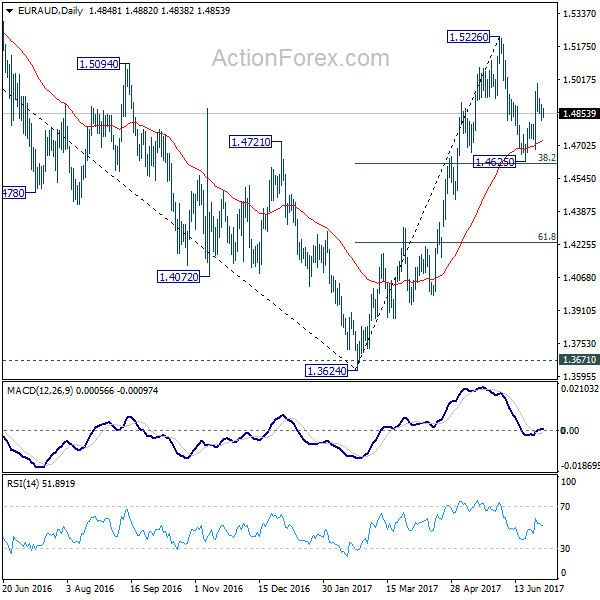
In the bigger picture, price actions from 1.6587 medium term top are viewed as a corrective pattern. Such correction should be completed at 1.3624 after defending 1.3671 key support. Rise from 1.3642 would extend to 61.8% retracement of 1.6587 to 1.3624 at 1.5455. Sustained break there will pave the way to retest 1.6587. However, sustained break of 1.4669 support will dampen this bullish view. We'll assess the outlook later after looking at the structure and depth of the pull back.
Technical Outlook: AUDUSD – Reversal Signal Is Forming On Daily Chart
The Aussie dollar is in red on Monday as reversal signal is forming following strong upside rejection at over three-month high at 0.7712 on Friday.
Bearish signals are also coming from daily RSI / slow stochastic, which reversed from overbought territory.
Fresh weakness penetrated into thick hourly cloud and pressuring pivotal support at 0.7645 (hourly cloud base / Fibo 38.2% of 0.7353/0.7712), loss of which could trigger deeper pullback towards 0.7623 (daily Tenkan-sen) and 0.7605 (Fibo 61.8% / 10SMA), where correction should find support to keep larger bulls intact.
Today's close in red is needed to confirm scenario
Res: 0.7678, 0.7697, 0.7712, 0.7734
Sup: 0.7650, 0.7623, 0.7605, 0.7582
Technical Outlook: USDJPY – Fresh Bulls Pressure 113.00 Barrier
The pair is in fresh rally from 112.00 zone on Monday and pressuring again 113.00 barrier where last week's attack was strongly rejected.
Thickening daily cloud contained last week's choppy trading and continues to underpin the action along with 10/100SMA bull-cross, for final break of 113.00 zone and continuation of broader uptrend from 108.80 (14 June low).
Friday's close above 112.24 (Fibo 61.8% of 114.36/108.80) was strong bullish signal.
However, the pair may hold in extended consolidation between 112.00 and 113.00 range on repeated failure at 113.00 pivot.
Alternative scenario requires break below 112.00 handle (daily Tenkan-sen) and violation of daily cloud top (111.80) to shift near-term bias lower.
Res: 112.94, 113.05, 113.50, 113.95
Sup: 112.45, 112.00, 111.80, 111.37
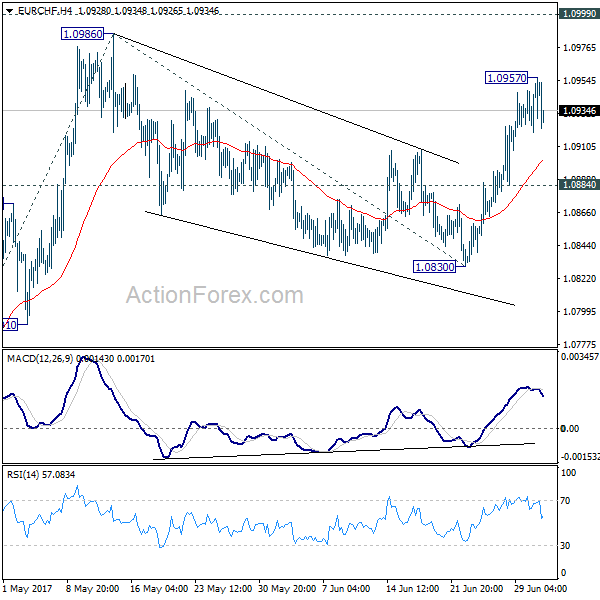
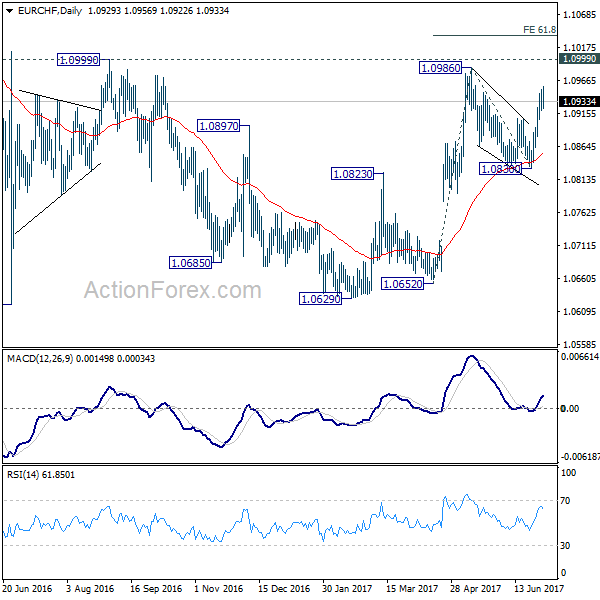
EUR/CHF Daily Outlook
Daily Pivots: (S1) 1.0928; (P) 1.0940; (R1) 1.0961; More...
A temporary top is in place at 1.0957 in EUR/CHF with 4 hour MACD crossed below signal line. Intraday bias is turned neutral first. Downside of retreat should be contained by 1.0884 minor support to bring another rally. Rise from 1.0629 should be resuming. Above 1.0957 will send EUR/CHF through 1.0986/0999 resistance zone to 61.8% projection of 1.0652 to 1.0986 from 1.0830 at 1.1036.
In the bigger picture, the price actions from 1.1198 are seen as a corrective move. Such correction could have completed after defending 38.2% retracement of 0.9771 to 1.1198 at 1.0653. Decisive break of 1.0999 resistance will target a test on 1.1198 high. For now, this will be the preferred case as long as 1.0830 support holds.
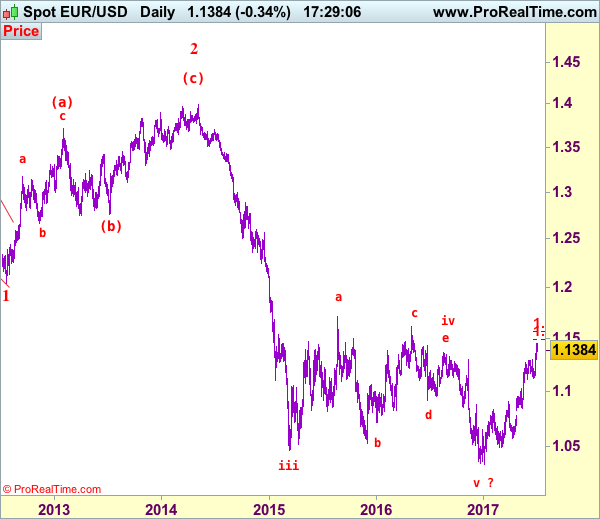
EUR/USD Elliott Wave Analysis
EUR/USD – 1.1381
EUR/USD: Wave (c) of 2 ended at 1.3993 and wave 3 of III has commenced for weakness to 1.0411 (1.236 of wave 1), then 1.0000.
Last week’s rally above previous resistance at 1.1296 (now support), adding credence to our bullish view that the upmove from 1.0340 low is still in progress and may extend further gain to 1.1480-85 (50% projection of 1.0570-1.1296 measuring from 1.11190, then towards 1.1565-70 (61.8% projection), however, loss of upward momentum should prevent further sharp move and minor wave v is likely to be limited to previous chart resistance at 1.1616, risk from there is seen for a retreat later.
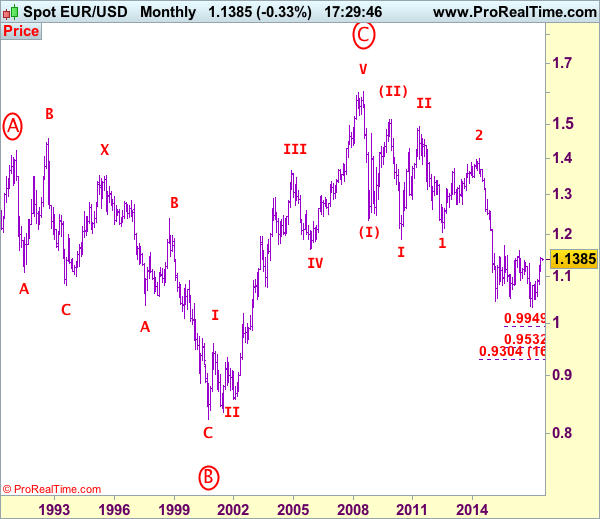
Our preferred count on the daily chart remains that a wave (II) from 1.2329 ended at 1.5145 with A-leg ended at 1.4720, followed by wave B at 1.2457, the wave C from there was also a 3 legged move and is labeled as (a): 1.3739, (b): 1.2885, the wave iii of the 5-waver (c) from 1.2885 has ended at 1.4339 and wave iv is a triangle ended at 1.3878 and wave v formed a top at 1.5145. The decline from there is a 5-waver (C) with minor wave (i) of I of (C) ended at 1.4218 with wave (ii) ended at 1.4580, wave (iii) ended at 1.3267 and wave (iv) ended at 1.3692 and wave (v) ended at 1.1876, this is also the low of wave I of (C) and wave II ended at 1.4940, hence wave III is now in progress with a diagonal wave 1 ended at 1.2042, the breach of previous support at 1.1876 (wave I trough) adds credence to our view that the wave 2 has ended at 1.3993, wave 3 has commenced for further weakness to 1.0411, then towards 1.0000.
On the downside, whilst initial pullback towards said previous resistance at 1.1296 cannot be ruled out, reckon downside would be limited to 1.1200-10 and bring another rise later. Below 1.1170-75 would defer and risk test of support at 1.1109-19, however, a daily close below there is needed to signal a temporary top is formed instead, bring correction of recent upmove to previous resistance at 1.1025 but only a firm break below there would provide confirmation, bring further fall to 1.0975.
Recommendation: Buy at 1.1200 for 1.1400 with stop below 1.1100
Euro's long-term uptrend started from 0.8228 (26 Oct 2000) with an impulsive structure. The rise from 0.8228 to 0.9593 (5 Jan 2001) is labeled as wave I, the retreat to 0.8352 (6 Jul 2001) is wave II and the rally to 1.3670 (31 Dec 2004) is wave III. Wave IV from there ended at 1.1640 (15 Nov 2005), the subsequent upmove to 1.6040 (July 15, 2008) is treated as wave V, the major selloff from the record high of 1.6040 to 1.2329 (October 27, 2008) signals a reversal has taken place with (I) leg ended at 1.2329 and once (II) ended at 1.5145, wave (III) itself is an extended move with I: 1.1876 and complex wave II ended at 1.4902, wave III has commenced with wave 1 and 2 ended at 1.2042 and 1.3993 respectively, wave 3 of III is now unfolding for weakness towards parity.
USD: Biggest Quarterly Drop In Almost 7 Years
USD recovered marginally on Friday, but had its biggest quarterly decline against several currencies in nearly 7 years following hawkish signals from many central banks last week that put additional downward pressure on USD.
The markets had higher expectations of tighter monetary policies following various comments from officers at the European Central Bank, Bank of England and the Bank of Canada. Current US economic data is adding further doubts as to the likelihood that the Federal Reserve will be able to increase interest rates further this year, which further adds to USD being less attractive to investors.
The Dollar Index declined approximately 4.6% in the second quarter – the largest quarterly decline since Q3 2010. On Friday, the Dollar Index closed at 95.638 a 0.1% increase on the day. Currently the index is trading at 95.76
EURUSD gained more than 7% in the quarter – it's largest quarterly increase since Q3 2010. EURUSD reached levels last week not seen since last year's Brexit vote trading up to 1.14445 – fueled by expectations that the ECB will move away from its 'ultra-easy' monetary policy. Currently EURUSD is trading just above 1.1400.
GBPUSD continued to show strength after breaking 1.3000 last week to trade as high as 1.30291 on Friday. For the second quarter GBPUSD was up nearly 3.5%. Currently GBPUSD is trading just below 1.3000 with traders awaiting this morning's PMI report for further guidance.
USDJPY ended the week with a small 0.2% loss to close at 112.38. JPY briefly gained on concerns that Japanese PM Shinzo Abe's reflationary policies may suffer following the weekend defeat of his Liberal Democrat Party defeat in local elections – although this was a short lived as USDJPY is currently trading above 112.50.
Gold experienced its first monthly decline of the year to close on Friday at $1,242 (which is down $15 from last weeks close). Gold has slipped further over the weekend to currently trade just below $1,237.
WTI rose approximately 2.8% on Friday to close at $46.35pb. Oil gained more than 5 % on the week, helped by government data showing a drop in U.S. gasoline supplies that had remained high at the start of the summer driving season. However, Oil prices are down 15% this year – marking Oil's worst H1 performance in 19 years. The markets will now be looking to see if the typical summer demand helps bolster prices. WTI is currently trading round $46.35pb with Brent trading just below $49.00pb.
This week will be somewhat 'condensed' with the July 4th holiday tomorrow. Markets will be looking for more indications as to the 'state' of the US economy with Employment Data, Unemployment and, the always volatile, Non-Farm Payroll report all due out later this week. Today, at 9:30 BST sees the UK's Markit Manufacturing PMI released. The figure is expected to show a slight decrease to 56.4 from the previous release of 56.7. At 15:00 BST, ISM Manufacturing PMI for June be released. Expectations call for a figure of 55.0 (previously 54.9), at the same time ISM Prices Paid for June will be released, with the market expecting a figure of 58.8, slightly below the previous 60.5.
USD/JPY Elliott Wave Analysis
USD/JPY - 112.86
USD/JPY – Wave V of larger degree circle V has possibly ended at 75.31 and major correction has commenced and already met indicated target at 125.00.
Although the greenback has risen again after brief pullback on cross-selling in yen and initial mild upside risk remains for marginal gain from here, as this move is viewed as retracement of the fall from 114.39, reckon upside would be limited to 113.00-10 and bring retreat later. Below 111.70-75 would bring weakness to 111.00, however, break of 110.95 support is needed to signal top is formed, bring further fall to 110.35 and possibly towards 110.00 but reckon downside would be limited to 109.50-60 and indicated support at 108.82 would continue to hold, bring another rebound later.
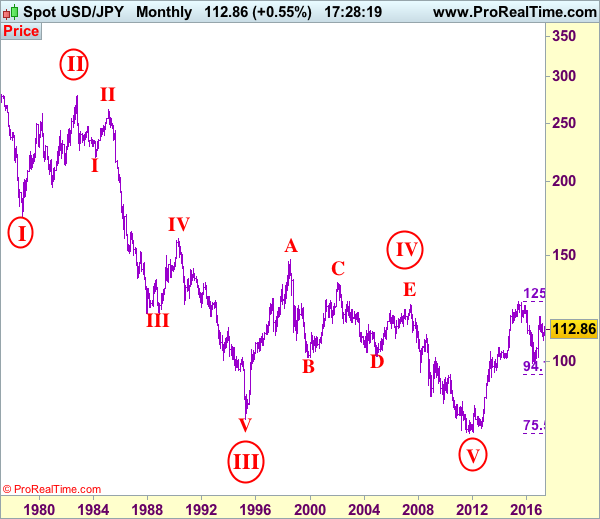
Our preferred count is that, triangle wave IV (with circle) ended at 101.45 and the circle wave V brought dollar down to the record low of 75.31 in 2011 and the subsequent rebound signal major correction has commenced with A leg ended at 84.19, followed by wave B at 77.14 and impulsive wave C is now unfolding (indicated upside target at 125.00 had been met) for gain towards 127.00 level. In the event dollar drops below support at 99.01, this would confirm medium term decline from 125.86 top (2015 high) has resumed for subsequent weakness to 98.00 and possibly 97.00.
Under this count, this wave C is unfolding as impulsive waves with (1) (2), 1 2 ended at 80.67, 79.07, 82.84 and 81.69 respectively, hence the extended wave 3 has ended at 103.74 and wave 4 correction of recent upmove should bring weakness to 92.57, then towards 90.88 but psychological support at 90.00 should limit downside and bring another rally later in wave 5, indicated target at 125.00 had been met and gain to 127.00 cannot be ruled out but reckon price would falter below 130.00.
On the upside, whilst initial marginal gain from here cannot be ruled out, reckon upside would be limited to previous support at 113.12, bring another decline later. A daily close above this level would abort and suggest the fall from 114.39 has ended, risk further gain to 113.85-90, however, said resistance at 114.39 should remain intact, bring another decline later.
Recommendation: Hold short entered at 112.50 for 110.50 with stop above 113.50.

On the monthly chart, we have changed our preferred count that an impulsive wave is unfolding with major wave III with circle ended at 79.75, then followed by wave IV with circle and is labeled as a triangle with A: 147.64 (11 August, 1998), B: 101.25, C: 135.20, D: 101.67 and E leg ended at 124.14 to end the wave IV with circle. Hence, wave V with circle commenced from there and hit a record low of 75.31, however, the subsequent strong rebound signals this circle wave V has possibly ended there, hence gain to (indicated upside target at 122.00 and 125.00 had been met), the retreat from 125.86 suggests wave A of major correction has ended there and wave B correction back to 99.00, then 95.00 would be seen, however, reckon downside would be limited to 90.00, bring another rebound in wave C next year.
GOLD Strong Bearish Momentum, SILVER Weakening, CRUDE OIL Pushing Lower.
GOLD Strong bearish momentum.
Gold's is trading lower. The commodity has broken hourly support located at 1236 (26/06/2017 low). Stronger support is given at 1214 (09/05/2017 low). Hourly resistance can be found at 1258 (23/06/2017 high). Expected to show renewed bullish pressures.
In the long-term, the technical structure suggests that there is a growing upside momentum. A break of 1392 (17/03/2014) is necessary ton confirm it, A major support can be found at 1045 (05/02/2010 low).
SILVER Weakening.
Silver's bullish bounce quickly faded. Closest support is given at 16.29 (26/06/2017 low). Strong support is given at 16.06 (09/05/2017 low). Key resistance is given at a distance at 17.75 (06/06/2017 high). The road seems wide open for further decline.
In the long-term, the death cross indicates that further downsides are very likely. Resistance is located at 25.11 (28/08/2013 high). Strong support can be found at 11.75 (20/04/2009).
CRUDE OIL Pushing lower.
Crude oil is now consolidating higher since the commodity hit 11-month low towards resistance at 46.71 (12/06/2017 high). Support is given at 42.05 (21/06/2017 low). Expected to show renewed weakness.
In the long-term, crude oil has recovered after its sharp decline last year. However, we consider that further weakness are very likely. Strong support lies at 35.24 (05/04/2016) while resistance can now be found at 55.24 (03/01/2017 high).
EUR/JPY Bullish Consolidation, EUR/GBP Slight Weakness, EUR/CHF Recovery Gains Strength.
EUR/JPY Bullish consolidation.
EUR/JPY is now consolidating after its recent rally. Key resistance is located at 128.83 (30/06/2017). Hourly support can be found at 127.10 (30/06/2017). Next support is given at 122.56 (18/05/2017 low). Further upside is favored.
In the longer term, the technical structure validates a medium-term succession of lower highs and lower lows. As a result, the resistance at 149.78 (08/12/2014 high) has likely marked the end of the rise that started in July 2012. Strong support at 94.12 (24/07/2012 low) looks nonetheless far away.
EUR/GBP Slight weakness.
EUR/GBP has broken downtrend resistance triggering a move towards 1.0987. Hourly support can be located at Support can be found at 0.8652 (08/06/2017 low). Expected to show further consolidation.
In the long-term, the pair has largely recovered from recent lows in 2015. The technical structure suggests a growing upside momentum. The pair is trading above from its 200 DMA. Strong resistance can be found at 0.9500 psychological level.
EUR/CHF Recovery gains strength.
EUR/CHF's short-term bullish pressures are definitely on after clear break of downtrend channel. Hourly support is located at a distance at 1.0792 (03/05/2017 low) while the pair is heading towards resistance given at 1.0987 (12/05/2017 high).
In the longer term, the technical structure is mixed. Resistance can be found at 1.1200 (04/02/2015 high). Yet,the ECB's QE programme is likely to cause persistent selling pressures on the euro, which should weigh on EUR/CHF. Supports can be found at 1.0184 (28/01/2015 low) and 1.0082 (27/01/2015 low).
USD/CHF Bullish Consolidation, USD/CAD Bearish Breakout, AUD/USD Consolidating.
USD/CHF Bullish consolidation.
USD/CHF remains weak as long as prices remain below the key resistance at 0.9647 (28/06/2017 high). Hourly resistance can be found at 0.9771 (09/06/2017 high). Strong resistance is given at 1.0107 (10/04/2017 high). Hourly support is given at 0.9553 (intraday low). Expected to show continued bearish pressures.
In the long-term, the pair is still trading in range since 2011 despite some turmoil when the SNB unpegged the CHF. Key support can be found 0.8986 (30/01/2015 low). The technical structure favours nonetheless a long term bullish bias since the unpeg in January 2015.
USD/CAD Bearish breakout.
USD/CAD is way into bearish mode. Strong support given at 1.2969 (31/01/2017 low) has been broken. Resistance is located at 1.3010 (02/15/2017). Expected to show continued downside pressures.
In the longer term, the pair lies in a bullish channel since a year. Strong resistance is given at 1.4690 (22/01/2016 high). Long-term support can be found at 1.2461 (16/03/2015 low).
AUD/USD Consolidating.
AUD/USD's technical structure is bullish since early May. Recovery bounce near former resistance at 0.7636 is gaining momentum. The pair is heading towards strong resistance at 0.7750 (21/03/2017 high).
In the long-term, we are waiting for further signs that the current downtrend is ending. Key supports stand at 0.6009 (31/10/2008 low) . A break of the key resistance at 0.8295 (15/01/2015 high) is needed to invalidate our long-term bearish view.