Sample Category Title
EUR/USD Elliott Wave Analysis
EUR/USD – 1.1195
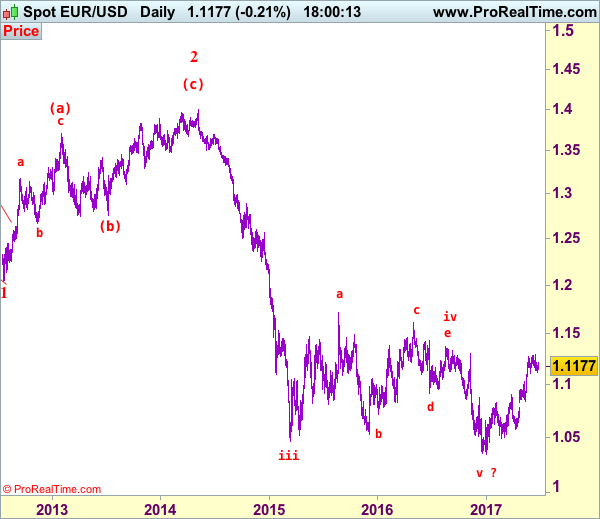
EUR/USD: Wave (c) of 2 ended at 1.3993 and wave 3 of III has commenced for weakness to 1.0411 (1.236 of wave 1), then 1.0000.
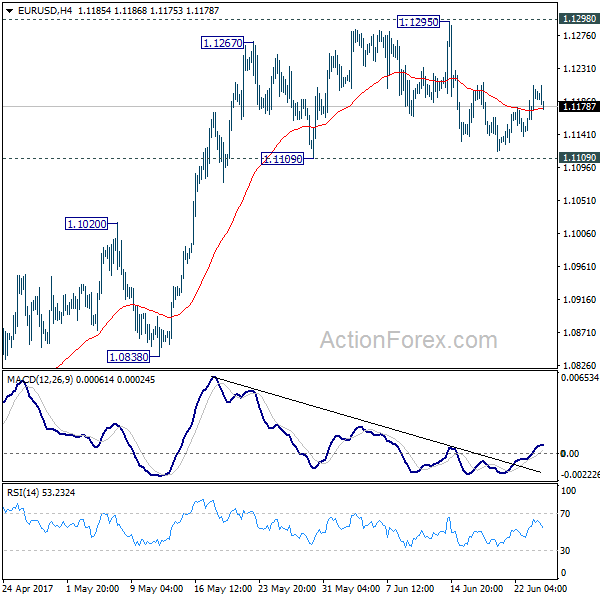
As the single currency has retreated after rising marginally to 1.1296, retaining our view that consolidation below this level would be seen and test of 1.1109-19 support cannot be ruled out, however, a daily close below there is needed to signal a temporary top has been formed, bring retracement of recent upmove to previous resistance at 1.1025 but only a firm break below there would provide confirmation, bring retracement of recent rise to 1.0975-80, having said that, downside should be limited to 1.0900 and support at 1.0839 would remain intact, bring rebound later.
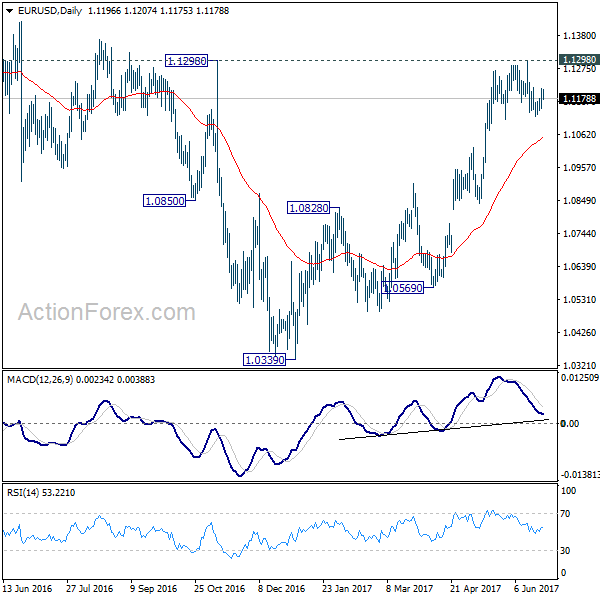
Our preferred count on the daily chart remains that a wave (II) from 1.2329 ended at 1.5145 with A-leg ended at 1.4720, followed by wave B at 1.2457, the wave C from there was also a 3 legged move and is labeled as (a): 1.3739, (b): 1.2885, the wave iii of the 5-waver (c) from 1.2885 has ended at 1.4339 and wave iv is a triangle ended at 1.3878 and wave v formed a top at 1.5145. The decline from there is a 5-waver (C) with minor wave (i) of I of (C) ended at 1.4218 with wave (ii) ended at 1.4580, wave (iii) ended at 1.3267 and wave (iv) ended at 1.3692 and wave (v) ended at 1.1876, this is also the low of wave I of (C) and wave II ended at 1.4940, hence wave III is now in progress with a diagonal wave 1 ended at 1.2042, the breach of previous support at 1.1876 (wave I trough) adds credence to our view that the wave 2 has ended at 1.3993, wave 3 has commenced for further weakness to 1.0411, then towards 1.0000.
On the upside, whilst initial recovery to 1.1240-50 cannot be ruled out, said resistance at 1.1296 should hold and bring another retreat later. Above 1.1296-00 would signal recent upmove from 1.0340 low is still in progress for headway to another previous resistance at 1.1366, however, near term overbought condition should prevent sharp move beyond 1.1430-35 and price should falter below 1.1500, bring retreat later.
Recommendation: Stand aside for this week
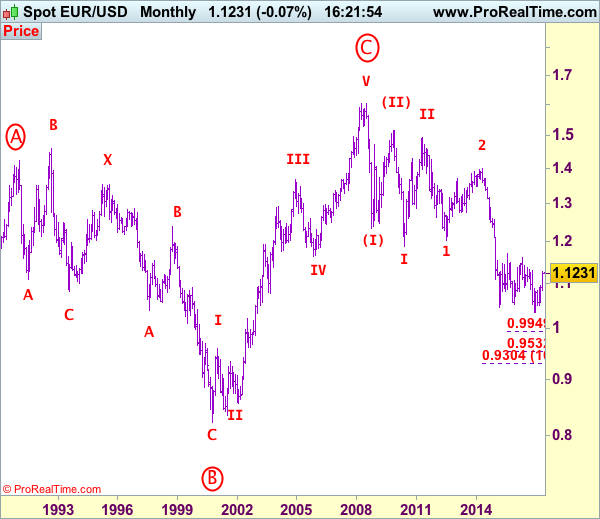
Euro's long-term uptrend started from 0.8228 (26 Oct 2000) with an impulsive structure. The rise from 0.8228 to 0.9593 (5 Jan 2001) is labeled as wave I, the retreat to 0.8352 (6 Jul 2001) is wave II and the rally to 1.3670 (31 Dec 2004) is wave III. Wave IV from there ended at 1.1640 (15 Nov 2005), the subsequent upmove to 1.6040 (July 15, 2008) is treated as wave V, the major selloff from the record high of 1.6040 to 1.2329 (October 27, 2008) signals a reversal has taken place with (I) leg ended at 1.2329 and once (II) ended at 1.5145, wave (III) itself is an extended move with I: 1.1876 and complex wave II ended at 1.4902, wave III has commenced with wave 1 and 2 ended at 1.2042 and 1.3993 respectively, wave 3 of III is now unfolding for weakness towards parity.
AUD/USD Daily Outlook
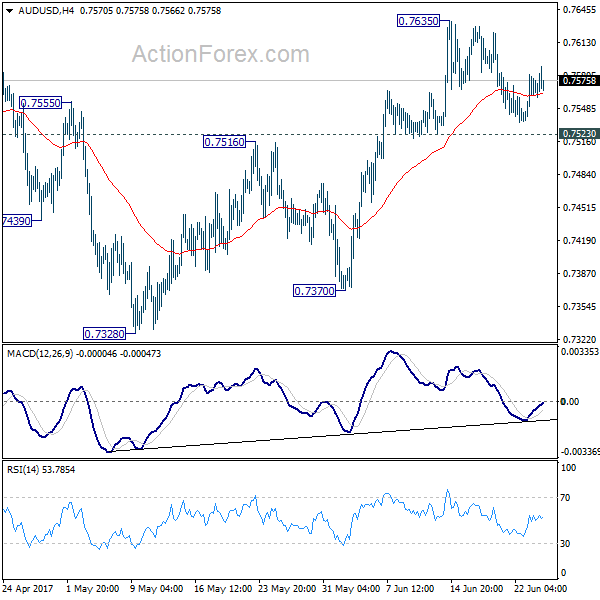
Daily Pivots: (S1) 0.7542; (P) 0.7562; (R1) 0.7588; More....
AUD/USD is staying in consolidation from 0.7635 and intraday bias remains neutral. With 0.7523 intact, further rise is expected. Break of 0.7635 will extend the rise from 0.7328 to 0.7748 resistance and above. At this point, there is no clear sign of range breakout at. Hence, we'd be cautious on topping again as it approaches medium term fibonacci level at 0.7849. Meanwhile, break of 0.7523 will argue that rebound from 0.7328 is possibly completed. In that case, intraday bias will be turned back to the downside for 0.7370 support.
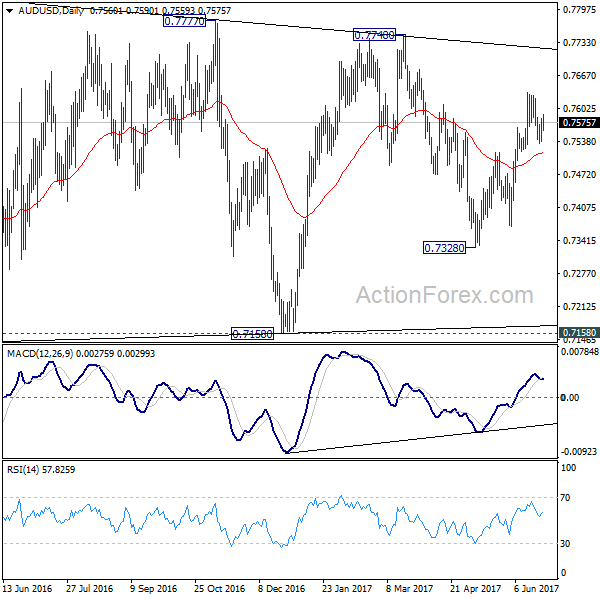
In the bigger picture, we're still treating price actions from 0.6826 low as a corrective pattern. And, as long as 38.2% retracement of 0.9504 to 0.6826 at 0.7849 holds, long term down trend from 1.1079 is expected to resume sooner or later. Break of 0.6826 low will target 0.6008 key support level. However, firm break of 0.7849 will indicate that rise from 0.6826 is developing into a medium term rebound, rather than a sideway pattern. In such case, stronger rise should be seen to 55 month EMA (now at 0.8116) and above.
USD/CAD Daily Outlook
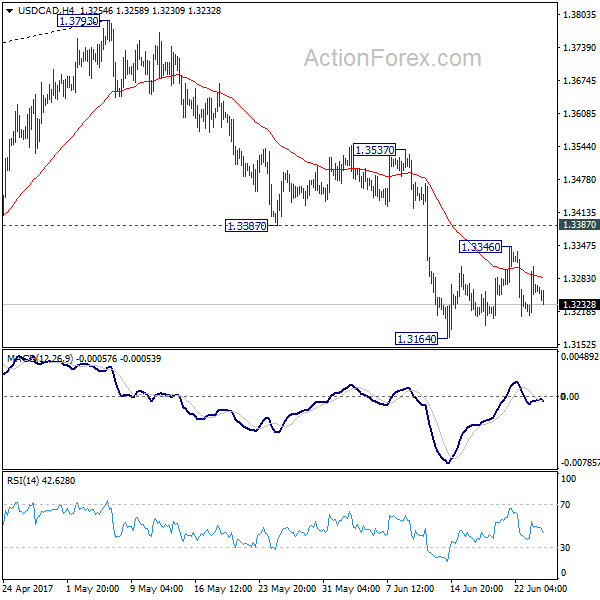
Daily Pivots: (S1) 1.3216; (P) 1.3262; (R1) 1.3313; More....
Intraday bias in USD/CAD remains neutral at this point as consolidation from 1.3164 continues. While the consolidation might extend, upside of recovery should be limited by 1.3387 support turned resistance to bring fall resumption. As noted before, corrective rise from 1.2460 has completed at 1.3793 already. Below 1.3164 will extend the decline from 1.3793 to 1.2968 cluster support, 61.8% retracement of 1.2460 to 1.3793 at 1.2969. However, firm break of 1.3387 will dampen our view and turn focus back to 1.3537 resistance next.
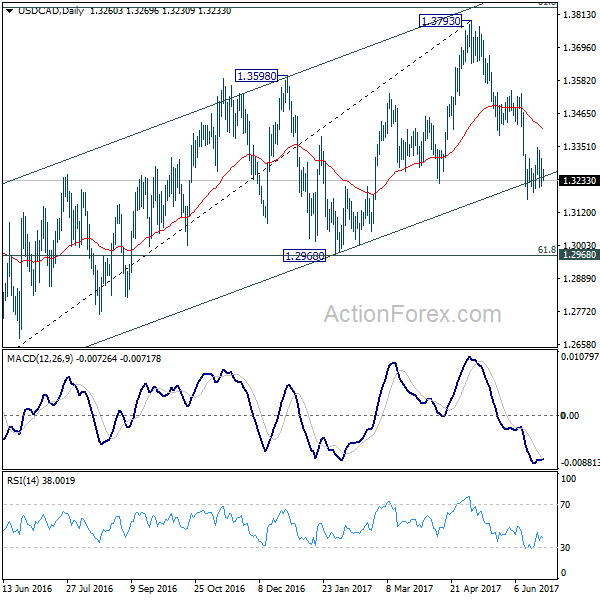
In the bigger picture, price actions from 1.4689 medium term top are seen as a correction pattern. The first leg has completed at 1.2460. Rise from 1.2460 is seen as the second leg and has completed at 1.3793, ahead of 61.8% retracement of 1.4689 to 1.2460 at 1.3838. Break of 1.3222 should now indicate the start of the third leg while further break of 1.2968 should confirm. In that case, USD/CAD should decline through 1.2460 support to 50% retracement of 0.9406 to 1.4869 at 1.2048.
Technical Outlook: Spot Gold Bears Took Control After Today’s 1.7% Fall
Spot Gold collapsed in early European trading on Monday, falling around 1.7%, after recovery rally was repeatedly capped by 55DMA and falling 4-hr cloud at $1258.
The yellow metal price fell to $1236, the lowest since 16 May, after strong bearish acceleration fully retraced $1240/$1258 correction rally.
Fresh bears were so far contained by 200SMA ($1236) but near-term risk is shifting lower after strong fall, as daily studies turn into bearish setup. Break below 200SMA handle would expose next supports at $1233 (Fibo 76.4% of $1214/$1296 ascend) and $1230 (16 May) low).
Broken Fibo 61.8% at $1245, reinforced by daily cloud $1245/48) should cap corrective rallies before bears resume.
Daily close below $1240 (former low of 21 June) will be seen as strong bearish signal.
Traders are focusing on Fed Chair Janet Yellen's speech on Tuesday for more signals about Fed's next rate hike action, as well as US Q1GDP data on Thursday, which is expected to give more details about the health of the US economy.
Res: 1245, 1248, 1251, 1255
Sup: 1240, 1236, 1233, 1230
USD/JPY Elliott Wave Analysis
USD/JPY - 111.70
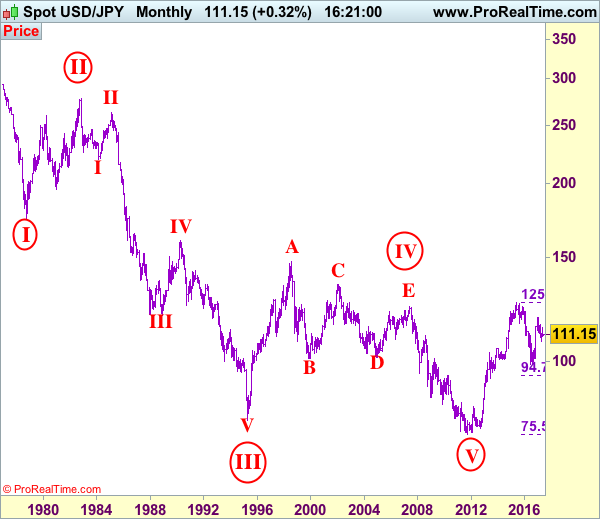
USD/JPY – Wave V of larger degree circle V has possibly ended at 75.31 and major correction has commenced and already met indicated target at 125.00.
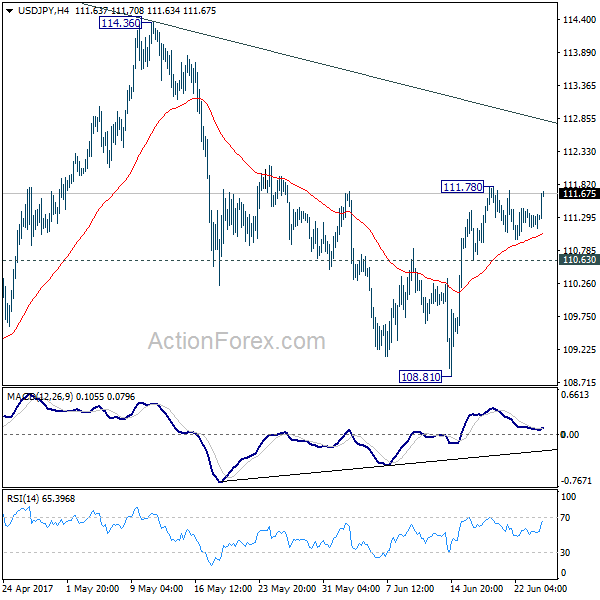
Although the greenback has maintained a relatively firm undertone after finding good support at 108.82 and consolidation with initial mild upside bias is seen for test of resistance at 112.13, however, as this move is viewed as retracement of the fall from 114.39, reckon upside would be limited to 112.25-30 (61.8% Fibonacci retracement of 114.39-108.82) and bring retreat later. Below 110.35 would bring weakness to 110.00 but reckon downside would be limited to 109.50-60 and said support at 108.82 would continue to hold, bring another rebound later.
Our preferred count is that, triangle wave IV (with circle) ended at 101.45 and the circle wave V brought dollar down to the record low of 75.31 in 2011 and the subsequent rebound signal major correction has commenced with A leg ended at 84.19, followed by wave B at 77.14 and impulsive wave C is now unfolding (indicated upside target at 125.00 had been met) for gain towards 127.00 level. In the event dollar drops below support at 99.01, this would confirm medium term decline from 125.86 top (2015 high) has resumed for subsequent weakness to 98.00 and possibly 97.00.
Under this count, this wave C is unfolding as impulsive waves with (1) (2), 1 2 ended at 80.67, 79.07, 82.84 and 81.69 respectively, hence the extended wave 3 has ended at 103.74 and wave 4 correction of recent upmove should bring weakness to 92.57, then towards 90.88 but psychological support at 90.00 should limit downside and bring another rally later in wave 5, indicated target at 125.00 had been met and gain to 127.00 cannot be ruled out but reckon price would falter below 130.00.
On the upside, whilst initial recovery to 112.13 resistance cannot be ruled out, reckon upside would be limited to 112.25-30 (61.8% Fibonacci retracement of 114.39-108.82), bring another decline later. Above 112.70-75 would risk a stronger rebound to previous support at 113.12 but break there is needed to signal the fall from 114.39 has ended, risk further gain to 113.85-90, however, said resistance at 114.39 should remain intact, bring another decline later.
Recommendation: Sell at 112.50 for 110.50 with stop above 113.50.

On the monthly chart, we have changed our preferred count that an impulsive wave is unfolding with major wave III with circle ended at 79.75, then followed by wave IV with circle and is labeled as a triangle with A: 147.64 (11 August, 1998), B: 101.25, C: 135.20, D: 101.67 and E leg ended at 124.14 to end the wave IV with circle. Hence, wave V with circle commenced from there and hit a record low of 75.31, however, the subsequent strong rebound signals this circle wave V has possibly ended there, hence gain to (indicated upside target at 122.00 and 125.00 had been met), the retreat from 125.86 suggests wave A of major correction has ended there and wave B correction back to 99.00, then 95.00 would be seen, however, reckon downside would be limited to 90.00, bring another rebound in wave C next year.
EUR/USD Daily Outlook
Daily Pivots: (S1) 1.1156; (P) 1.1182 (R1) 1.1219; More....
Intraday bias in EUR/USD remains neutral as it's still bounded in sideway trading in range of 1.1109/1295. With 1.1109 support intact, there is no indication of reversal yet. Decisive break of 1.1298 key resistance will carry larger bullish implication and target 1.1615 resistance next. On the downside, break of 1.1109 support will indicate short term topping and rejection from 1.1298. In such case, intraday bias will be turned to the downside for 1.0838 support.
In the bigger picture, the case for medium term reversal continues to build up with EUR/USD staying far above 55 week EMA (now at 1.0941). Also, bullish convergence condition is seen in weekly MACD. Focus will now be on 1.1298 key resistance. Rejection from there will maintain medium term bearishness and would extend the whole down trend from 1.6039 (2008 high). However, firm break of 1.1298 will indicate reversal. In such case, further rally would be seen back to 1.2042 support turned resistance next.
GBP/USD Daily Outlook
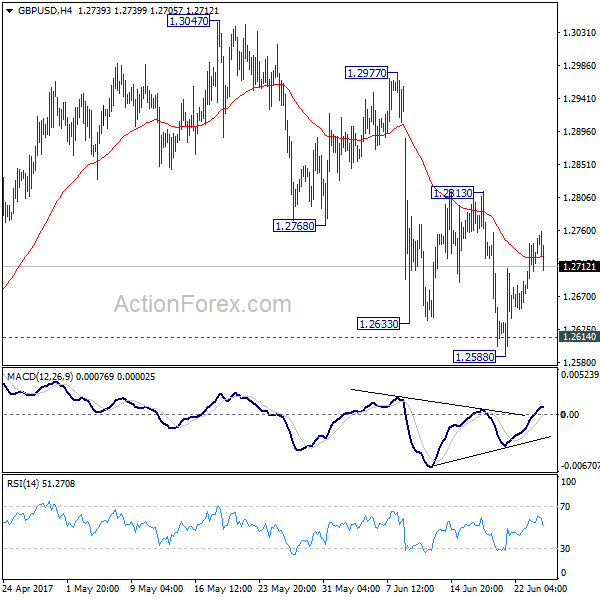
Daily Pivots: (S1) 1.2680; (P) 1.2711; (R1) 1.2748; More...
Intraday bias in GBP/USD remains neutral for the moment. With 1.2813 resistance intact, deeper decline is expected. Sustained break of 1.2614 resistance turned support will confirm our bearish view that consolidation pattern from 1.1946 has completed. In that case, deeper fall should be seen back to retest 1.1946 low. However, break of 1.2813 resistance will dampen our view and turn bias back to the upside for 1.3047 and above.
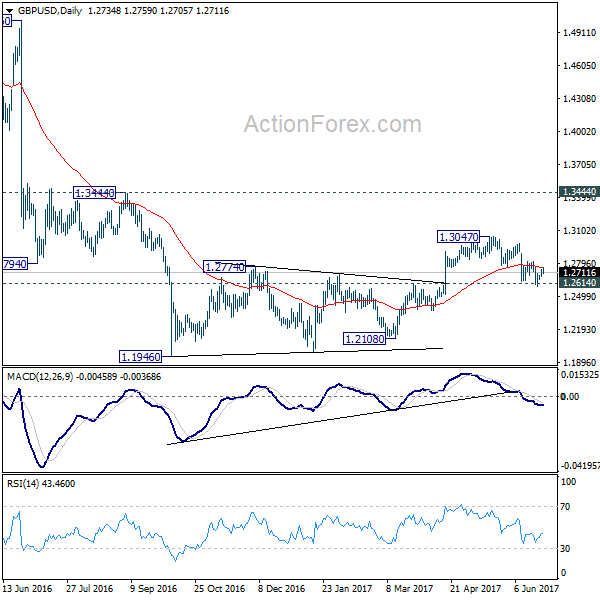
In the bigger picture, fall from 1.7190 is seen as part of the down trend from 2.1161. Price actions from 1.1946 medium term low are seen as a consolidation pattern, which could have completed at 1.3047 after hitting 55 week EMA. Break of 1.1946 low will target 61.8% projection of 1.5016 to 1.1946 from 1.3047 at 1.1150 next. In case the consolidation from 1.1946 extends, outlook will stay remain bearish as long as 1.3444 resistance holds.
USD/CHF Daily Outlook
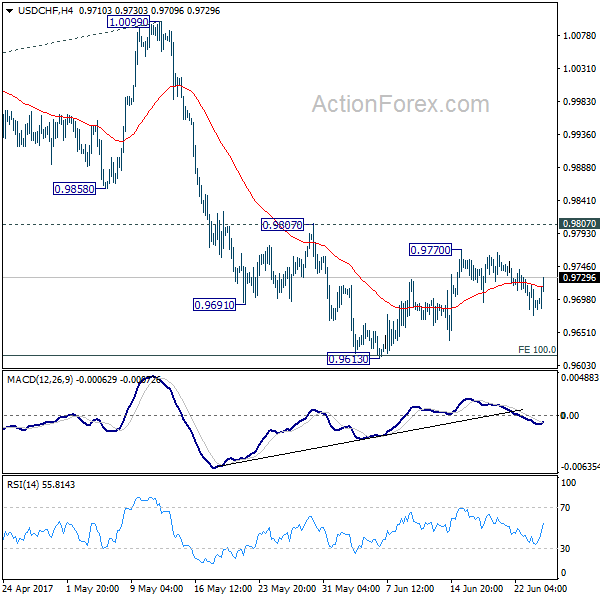
Daily Pivots: (S1) 0.9671; (P) 0.9696; (R1) 0.9717; More.....
USD/CHF recovers today but it's staying in consolidation pattern from 0.9613. Intraday bias remains neutral at this moment. As long as 0.9807 resistance holds, further fall is expected. Break of 0.9613 will resume the decline from 1.0342 and target 0.9548 support and below. We'd start to look for bottoming signal again as it approaches 0.9443 key support level. On the upside, firm break of 0.9807 will indicate near term reversal and turn outlook bullish for 1.0099 resistance next.
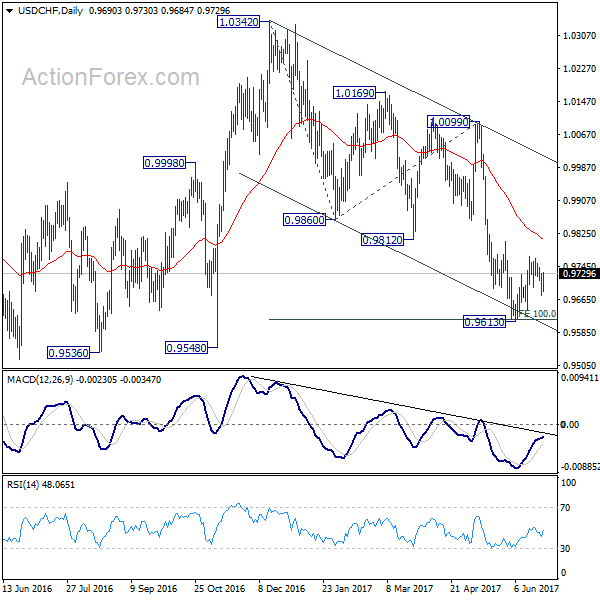
In the bigger picture, USD/CHF is still bounded in medium term range of 0.9443/1.0342 for the moment. Consolidative trading would likely continue and medium term outlook remains neutral. Break of 1.0342 key resistance is needed to confirm underlying bullish momentum in the pair. Meanwhile, downside attempts should be contained by 0.9443 key support level. However, sustained break of 0.9443 will carry larger bearish implication and target 0.9 handle.
USD/JPY Daily Outlook
Daily Pivots: (S1) 111.12; (P) 111.28; (R1) 111.40; More...
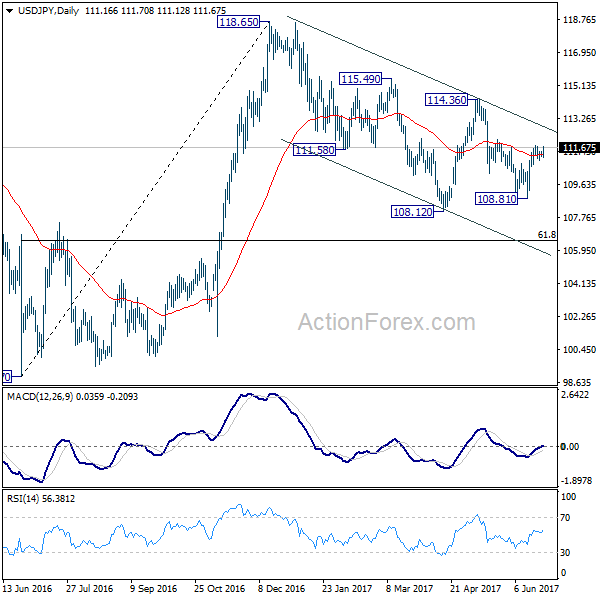
Intraday bias in USD/JPY remains neutral as it's bounded in consolidation below 111.78 temporary top. Further rise is favor with 110.63 minor support intact. Above 111.78 will target channel resistance (now at 112.87). Sustained break there will suggest that whole pull back from 118.65 has completed at 108.12 already. In such case, further rise should be seen to 114.36 resistance for confirmation. However, break of 110.63 will turn bias back to the downside for 108.81 instead.
In the bigger picture, price actions from 125.85 high are seen as a corrective pattern. It's uncertain whether it's completed yet. But in case of another fall, downside should be contained by 61.8% retracement of 75.56 to 125.85 at 94.77 to bring rebound. Overall, rise from 75.56 is still expected to resume later after the correction from 125.85 completes.
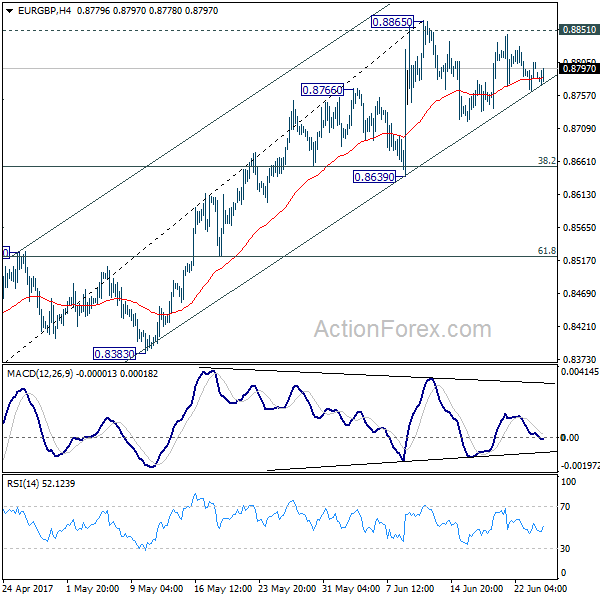
EUR/GBP Daily Outlook
Daily Pivots: (S1) 0.8773; (P) 0.8789; (R1) 0.8815; More...
Intraday bias in EUR/GBP remains neutral for the moment as consolidation from 0.8865 continues. Another fall could be seen but downside should be contained by 0.8639 support to bring rebound. Further rise is expected and decisive of 0.8851 resistance will pave the way to retest 0.9304 high. However, break of 0.8639 support will now indicate near term topping and bring deeper pull back 0.8529 resistance turned support and below.
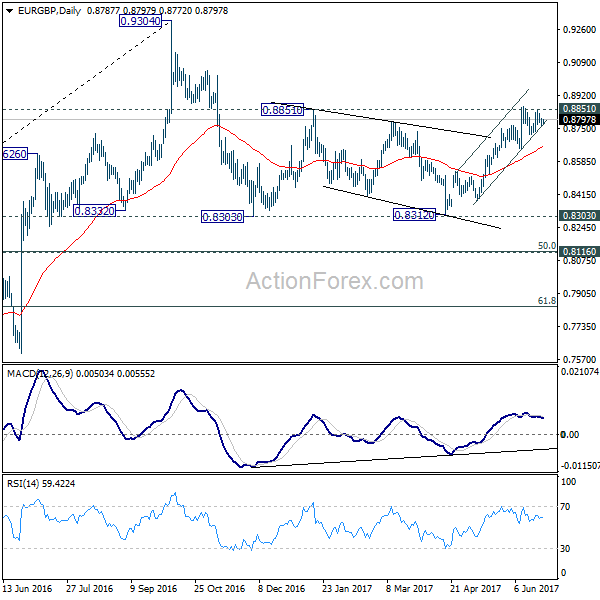
In the bigger picture, price actions from 0.9304 are viewed as a medium term corrective pattern. The leg from 0.9304 should have completed after testing 0.8332 structural support. But it's too early to say that larger rise from 0.6935 is resuming. Rejection from 0.9304 will extend the consolidation with another falling leg. Meanwhile, firm break of 0.9304 will target 0.9799 (2008 high). In case of another decline, we'd expect strong support from 0.8116 cluster support (50% retracement of 0.6935 to 0.9304 at 0.8120) to contain downside and bring rebound.