Sample Category Title
Gold Setting Higher-Lows, Silver Ready For Another Leg Lower, Crude Oil Consolidating Before Another Likely Decline.
Gold Setting higher-lows.
Gold's medium-term momentum is positive. Hourly support is located at 1240 (yesterday low). Stronger support is given at 1214 (09/05/2017 low). Expected to show short-term upside pressures.
In the long-term, the technical structure suggests that there is a growing upside momentum. A break of 1392 (17/03/2014) is necessary ton confirm it, A major support can be found at 1045 (05/02/2010 low).
Silver Ready for another leg lower.
Silver's selling pressures are strong despite ongoing bullish consolidation. Closest support is given at 16.36 (21/06/2017 low). Strong support is given at 16.06 (09/05/2017 low). Key resistance is given at a distance at 19.00 (09/11/2017 high). The road seems wide open for further decline.
In the long-term, the death cross indicates that further downsides are very likely. Resistance is located at 25.11 (28/08/2013 high). Strong support can be found at 11.75 (20/04/2009).
Crude oil Consolidating before another likely decline.
Crude oil is now consolidating since the recent collapse from $52. Support given at a 42.20 (14/11/2017 low) has been broken. Expected to show further decline.
In the long-term, crude oil has recovered after its sharp decline last year. However, we consider that further weakness are very likely. Strong support lies at 35.24 (05/04/2016) while resistance can now be found at 55.24 (03/01/2017 high).
EUR/JPY Sideways Price Action, EUR/GBP Selling Pressures Increase Round 0.8800, EUR/CHF Heading Lower.
EUR/JPY Sideways price action.
EUR/JPY has bounced back after breaking hourly support given at 122.56 (18/05/2017 low) has been broken. Hourly resistance can be found at 125.82 (16/05/2017 high). Major support is given at 114.90 (18/04/2017 low).
In the longer term, the technical structure validates a medium-term succession of lower highs and lower lows. As a result, the resistance at 149.78 (08/12/2014 high) has likely marked the end of the rise that started in July 2012. Strong support at 94.12 (24/07/2012 low) looks nonetheless far away.
EUR/GBP Selling pressures increase round 0.8800.
EUR/GBP is struggling to go any higher. Hourly resistance is given at 0.8866 (12/06/2017 high). Other support can be found at 0.8652 (08/06/2017 low). Expected to show renewed strength.
In the long-term, the pair has largely recovered from recent lows in 2015. The technical structure suggests a growing upside momentum. The pair is trading above from its 200 DMA. Strong resistance can be found at 0.9500 psychological level.
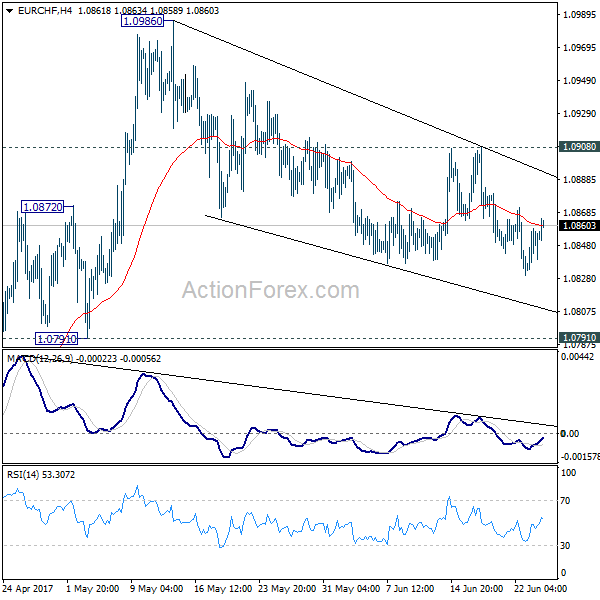
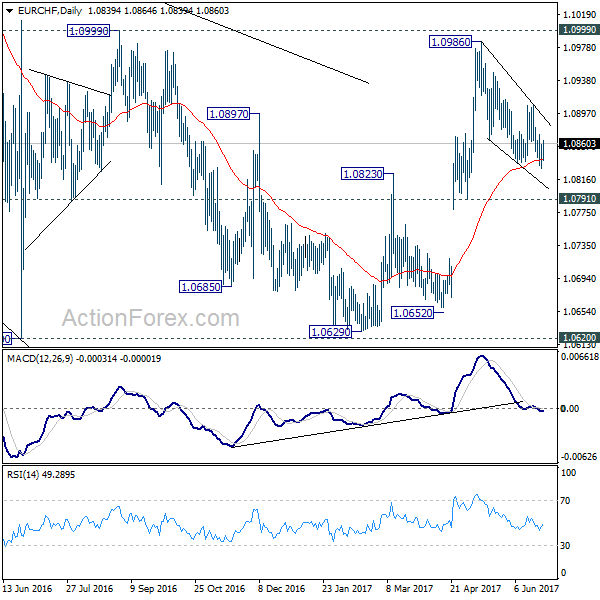
EUR/CHF Heading lower.
EUR/CHF's bearish pressures are definitely on. Yet, we believe that the medium-term pattern suggests us to see continued bearish pressures towards hourly support that can be found at 1.0792 (03/05/2017 low).
In the longer term, the technical structure is mixed. Resistance can be found at 1.1200 (04/02/2015 high). Yet,the ECB's QE programme is likely to cause persistent selling pressures on the euro, which should weigh on EUR/CHF. Supports can be found at 1.0184 (28/01/2015 low) and 1.0082 (27/01/2015 low).
USD/CHF Short-Term Selling Pressures, USD/CAD Buying Demand Is Fading, AUD/USD Bouncing Back.
USD/CHF Short-term selling pressures.
USD/CHF is pushing lower. Hourly resistance can be found at 0.9771 (09/06/2017 high). Strong resistance is given at 1.0107 (10/04/2017 high). Expected to show continued short-term bearish pressures.
In the long-term, the pair is still trading in range since 2011 despite some turmoil when the SNB unpegged the CHF. Key support can be found 0.8986 (30/01/2015 low). The technical structure favours nonetheless a long term bullish bias since the unpeg in January 2015.
USD/CAD Buying demand is fading.
USD/CAD is in a consolidation phase after the strong decline. Hourly support lies at 1.3165 (14/06/2017 high). Expected to show continued weakness towards support given at 1.3010 (16/02/2017 low).
In the longer term, the pair lies in a bullish channel since a year. Strong resistance is given at 1.4690 (22/01/2016 high). Long-term support can be found at 1.2461 (16/03/2015 low).
AUD/USD Bouncing back.
AUD/USD's technical structure is positive since early May. Yet, in the short-term there will likely be bearish pressures towards support given at 0.7520 (09/06/2017 low)
In the long-term, we are waiting for further signs that the current downtrend is ending. Key supports stand at 0.6009 (31/10/2008 low) . A break of the key resistance at 0.8295 (15/01/2015 high) is needed to invalidate our long-term bearish view.
EUR/AUD Daily Outlook
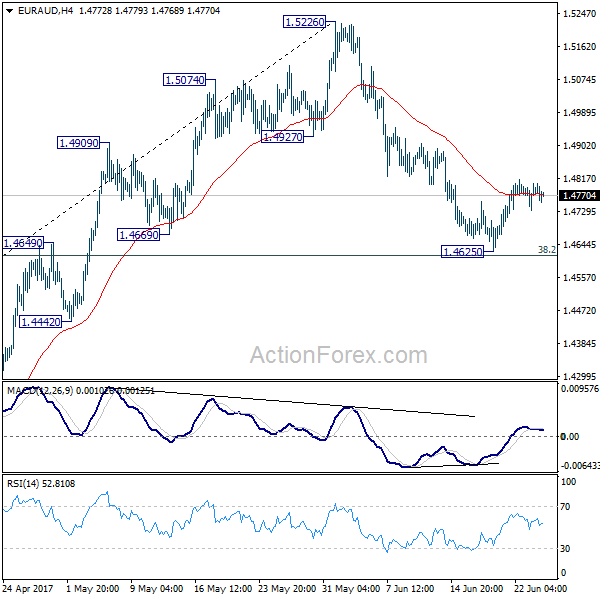
Daily Pivots: (S1) 1.4746; (P) 1.4775; (R1) 1.4815; More...
Outlook in EUR/AUD is unchanged. The pull back from 1.5226 might have completed after drawing support from 38.2% retracement of 1.3624 to 1.5226 at 1.4614. Further rise would be seen to retest 1.5226 high next. However, sustained break of 1.4614 fibonacci level will pave the way to 61.8% retracement at 1.4236 and possibly below.
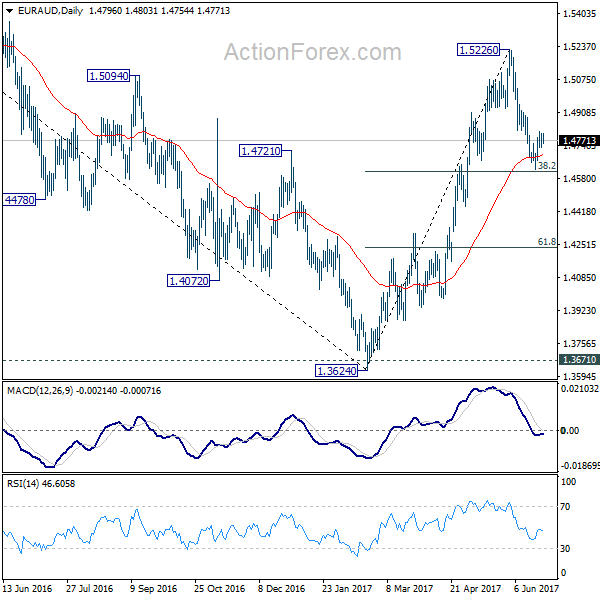
In the bigger picture, price actions from 1.6587 medium term top are viewed as a corrective pattern. Such correction should be completed at 1.3624 after defending 1.3671 key support. Rise from 1.3642 would extend to 61.8% retracement of 1.6587 to 1.3624 at 1.5455. Sustained break there will pave the way to retest 1.6587. However, sustained break of 1.4669 support will dampen this bullish view. We'll assess the outlook later after looking at the structure and depth of the pull back.
EUR/USD Selling Pressures Are Important At 1.1200, GBP/USD Strengthening Within Downtrend Bearish Move, USD/JPY Continued Consolidation Before Testing Again...
EUR/USD Selling pressures are important at 1.1200.
EUR/USD is trading mixed. The pair is still trading below strong resistance given at 1.1300 (09/11/2017 high). Hourly support can be found at 1.1076 (18/05/2017 low). Stronger support lies at 1.0842 (11/05/2017 low).
In the longer term, the momentum is clearly negative. We favour a continued bearish bias towards parity. Key resistance holds at 1.1714 (24/08/2015 high) while strong support lies at 1.0341 (03/01/2017 low).
GBP/USD Strengthening within downtrend bearish move.
GBP/USD is still bouncing higher since the pair failed to hold below former hourly support given at 1.2636 (09/06/2017 low). Hourly resistance lies at 1.2818 (14/06/2017 high). Expected to show further renewed selling pressures.
The long-term technical pattern is even more negative since the Brexit vote has paved the way for further decline. Long-term support given at 1.0520 (01/03/85) represents a decent target. Long-term resistance is given at 1.5018 (24/06/2015) and would indicate a long-term reversal in the negative trend. Yet, it is very unlikely at the moment.
USD/JPY Continued consolidation before testing again resistance at 112.13.
USD/JPY has failed to monitor resistance given at 112.13 (24/05/2017 high). Hourly support can be found at 108.89 (14/06/2017 high). Stronger support is located at 108.13 (17/04/2017 low).
We favor a long-term bearish bias. Support is now given at 96.57 (10/08/2013 low). A gradual rise towards the major resistance at 135.15 (01/02/2002 high) seems absolutely unlikely. Expected to decline further support at 93.79 (13/06/2013 low).
EUR/CHF Daily Outlook
Daily Pivots: (S1) 1.0833; (P) 1.0846; (R1) 1.0862; More...
At this point, the correction from 1.0986 could still extend lower. But downside is expected to be contained by 1.0791/0872 support zone to bring rebound. Break of 1.0908 resistance will argue that the correction is completed. In such case, intraday bias is turned back to the upside for retesting 1.0986/0999 resistance zone.
In the bigger picture, the price actions from 1.1198 are seen as a corrective move. Such correction could have completed after defending 38.2% retracement of 0.9771 to 1.1198 at 1.0653. Decisive break of 1.0999 resistance will target a test on 1.1198 high. For now, this will be the preferred case as long as 1.0791 support holds.
US Data In Focus, Rising Sight Deposits Suggests SNB Intervention
US data and Fed expectations
Volatility in interest rates continues to pick up as inflation data is mixed and central banks' guidance becomes more important. Nowhere is this more apparent than within the Fed. Markets go a full docket for FOMC members speaking publicly last week.
On one side of the spectrum is the expectation that tighter labor market conditions will drive inflation (pure belief in the Philips Curve). The other expectation is that cyclical activity has peaked and a soft reading indicates a broad-based economic weakening. Interestingly and key to our view is that no speaker suggested waiting past 2017 to begin balance sheet reductions. Wide spectrum of opinions on US data had led to a directionless USD trade.
Yet the fall in oil prices has tipped the balance of weaker prices pressed towards the downside but allowing technology stocks to outperform, driving US equity markets higher. We retain our view that the Fed will raise bench market rates another 25bp in December but further detail its balance sheet reduction process in September.
The Fed will increasingly look too subdued to tighten through the reduction of balance sheet rather than traditional interest rates hikes. However, unbridled USD strength against G10 currencies is unlikely at European PMI to continue to signal faster GDP growth. The ECB see this development as an opportunity to move forward with their strategy to exit emergency monetary policy (including taper its monthly asset purchased).
Even though inflation data has not meaningfully improved, we believe a key announcement will take place at the September ECB meeting. In the near term, traders will be watching incoming USD data for direction. Today’s durable goods orders should decline slightly to -0.6% as industrial production reports a drop in durable goods manufacturing. The highlight of the week will be Thursday's GDP and Friday's personal income & spending plus PCE index.
Finally, while politics will grab the headlines and generate short-term FX pressure (take your pick on Russia investigations, repeal of Obamacare or potential Trump fiscal stimulus), for direction stick to the Fed monetary policy.
Switzerland: Data suggests continued intervention from the SNB
The Swiss deposits data release continues to outpace expectations. They are now reaching almost 580 billion CHF (578.2b vs 577.4b expected). The main reason for this is that the SNB is not ready to stop its ultra-loose monetary policy as President Thomas Jordan said and this drives strong upside pressures on the CHF. The EURCHF is standing around 1.0850 and we do not see how, at least in the medium-term, the pair could hold consistently above 1.10.
The SNB's monetary policy depends widely on its giant neighbour, the Eurozone, and while financial markets were expecting Mario Draghi to hint a few weeks ago at the ECB meeting about a further normalisation, this has not happened yet. As a result, intervention to defend the CHF on the FX market will continue for the SNB as long as there is no normalisation from the ECB.
We also note that there are economic uncertainties in Europe and we believe that it should prevent the ECB to normalise its interest rates. Santander acquired Banco Popular in Spain and in Italy, Intesa San Paolo has been forced to acquire Banco Popolare di Vicenza and Veneto Banca. The Italian state will likely engage up to 17 billion in this operation. It is then not the exact moment for the ECB to raise rates (charge of the debt would become too massive at this point). Therefore CHF overvaluation will continue and we continue to be bullish on the Helvetic currency.
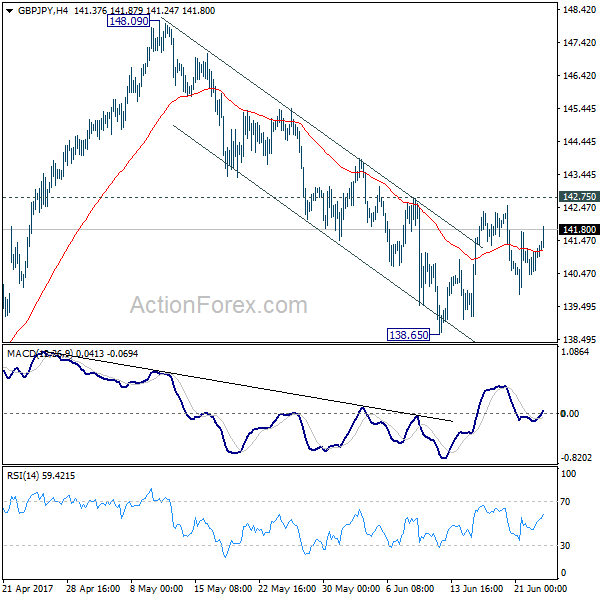
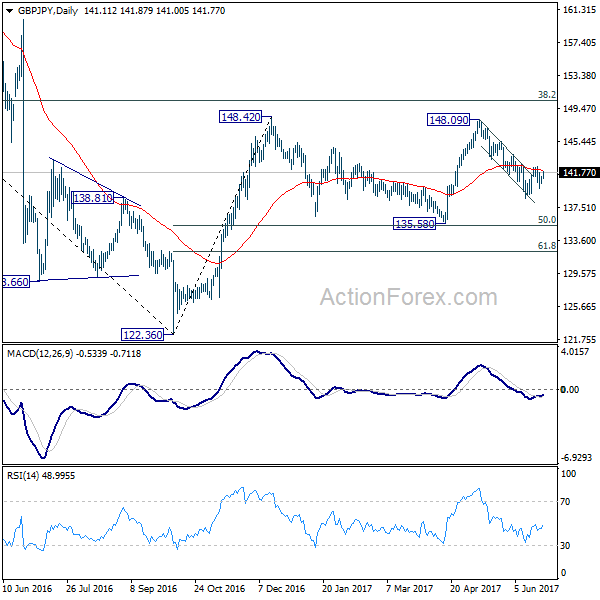
GBP/JPY Daily Outlook
Daily Pivots: (S1) 141.04; (P) 141.46; (R1) 141.92; More....
GBP/JPY recovers today but stays below 142.75 resistance so far. Intraday bias remains neutral first. on the downside, below 138.65 will resume the decline from 148.09. But in that case, we'd look for bottoming signal around 135.58, which is close to 135.39 fibonacci level, to bring rebound. On the upside, break of 142.75 should confirm completion of the fall from 148.09 and turn bias back to the upside for this resistance.
In the bigger picture, while the fall from 148.09 is deeper than expected, we're not bearish in the cross yet. Price action from 148.42 is possibly developing into a sideway pattern with fall from 148.09 as the third leg. Deeper decline could be seen but we're looking for strong support from 135.58 and 50% retracement of 122.36 to 148.42 at 135.39 to contain downside. Rise from 122.36 is still mildly in favor to resume at a later stage. However, sustained break of 135.58/39 will confirm reversal and target a retest on 122.36 low.
Global Economic Optimism Continues
Global equities moved higher on Monday as optimism continued to improve on global economic growth.
However, USD remained somewhat subdued in early trading as the outlook for US inflation remains tenuous as restrictive bond yields continue to raise concerns about the Federal Reserve's strategy to tighten their economic policy. In general, markets think the pace of its tightening will be much slower than policymakers want.
The EUR had little impact following the news over the weekend that Italy began winding up 2 failed Venetian banks on Sunday in a deal that is likely to cost the country nearly €17 Billion. Earlier the German IFO posted a reading of 106.8 better than the consensus of 106.4 and the previous reading of 106.5, showing a continued optimistic view of Eurozone Business confidence. EURUSD traded around 1.1200 after the release and the 7-month high, set earlier this month at 1.1296, could be tested if EUR buying momentum, and typical end of month USD selling gather momentum.
Oil prices moved higher after having fallen for five weeks in a row over concerns OPEC-led production cuts have failed to ease a global crude glut stemming in part from increased U.S. oil production. The Baker Hughes report, issued last week, showed US energy firms added 11 new Oil Rigs in the week to June 23rd. This takes the total rig count to 785 which is the most since April 2014. WTI was trading around $43.60pb and Brent at $46.25pb. Markets believe that $40 will provide some support as US shale production will likely abate if it breeches this level.
USDJPY fell 0.2% to trade around 111.55. GBPUSD added to its 1% four-day gain as sterling moved higher trading around 1.2750. After 3 successive days of gains Gold fell back 0.3% trading around $1,247 in early trading.
US Durable goods will be released today at 13:30 BST and are expected to shoe a 0.6% decline which is likely to indicate that US consumers are only slightly rebounding and inflation is not likely to rise further which, in turn, adds more credence to the Federal Reserve holding off on any near-term rise in US interest rates.
Trade Idea: GBP/USD – Buy at 1.2660
GBP/USD – 1.2738
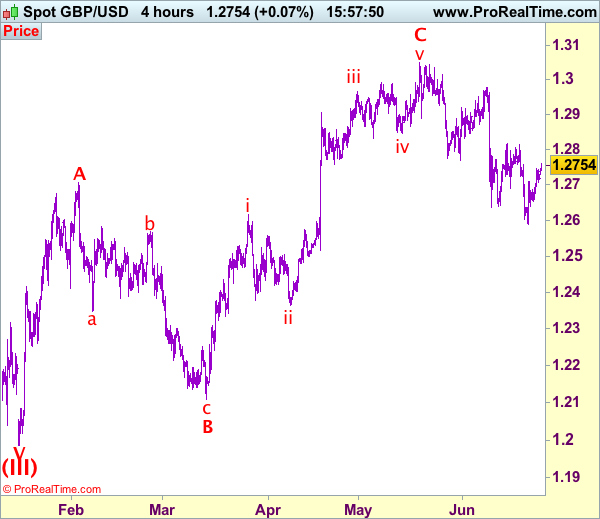
Recent wave: Wave V of larger degree wave (III) has ended at 1.1986 and major correction has commenced from there for gain to 1.3000 and 1.3140-50
Trend: Near term down
New strategy :
Buy at 1.2660, Target: 1.2810, Stop: 1.2600
Position: -
Target: -
Stop:-
As sterling has maintained a firm undertone after staging a strong rebound from 1.2589 (last week’s low), suggesting low has been formed there and consolidation with mild upside bias is seen for gain towards resistance at 1.2818, however, a sustained breach above there is needed to add credence to this view and suggest recent decline from 1.3048 has ended at 1.2589, then headway to 1.2850-60 would follow.
Our preferred count on the daily chart is that cable's rebound from 1.3500 (wave (A) trough) is unfolding as a wave (B) with A ended at 1.7043, followed by triangle wave B and wave C as well as wave (B) has ended at 1.7192, the subsequent selloff is the larger degree wave (C) which is still unfolding with minor wave (III) of larger degree wave 3 ended at 1.1986, hence wave (IV) correction is in progress which could either be a triangle wave (IV) of a complex formation but upside should be limited to 1.3500 and price should falter well below 1.4000, bring another decline in wave (V) of 3 for weakness to 1.1500, then 1.1200.
On the downside, expect pullback to be limited to 1.2660-70 and support at 1.2640 should hold, bring another rebound later. Only a drop below 1.2640 would suggest the rebound from 1.2589 has ended, bring retest of this level, break of this support would revive bearishness and signal recent decline from 1.3048 top has resumed for retracement of early upmove to 1.2550, then towards previous support at 1.2515.