
Sample Category Title
Commodities: The 1st Cut Isn’t The Deepest
Gold lifted by Oil's collapse as the noise around a deeper OPEC cut intensifies.
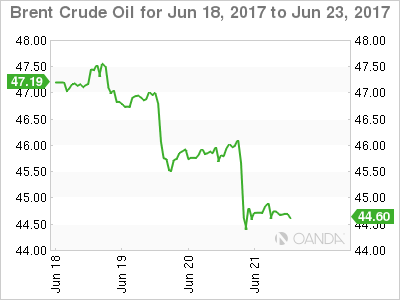
Oil's suffering continued overnight with both Brent and WTI finishing over 2 percent lower in the New York session. The story, however, isn't the headline fall for the session, it is the price action after the U.S. EIA Crude Inventory numbers. Inventories fell by a larger than expected 2.45 million barrels with gasoline inventories also falling 0.6 million barrels. Crude immediately bounced about one dollar, but both Brent and WTI ran into a brick wall of sellers and collapsed some 4 percent to both finish near their lows.
The fact that oil is now falling on a bullish inventory number must be a red light for producers and traders alike. One implication is that U.S. shale producers have moved their hedges lower and are selling oil futures on any rally from these levels as per last night. The other is that OPEC/Non-OPEC must now confront the oil elephant in the room, increasing the overall production cut from its present levels. The other choice will be to let the market set the price which may mean oil drops to a level that even the newly slimline U.S. shale industry struggles to break even at. OPEC may be forced to choose the least ugly horse in the glue factory in a Hobson's choice nightmare.
Brent spot trades at 44.60 with Asia's dead cat bounce over as soon as Europe has walked in. Resistance is at last night's highs around 46.50 followed by 47.70. Technical support is absent until the November low at 42.95 followed by the must hold 41.00 region.
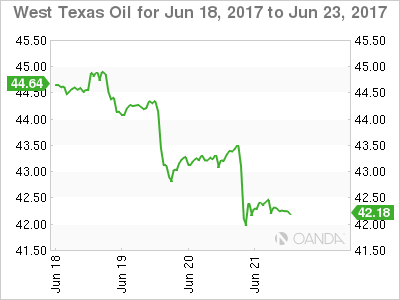
WTI spot trades at 42.15 this morning with its nascent rally meeting the same fate as Brent's. Resistance is at 44.00 and 45.00. Support is just below at 42.00 followed by a charting black hole until the 39.00 region.
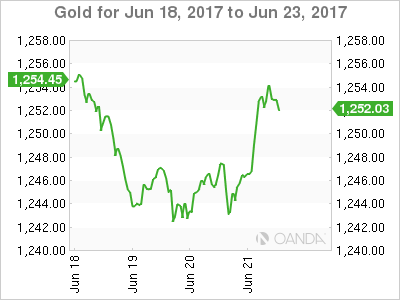
Gold finally showed some signs of life overnight with a weak pulse helping the yellow metal climb seven dollars to finish at 1252.00 for the New York session. The uncontrolled oil price spill in the futures markets may have seen some traders pushing the risk aversion button and buying gold. The primary driver, however, appears to be the flattening of the longer-dated U.S. Treasury curve, particularly the 10/30 year spread as the bond market continues to call the Federal Reserve's bluff on the trajectory of U.S. rates and the underlying health of the economy.
With the weekend rapidly approaching and the carnage in the oil market, which is rattling investors, we may see some buying emerge in precious metals to hedge risk aversion in what is a very data-light week.
Gold is trading at 1252.00 in early Europe with the 100-day moving average at 1248.35 below the initial support followed by 1240. Above, gold has a clear run until first resistance at 1257.00 followed by 1267.00, some distance behind.
Daily Technical Analysis: EURUSD, GBPUSD, USDJPY, USDCHF
EURUSD
The EURUSD had a moderate bullish momentum yesterday topped at 1.1169. The bias is neutral in nearest term. As long as stay above 1.1080 I remain bullish, but we need a clear break above 1.1285 to end the current bearish correction phase (after the false break above 1.1285 last week) and continue the bullish scenario targeting 1.1350 – 1.1452 area. On the downside, 1.1080 remains a good place to buy with a tight stop loss, as a clear break and daily close below 1.1080 would interrupt the bullish scenario testing a major trend line support and 1.0900 as you can see on my H4 chart below.
GBPUSD
The GBPUSD failed to continue its bearish momentum yesterday topped at 1.2710 but closed a little bit lower at 1.2670. The bias is neutral in nearest term. The double top bearish scenario (1.2815) should remain valid, but any rejection to move consistently below 1.2635 could create a false breakdown bullish scenario retesting 1.2815. On the downside, a clear break and daily close below 1.2635 would expose 1.2500 region. Overall I remain neutral.
USDJPY
The USDJPY had another indecisive movement yesterday. The bias is neutral in nearest term probably with a little bearish bias. Price is still in a bullish phase after broke above the trend line resistance as you can see on my H4 chart below, but found an important resistance at 111.78 – 112.00 which need to be clearly broken to the upside to continue the bullish phase targeting 113.00 region. On the downside, key support is seen around 110.65. A clear break back below that area would interrupt the bullish scenario testing 110.00 or lower.
USDCHF
The USDCHF had a moderate bearish momentum yesterday and hit 0.9716 earlier today. The bias is bearish in nearest term testing 0.9695. A clear break below that area could trigger further bearish pressure testing 0.9650 region. Immediate resistance is seen around 0.9770 but key resistance remains around 0.9815 which remains a good place to sell with a tight stop loss as a clear break above that area would end the bearish outlook testing 0.9900 area or higher.
EUR/USD Analysis: Breaks Short Term Pattern
Although the recent surge of the EUR/USD currency exchange pair was mainly caused by the depreciation of the US Dollar, the push was strong enough to pass the resistance of a channel down pattern. The pattern dictated the pairs movements throughout June, and it was expected that it will continue to do so until the end of the month. However, after seven hours of continues assault, the upper trend line of the descending channel was broken. On Thursday morning the currency pair traded between the 100 and 200-hour SMAs, respectively, at 1.1162 and 1.1182. It is most likely that the rate will resume its decline, as it is expected in the medium term. However, market participants should watch out for short term surges.
GBP/USD Analysis: Anchored Around 1.27
As was anticipated, the Sterling done its best to erase most of Tuesday's losses yesterday, but was still unable to fully reclaim the 1.27 level, which resulted in a close 30 pips lower. The Cable is now expected to maintain trade between the monthly S2 and the monthly S1, with the exchange rate mostly gravitating towards the 1.2750 area. Consequently, another bullish development today would confirm this scenario, even though some technical indicators suggest otherwise. Furthermore, the GBP/USD currency pair has been sliding down for five weeks in a row now, which only adds fuel to the already bearish ‘fire'. A possible trend-line at 1.2730 could also limit today's gains should they occur. In case bears manage to prevail, the pair is unlikely to drop far below the monthly S2 or the 1.26 major level.
USD/JPY Analysis: Continues To Edge Lower
The USD/JPY pair's attempts to recover were limited by the descending channel's resistance line. The exchange rate bounced back from this down-trend and is now expected to keep moving lower. The channel's lower boundary is located only near 108.00, meaning that the Greenback has a lot of room to keep declining. Furthermore, the monthly S1 at 109.22 is a strong support, which could prevent the given pair from falling deeper down. Technical indicators, however, are unable to confirm the possibility of the negative outcome today, as they are giving mixed signals in all timeframes. No significant drops are likely to occur by the end of the week, as there are no scheduled fundamental events that could have such a bearish impact on the US Dollar. Price is expected to close near 110.65 today.
Gold Analysis: Trades Above 1,250 Mark
On Thursday morning the yellow metal traded above the monthly pivot point, which is located at the 1,253 mark. The bullion managed to surge during the early hours of June 22 due to the fundamental events in the US. Due to the fact that the commodity price was located above the notable level of significance, it can be expected that the surge of the metal's price will continue. The next level of resistance, that gold faces it the 200-hour SMA, which during the early hours of the day's trading was located at the 1,257.20 mark. However, it could be observed that the pivot point was not clearly left behind, as the yellow metal's price had fluctuated in limbo around it for six consecutive hours.
Technical Outlook: EURUSD – Lift Above 10/20SMA’s Needed For Stronger Bullish Signal
The Euro ticked higher in Asia and posted new high at 1.1177 where gains were so far capped by falling 10SMA, but near-term outlook remains positive following strong rally on Wednesday. Bounce from correction low at 1.1118, generates initial signal of base formation. Broader bull-trend remains intact and supports scenario of further upside which needs to clear strong barriers provided by 10SMA (1.1177) and 20SMA (1.1201) to confirm reversal and higher low at 1.1118. Slow stochastic is reversing from oversold territory on daily chart and supports the notion. Meantime, dips should hold above 1.1152 (hourly Kijun-sen) to keep bullish near-term structure intact. Alternatively, return below thick hourly cloud (cloud base lies at 1.1140) would generate bearish signal and re-expose downside pivots at 1.1121/09.
Res: 1.1165, 1.1177, 1.1201, 1.1228
Sup: 1.1152, 1.1140, 1.1121, 1.1109
NZDUSD In Consolidation Phase, Recent Uptrend Remains In Place
NZDUSD maintains the uptrend that started from the May 11 low of 0.6816 to the June 14 high of 0.7318. The bias turned bullish after prices rose above the 200-day moving average at the key psychological level of 0.7100 in early June.
However, after RSI reached overbought levels above 70, the oscillator slipped back down and NZDUSD is now consolidating just above the 0.7200 handle since peaking at 0.7318.
A decline in prices would find support at 0.7170 before approaching the key 0.7100 level. From here, the next big figure at 0.7000 comes into view. Breaking below 0.6950 (an important resistance level in May), would negate the current short-term bullish bias and would open the way for a deeper decline towards 0.6816 (May 11 low).
A bounce in prices from current levels would see a re-test of 0.7318 with scope to resume the uptrend towards 0.7375 (February high). The market would need to remain above 0.7100 in order to maintain upside momentum.
The short-term trend is neutral, as a consolidation phase is expected. But the uptrend from 0.6816 still remains intact. Technical indicators are supporting a bullish picture, with the positive alignment of the tenkan-sen and kijun-sen lines as well as RSI and MACD in bullish territory. The market is above the 200-day moving average and above the Ichimoku cloud.
Looking at the bigger picture, the trend is neutral, as NZDUSD has been trading between 0.6820 and 0.7375 for the past six months since December 2016.
Kiwi Lifted By Positive RBNZ Growth Outlook, Oil Prices Deteriorate On Supply Glut Concerns
The New Zealand dollar jumped after the Reserve Bank of New Zealand said the country’s growth outlook remained positive. Sterling held onto gains after the Bank of England’s Andrew Haldane’s hawkish comments. Oil prices hovered near 10-month lows on over-supply concerns.
The RBNZ held a policy meeting today and announced its decision to keep its benchmark interest rate at record lows of 1.75%. The central bank maintained its neutral policy stance and had an overall positive tone and indicated it was confident that it has the right policy stance to fulfill its mandate. This was supportive for the kiwi, which rose against the greenback to as high as $0.7276 in early Asian session trading before steadying around $0.7255.
The British pound was one of the top performing major currencies yesterday after the BoE’s policy member and chief economist Andrew Haldane made comments that contrasted the Bank’s Governor, Mark Carney’s dovishness. Haldane said the risks of leaving policy tightening too late are rising. This boosted sterling to rise above the key $1.2700 level on Wednesday, before steadying to trade around $1.2670.
The greenback fell against the yen for a third straight day. After briefly dropping to 110.94 in Asia today, the pair traded to around 111.15 yen. The narrowing yield differential between US and Japanese bond yields and falling oil prices are weighing on the US currency. The dollar index was down to last trade at 97.49, moving off a 1-month high of 97.87 hit on Tuesday.
Oil prices wallow in a bear market on concerns that the recent OPEC deal to cut production has not been effective in dealing with the supply glut. WTI oil fell by over $1.00 to touch a low of $42.05 a barrel on Wednesday while Brent crude entered a bear market as well yesterday after falling below $45 a barrel for the first time since November. Both benchmarks consolidated losses in Asia today.
Gold benefitted from a weaker dollar and rose to as high as $1254.65 an ounce, moving off a 5-week low of $1240.79 touched yesterday.
Looking ahead to the rest of the day, a speech by FOMC member Jerome Powell would be important to watch. In terms of economic data, US jobless claims and Canadian retail sales will be released during the US session. Ahead of these reports, the CBI industrial order expectations are due out of the UK.
RBNZ Maintains Accommodative Stance, Kiwi Jumps
As widely expected the Reserve Bank of New Zealand decided to maintain its accommodative stance by keeping its benchmark interest rate at record low levels, adding that it would continue doing so for a “considerable period”.
Specifically, the central bank's official cash rate was held at 1.75%. It has been at this level since November 2016, the last time the Bank engaged in a quarter percentage point rate cut.
The RBNZ Governor Graeme Wheeler said that “policy may need to adjust accordingly” as “numerous uncertainties” remain in place. He added that the recent appreciation in the New Zealand dollar was partially attributed to higher export prices and that a weaker currency would help rebalance growth.
Economic growth standing at the weak 0.4% quarter-on-quarter in the first quarter of the year was seen as transitory by the central bank, which expressed the view that prospects for the economy were “positive” due to, among others, low interest rates, strong population growth and changes in the country's Budget that would enhance family income and infrastructure spending.
Forex market participants reacted positively to the news, pushing the New Zealand dollar to the highest level it has reached so far during the day at $0.7276. Before the news, kiwi/dollar was trading at 0.7215. In morning European trading hours, the New Zealand dollar was up six-tenths of a percent relative to its US counterpart, with kiwi/dollar at 0.7255.
Analysts expect the RBNZ to keep rates at their current level for at least the remainder of the year.