
Sample Category Title
Oil Rout Is Also Setting The Tone In Fixed Income Markets
Market movers today
In the euro area, consumer confidence is due for release today. Consumer confidence rose from -3.6 in April to -3.3 in May, which is its highest level since 2007. We believe that consumer confidence will increase further as employment continues to be a tailwind and uncertainty over a euro break-up is fading with the outcome of the French elect ion.
The major event in the Scandi region is the Norges Bank meeting, where we expect unchanged rates but for it to remove it s ‘easing bias' from the interest rate path.
Selected market news
The rout in Oil markets continues to hunt financial markets. Yesterday, most US stocks fell, with notably energy and industrial shares leading the declines, which overshadowed a fresh rebound in technology and biotech companies. Asian stocks are increasing this morning, although traditional safe havens such as gold and Japanese yen are trading on a strong note.
The Brent oil price fell beneath USD45 a barrel to join West Texas Intermediate in a bear market yesterday. Among the factors creating pressure on the oil prices were indications that stockpiles in America remain above seasonal averages and Libya resumed some production. Furthermore, the lower break-even of shale oil producers in the US has created concerns that even at oil prices in the 40s, these producers will fill the gap if OPEC producers decide to cut production further. However, in our view, a weakening belief in global demand is one of the main drivers.
The oil rout is also setting the tone in fixed income markets. Five-year inflation expectations are now below the levels before Trump was elected and the global reflation story took hold in financial markets. Hence, inflation markets are doubting the arguments by US Federal Reserve that the fall in inflation will be transitory, even as growth in the US is holding up at the moment. The reaction by US Fed governors this week will certainly be interesting to follow, such as central bank policy makers Jerome Powell, James Bullard and Loret ta Mester today and tomorrow.
In the UK, the Queen delivered her speech in parliament yesterday, laying out the policies of the UK government. Despite the speech, there is st ill no deal between the conservative party and the Democratic Unionist Party on support for a conservative-led party. The speech laid out 27 bills that will be put forward in parliament , of which eight were related to Brexit and its impact on immigration and trade. However, other previous policy priorities were dropped from the agenda, possibly due to the limited majority of a conservative government.
Market Update – Asian Session: NZD Rallies On RBNZ Statement With Little Exchange Rate Jawboning And Positive Growth Outlook
US Session Highlights
(IR) Iran Oil Min Zanganeh: OPEC may decide to make further oil production cuts but need to assess effect of current supply levels
OPEC and Non-OPEC members said to see oil market re-balancing in Q2 2018
(US) MBA MORTGAGE APPLICATIONS W/E JUN 16TH: 0.6% V 2.8% PRIOR
(US) MAY EXISTING HOME SALES: 5.62M V 5.55ME; existing home price: $252.8K (all time high)
(US) DOE CRUDE: -2.5M V -1ME; GASOLINE: -0.6M V +0.5ME; DISTILLATE: +1.1M V +0.5ME
(RU) Russia govt spokesperson: to cancel meeting between Russia Dep Foreign Min and US Undersecretary of State; new sanctions continue destructive trend set by Obama administration
Techs and health care outshined the rest of the stock market and helped the Nasdaq gain 0.7% on the day, while the Dow and Russell posted small losses and the S&P was almost flat. Oil dropped 2% on continued negative sentiment about global market oversupply, and jawboning from Iranian oil officials had little effect on price action.
US markets on close: Dow -0.3%, S&P500 -0.1%, Nasdaq +0.7%
Best Sector in S&P500: Health Care
Worst Sector in S&P500: Energy
Biggest gainers: CA +13.4%; RHT +9.6%; INCY +7.6%
Biggest losers: FTR -8.2%; CHK -7.9%; SIG -5.6%
At the close: VIX 10.8 (-0.1pts); Treasuries: 2-yr 1.35% (flat), 10-yr 2.16% (+1bps), 30-yr 2.72% (-2bps)
US movers afterhours
ORCL Reports Q4 $0.89 v $0.79e, Rev $10.9B v $10.5Be; Guides FY18 EPS growth to accelerate; +10.3 afterhours
CO Reports Q4 $0.07 v $0.03 y/y, Rev $29.3M v $24.3M y/y; -2.6% afterhours
SCS Reports Q1 $0.18 v $0.19e, Rev $735M v $745Me; Guides Q2 $0.21-0.25 v $0.38e, R$750-780M v $800Me; -17.8% afterhours
Politics
(US) US President Trump: Reiterates to either renegotiate successfully or terminate NAFTA - Iowa Rally
(US) Discussion draft of Senate healthcare bill reportedly is largely similar to the House bill, but would link insurance subsidies to age and cuts Medicaid expansion more gradually - Wash Post
Key economic data
(NZ) NEW ZEALAND CENTRAL BANK (RBNZ) LEAVES OFFICIAL CASH RATE (OCR) UNCHANGED AT 1.75%; AS EXPECTED
(NZ) New Zealand May Credit Card Spending M/M: 0.9% v 0.9% prior; Y/Y: 7.6% v 6.4% prior
Speakers and Press
China
(CN) China Ministry of Commerce (MOFCOM) spokesperson Sun Jiwen: New FTZ negative list cuts foreign M&A restrictionsp; China, US still in discussion on 100-day trade plan
(CN) PBoC adviser reiterates PBoC will not unwind balance sheet like the US Fed - Chinese Press
Japan
(JP) BOJ Dep Gov Iwata: Monetary easing is still necessary in Japan; Inflation is still lacking momentum and is distant from target
(JP) Japan Chief Cabinet Sec Suga: Will talk with ruling party if request for extra Diet comes
Australia/New Zealand
(AU) BIS Oxford Economics: housing boom on Australia's east coast will be over in two years but a crash like the US subprime crisis in 2007 is not likely - AFR
(NZ) Kiwibank economist: NZD rise due to lack of "hard" words in RBNZ Gov Wheeler's comments about the currency gains - NZ Press
Korea
(KR) Bank of Korea (BOK) bi-annual report on financial stability: Q1 household debt to disposable income ratio 153.3%, +8.6% y/y
Asian Equity Indices/Futures (00:00ET)
Nikkei +0.2%, Hang Seng +0.6%, Shanghai Composite +0.8%, ASX200 +0.9%, Kospi +0.3%
Equity Futures: S&P500 flat; Nasdaq +0.1%, Dax +0.1%, FTSE100 +0.2%
FX ranges/Commodities/Fixed Income (00:00ET)
EUR 1.1160-1.1170; JPY 110.95-111.45; AUD 0.7540-0.7560; NZD 0.7200-0.7270
Aug Gold +0.7% at 1,254/oz; Aug Crude Oil +0.1% at $42.55/brl; July Copper -0.1% at $2.59/lb
SPDR Gold Trust ETF daily holdings rise 0.3 tonnes to 854.0 tonnes
(CN) PBOC SETS YUAN MID POINT AT 6.8197 V 6.8193 PRIOR; Weakest Yuan fix since May 31st and 3rd straight weaker setting
(CN) PBOC to inject combined CNY20B v CNY40B prior in 7-day reverse repos
Asia equities notable movers
Australia
Caltex (CTX) +0.6%; Guides H1
Vicinity Centres Re (VCX) -0.9%; CEO transition
Japan
Toshiba (6502) +0.6%; INCJ reportedly plans to take majority 50.1% stake in Toshiba's memory unit in order to keep technology located in Japan as part of consortium's acquisition - NIkkei
Tokyo Gas (9531) +0.2%; To cut gas prices
Takata (7312) -51.6%; Resumes trading
Hong Kong
Citic Dameng Hldg (1091) +9.1%; Guides H1
Wang On Group (1222) +2.7%; Reports FY17
Emperor International Holdings (163) -1.5%; Reports FY17
HKR International (480) -1.6%; Reports FY17
Singamas (716) -5.5%; Guides H1
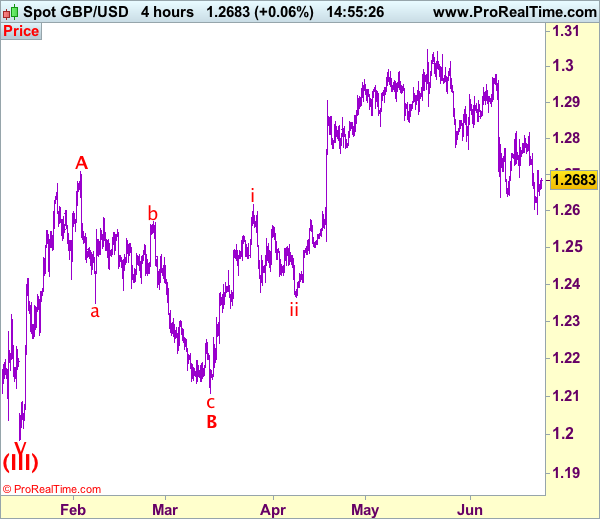
Trade Idea: GBP/USD – Hold short entered at 1.2675
GBP/USD – 1.2673
Recent wave: Wave V of larger degree wave (III) has ended at 1.1986 and major correction has commenced from there for gain to 1.3000 and 1.3140-50
Trend: Near term down
Original strategy :
Sold at 1.2675, Target: 1.2525, Stop: 1.2735
Position: - Short at 1.2675
Target: - 1.2525
Stop: - 1.2735
New strategy :
Hold short entered at 1.2675, Target: 1.2525, Stop: 1.2735
Position: - Short at 1.2675
Target: - 1.2525
Stop:- 1.2735
As sterling has rebounded after yesterday’s marginal fall to 1.2589, suggesting consolidation above this level would be seen, however, as long as previous support at 1.2723 holds, bearishness remains for another decline, below said support at 1.2589 would add credence to our view that recent decline from 1.3048 top has resumed for retracement of early upmove to 1.2550, then towards previous support at 1.2515 but loss of near term downward momentum should prevent sharp fall below 1.2490-00 and reckon 1.2450-60 would hold.
Our preferred count on the daily chart is that cable's rebound from 1.3500 (wave (A) trough) is unfolding as a wave (B) with A ended at 1.7043, followed by triangle wave B and wave C as well as wave (B) has ended at 1.7192, the subsequent selloff is the larger degree wave (C) which is still unfolding with minor wave (III) of larger degree wave 3 ended at 1.1986, hence wave (IV) correction is in progress which could either be a triangle wave (IV) of a complex formation but upside should be limited to 1.3500 and price should falter well below 1.4000, bring another decline in wave (V) of 3 for weakness to 1.1500, then 1.1200.
On the upside, expect recovery to be limited to 1.2700 and bring another decline. Above previous support at 1.2723 would defer and risk a stronger rebound to 1.2758 but break of this resistance is needed to signal a temporary low is formed instead, risk test of 1.2818 resistance later.
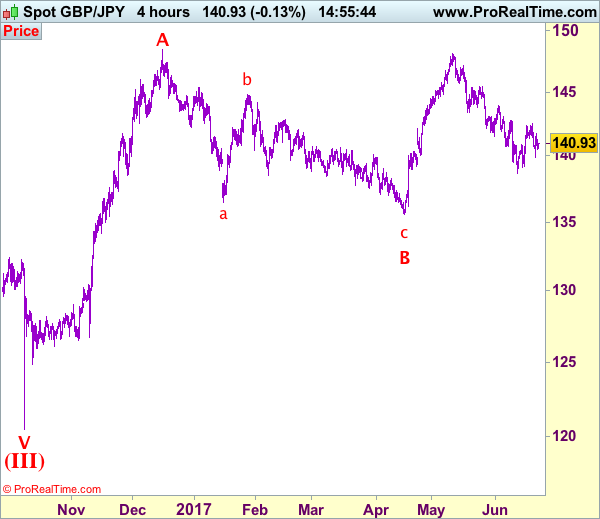
Trade Idea: GBP/JPY – Stand aside
GBP/JPY - 140.80
Recent wave: Medium term low formed at 120.50 and (A)-(B)-(C) major correction has commenced with (A) leg ended at 148.45, hence wave (B) is unfolding for retreat to 131.00-10.
Trend: Near term down
Original strategy:
Exit long entered at 141.50,
Position: - Long at 141.50
Target: -
Stop: -
New strategy :
Stand aside
Position: -
Target: -
Stop:-
Although sterling rebounded after finding support at 139.85 yesterday, break of 141.75-80 is needed to revive bullishness and signal the retreat from 142.50 has ended, bring another test of this level. Once this resistance is penetrated, this would signal the erratic rise from 138.70 is still in progress or test of indicated previous resistance at 142.75, above there would signal recent decline has ended and encourage for at least a strong retracement of recent selloff to 143.05-10.
On the downside, below said support at 139.85 would suggest the rebound from 138.70 has ended there and downside risk remains for weakness towards support at 139.15, however, break there is needed to add credence to this view and signal recent decline has resumed for retest of 138.70, then towards 138.00-10 later which is likely to hold from here due to near term oversold condition.
Our preferred count is that larger degree wave V with circle is unfolding from 251.12 with wave (I) 219.34, (II): 241.38 and wave (III) is subdivided into 1: 192.60, 2: 215.89 (23 Jul 2008) and wave 3 ended at 118.87 earlier in 2009. The correction from there to 162.60 is wave 4 which itself is a double three and is labeled as first a-b-c ended at 151.53, followed by wave x at 139.03, 2nd a ended at 162.60, 2nd b at 146.75 and 2nd c leg of wave 4 ended at 163.00. Therefore, the decline from 163.00 to 116.85 is now treated as wave 5 which also marked the end of larger degree wave (III), hence wave (IV) major correction has commenced for retracement of the wave (III) from 241.38 and upside target at 183.95-00 (50% Fibonacci retracement of the wave (II) from 241.38) had been met, a drop below 160.00 would suggest wave (IV) has ended at 195.85, bring decline in wave (V) for initial weakness to 130 (already met) and 120.
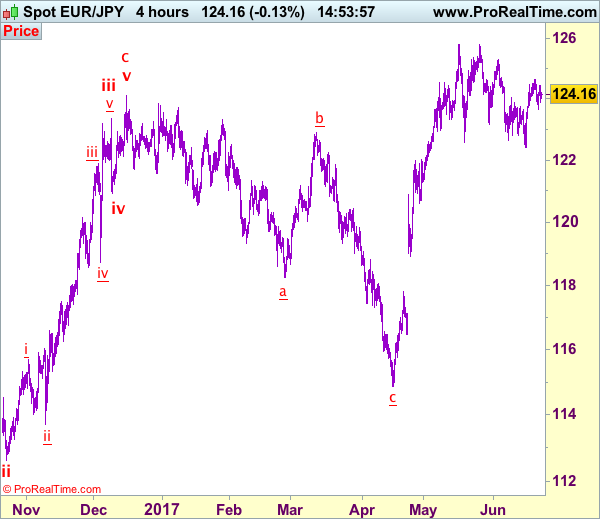
Trade Idea: EUR/JPY – Hold long entered at 123.80
EUR/JPY - 124.03
Recent wave: wave v of (C) ended at 94.12 and major correction in wave A has ended at 149.79
Trend: Near term up
Original strategy:
Bought art 123.80, Target: 125.30, Stop: 123.20
Position: - Long at 123.80
Target: - 125.30
Stop: - 123.20
New strategy :
Hold long entered at 123.80, Target: 125.30, Stop: 123.20
Position: - Long at 123.80
Target: - 125.30
Stop:- 123.20
Euro’s retreat after meeting resistance at 124.65 earlier this week suggests consolidation below this level would be seen, however, as long as 123.20-25 holds, prospect of another rise remains, above said resistance at 124.65 would signal recent upmove from 122.40 (last week’s low) is still in progress and may extend further gain to 125.00 but break of resistance at 125.31 is needed to retain upside bias and signal correction from 125.82 has ended at 122.40, bring subsequent rise towards this level which is likely to hold on first testing.
In view of this, we are holding on to our long position entered at 123.80. Below 123.20-25 would defer and suggest first leg of rebound from 122.40 has ended instead, risk further weakness to 122.90-00 but price should stay well above said support at 122.40, bring another rebound later.
Our latest preferred count is that wave (ii) is ABC-X-ABC which ended at 123.33 and wave (iii) is unfolding with wave iii ended at 100.77, followed by wave iv at 111.57 and wave v as well as the wave (iii) has ended at 97.04, followed by wave (iv) at 111.43 and wave (v) has ended at 94.12 which is also the end of the larger degree v, this also implied the major wave (C) has also ended there, hence major correction has commenced from there with (A) leg unfolding in its lower degree wave c which has possibly ended at 145.69. Under this count, A-B-C wave (B) has commenced with A leg ended at 136.23, wave B at 143.79 and wave C has possibly ended at 149.79.
Our larger degree count is that the decline from 139.26 is wave (C) and is sub-divided into a diagonal triangle i-ii-iii-iv-v with wave i - 105.44, wave ii- 123.33, wave iii - 97.03, wave iv - 111.43, followed by the final wave v as well as the end of wave (C) at 94.12, this also mark the bottom of larger degree wave B. Under this count, major rise in wave C has commenced as an impulsive wave with minor wave III ended at 145.69, wave V is still in progress for further gain to 150.00. Having said that, this so-called wave V could well be the first leg of larger degree 5-waver wave C and this wave C should bring at least a retest of wave A top at 169.97 (July 2008).
Trade Idea: AUD/USD – Hold long entered at 0.7595
AUD/USD – 0.7555
Recent wave: Wave 5 ended at 1.1081 and major correction has commenced for fall to 0.7000 and then towards 0.6500-10
Trend: Near term up
Original strategy :
Bought at 0.7595, Target: 0.7745, Stop: 0.7535
Position: - Long at 0.7595
Target: - 0.7745
Stop: - 0.7535
New strategy :
Hold long entered at 0.7595, Target: 0.7745, Stop: 0.7535
Position: - Long at 0.7595
Target: - 0.7745
Stop:- 0.7535
Yesterday’s retreat has kept aussie under near term pressure and 0.7535 needs to hold to retain prospect of another rise, above 0.7600 would bring test of indicated resistance at 0.7636, break there would confirm recent upmove has resumed and extend the rise from 0.7329 towards previous resistance at 0.7680 but loss of momentum should limit upside to chart resistance at 0.7750 and price should falter below 0.7785-90.
In view of this, we are holding on to our long position entered at 0.7595. Below 0.7535 would defer and suggest top is possibly formed, bring correction to 0.7515-20, break there would provide confirmation, then correction to 0.7490-95 and possibly towards support at 0.7457 would be seen later.
On the 4-hour chart, the move from 0.8066 is the wave 5 with i: 0.8860, ii: 0.8315, wave iii is an extended move ended at 1.0183, iv: 0.9706 and wave v has ended at 1.1081 (also the top of entire wave 5). The subsequent selloff is the major correction which is unfolding as ABC-X-ABC and 2nd A leg has ended at 0.8848, followed by a-b-c wave B which ended at 0.9758, hence, 2nd C wave is now in progress and indicated downside target at 0.7000 and 0.6950 had been met, so further fall to 0.6710-20 cannot be ruled out.

Aussie Trading Marginally Lower In The Morning Session
For the 24 hours to 23:00 GMT, the AUD declined 0.32% against the USD and closed at 0.7549.
LME Copper prices declined 0.4% or $23.5/MT to $5650.0/MT. Aluminium prices declined 1.2% or $23.5/MT to $1865.5/MT.
In the Asian session, at GMT0300, the pair is trading at 0.7548, with the AUD trading a tad lower against the USD from yesterday's close.
The pair is expected to find support at 0.7534, and a fall through could take it to the next support level of 0.7520. The pair is expected to find its first resistance at 0.7569, and a rise through could take it to the next resistance level of 0.7590.
The currency pair is trading below its 20 Hr and 50 Hr moving averages.

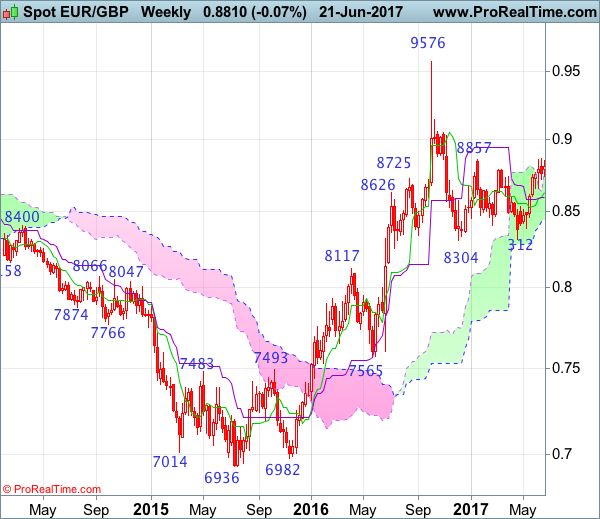
EUR/GBP Candlesticks and Ichimoku Analysis
Weekly
• Last Candlesticks pattern: N/A
• Time of formation: N/A
• Trend bias: Near term up
Daily
• Last Candlesticks pattern: Hammer
• Time of formation: 3 Feb 2016
• Trend bias: Up
EURGBP – 0.8677
Although the single currency found support at 0.8719 and has rebounded, break of recent high at 0.8866 is needed to confirm our bullish view that recent rise from 0.8304 low is still in progress and upside bias remains for this move to extend further gain to 0.8900, however, near term overbought condition should prevent sharp move beyond 0.8940-50 (50% Fibonacci retracement of 0.9576-0.8304) and reckon psychological resistance at 0.9000 would hold from here, price should falter well below 0.9090 (61.8% Fibonacci retracement), bring retreat later.
On the downside, if said resistance at 0.8866 continues to hold, then further consolidation would be seen and another retreat to 0.8719 cannot be ruled out, however, reckon downside would be limited to 0.8680-85 and bring another rise later. A daily close below support at 0.8652 would abort and suggest a temporary top is formed instead, bring retracement of recent upmove to 0.8590-95, then 0.8550 but reckon previous support at 0.8524 would hold from here, bring rebound later.
Recommendation: Buy again at 0.8680 for 0.8880 with stop below 0.8580.
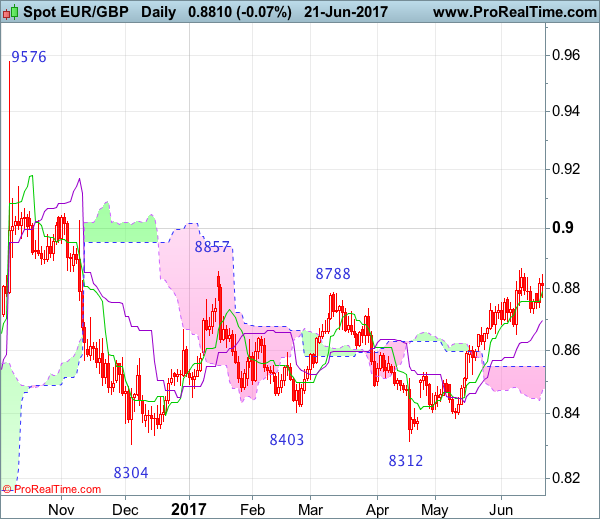
On the weekly chart, as the single currency has continued trading with a firm undertone, adding credence to our bullishness for the erratic rise from 0.8304 low to extend gain to 0.8840-50 (50% Fibonacci retracement of 0.9576-0.8304), then 0.8900-10, however, reckon upside would be limited to 0.9000 and 0.9045-50 should hold from here, price should falter well below 0.9090 (61.8% Fibonacci retracement), risk from there has increased for a retreat to take place later this month.
On the downside, although pullback to 0.8715-20 cannot be ruled out, reckon support at 0.8652 would hold and bring another rise to aforesaid upside targets. A weekly close below the Kijun-Sen (now at 0.8589) would defer and suggest top is possibly formed, risk weakness to 0.8550 but a drop below previous resistance at 0.8531 is needed to add credence to this view, bring further fall to 0.8490-00, then towards support at 0.8457 which is likely to hold from here. \
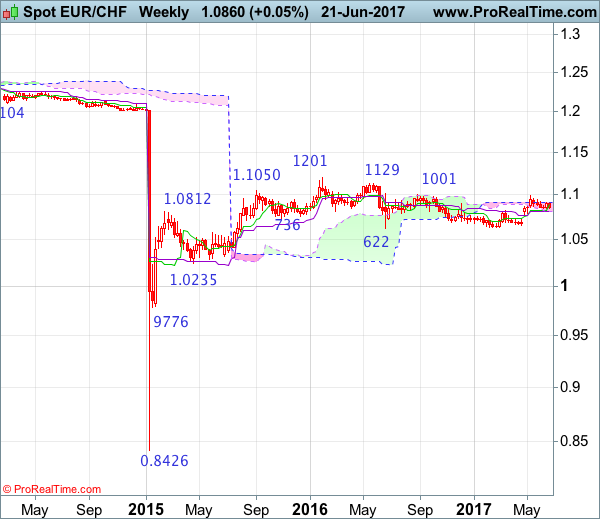
EUR/CHF Candlesticks and Ichimoku Analysis
Weekly
• Last Candlesticks pattern: Doji
• Time of formation: 20 Feb 2017
• Trend bias: Up
Daily
• Last Candlesticks pattern: Doji
• Time of formation: 1 Sep 2016
• Trend bias: Near term down
EUR/CHF – 1.0863
Failure to extend early rebound from 1.0838 and the subsequent retreat from 1.0910 suggest consolidation would be seen, however, as long as said support at 1.0838 holds, mild upside bias remains for another bounce to said resistance but a break of resistance at 1.0949 is needed to signal the pullback from 1.0988 has ended, bring test of 1.0960, break there would suggest upmove has resumed for retest of 1.0988, then towards previous resistance at 1.1001. Looking ahead, only a break there would retain bullishness and encourage for headway to 1.1050-60, then 1.1100, having said that, price should falter below another previous resistance at 1.1201.
On the downside, below 1.0838 support would risk test of previous support at 1.0792 but only a daily close below there would signal top is formed at 1.0988 instead, bring subsequent fall to 1.0750 and then towards 1.0700-10, having said that, support at 1.0671 should remain intact, the single currency shall stage another rebound from there later this month.
Recommendation: Hold long entered at 1.0865 for 1.1065 with stop below 1.0835.

On the weekly chart, despite this week’s initial marginal gain to 1.0910, lack of follow through buying and the subsequent retreat suggest consolidation would be seen and indicated support at 1.0838 needs to hold to retain prospect of another rebound, above 1.0910 would bring test of 1.0949 resistance but break there is needed to signal the pullback from 1.0988 has ended, bring retest of this level, above there would extend recent upmove from 1.0631 to previous resistance at 1.1001, a sustained breach above this level would signal the fall from 1.1201 has ended, bring further gain to 1.1100 and possibly test of resistance at 1.1129 but price should falter below said recent high at 1.1201.
On the downside, a break of said support at 1.0838 would risk test of the Kijun-Sen (now at 1.0810) but only break of previous support at 1.0780 would abort and signal top has been formed at 1.0988 instead, bring further weakness to 1.0720, however, still reckon support at 1.0656 would remain intact, bring another rebound later.
Euro Trading A Tad Higher, Ahead Of The ECB’s Economic Bulletin Report
For the 24 hours to 23:00 GMT, the EUR rose 0.29% against the USD and closed at 1.1167.
In the US, data showed that existing home sales unexpectedly advanced 1.1% to a level of 5.62 million on a monthly basis in May, defying investor consensus for a drop to a level of 5.55 million. In the previous month, existing home sales had recorded a revised reading of 5.56 million. Also, the nation's MBA mortgage applications climbed 0.6% in the week ended 16 June 2017, following a rise of 2.8% in the prior week.
In the Asian session, at GMT0300, the pair is trading at 1.1170, with the EUR trading slightly higher against the USD from yesterday's close.
The pair is expected to find support at 1.1141, and a fall through could take it to the next support level of 1.1113. The pair is expected to find its first resistance at 1.1185, and a rise through could take it to the next resistance level of 1.1201.
Ahead in the day, investors will keep a close watch on the European Central Bank's (ECB) economic bulletin report and the Euro-zone's flash consumer confidence data for June. Moreover, in the US, house price index for April, leading indicators for May and initial jobless claims data, will attract market attention.
The currency pair is trading above its 20 Hr and 50 Hr moving averages.
