Sample Category Title
Gold Analysis: Reaches 55-Hour SMA
The Tuesday morning forecast fulfilled itself only on Wednesday morning, as the US Dollar attempted to score additional gains during the second half of Tuesday's trading. However, on Wednesday morning the bullion reached the resistance of the 55-hour SMA near the 1,247.50 mark. Day traders were and will be watching this level of significance. The reason for that is that it could force the metal to make another attempt to pass the support at 1,243.59 level. On the other hand, if the resistance of the SMA is broken, the commodity price might surge above the 1,250 mark, as the closest resistance is located at the descending 100-hour SMA just above the mentioned level.
Bank Of England Governor Mark Carney Delivers Speech At Mansion House Dinner
'Before long, we will all begin to find out the extent to which Brexit is a gentle stroll along a smooth path to a land of cake and consumption.' — Mark Carney, Bank of England
The Bank of England Governor Mark Carney delivered a speech on Tuesday at the Mansion House dinner in London. The Governor said that the potential movement of the Euro-clearing centre from London to another EU-based city amid Britain's withdrawal from the European Union would likely lead to higher costs for participants and do little for the region's financial stability. Last week the European Commission proposed to move all Euro-clearing businesses away from London after the UK leaves the EU in 2019. The European Commission said that the following step would likely sustain financial stability in the region. In the meantime, Carney urged the EU to develop together a new form of cross-border supervisory cooperation, highlighting the high importance of free trade in financial services. Apart from that, the Governor stated that policymakers would proceed tolerating the inflation rate above the 2% target 'to see the extent to which weaker consumption growth is offset by other components of demand' and assess both wage and economic growth and, thus, leave interest rates on hold.
Trade Idea: AUD/USD – Hold long entered at 0.7595
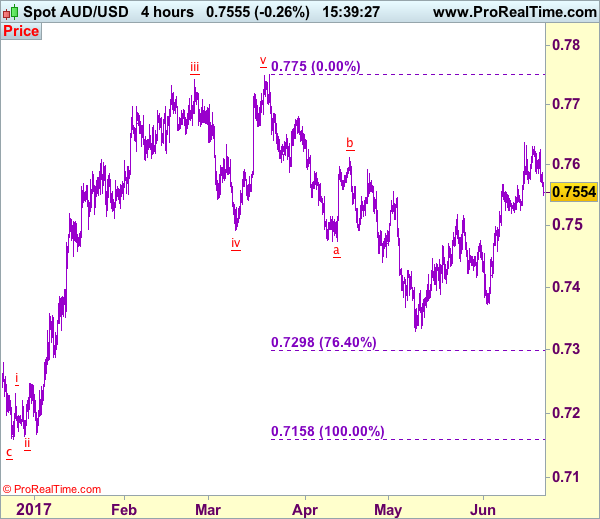
AUD/USD – 0.7554
Recent wave: Wave 5 ended at 1.1081 and major correction has commenced for fall to 0.7000 and then towards 0.6500-10
Trend: Near term up
Original strategy :
Bought at 0.7595, Target: 0.7745, Stop: 0.7535
Position: - Long at 0.7595
Target: - 0.7745
Stop: - 0.7535
New strategy :
Hold long entered at 0.7595, Target: 0.7745, Stop: 0.7535
Position: - Long at 0.7595
Target: - 0.7745
Stop:- 0.7535
Current retreat has dampened our bullishness and 0.7535 needs to hold to retain prospect of another rise, above 0.7600 would bring test of indicated resistance at 0.7636, break there would confirm recent upmove has resumed and extend the rise from 0.7329 towards previous resistance at 0.7680 but loss of momentum should limit upside to chart resistance at 0.7750 and price should falter below 0.7785-90.
In view of this, we are holding on to our long position entered at 0.7595. Below 0.7535 would defer and suggest top is possibly formed, bring correction to 0.7515-20, break there would provide confirmation, then correction to 0.7490-95 and possibly towards support at 0.7457 would be seen later.
On the 4-hour chart, the move from 0.8066 is the wave 5 with i: 0.8860, ii: 0.8315, wave iii is an extended move ended at 1.0183, iv: 0.9706 and wave v has ended at 1.1081 (also the top of entire wave 5). The subsequent selloff is the major correction which is unfolding as ABC-X-ABC and 2nd A leg has ended at 0.8848, followed by a-b-c wave B which ended at 0.9758, hence, 2nd C wave is now in progress and indicated downside target at 0.7000 and 0.6950 had been met, so further fall to 0.6710-20 cannot be ruled out.
GDT Price Index Posts First Drop After Six Straight Gains
'On the supply side, there have been renewed uncertainties surrounding Chinese demand for Whole Milk Powder with a growing demand for more value-added produce such as butter.' — Tom Clayton, Economic Calendar
Dairy product prices dropped slightly at Tuesday's Global Dairy Trade auction, the first decrease after six consecutive gains. The GDT Price Index fell 0.8%, following a rise of 0.6% posted at the preceding auction. According to data published, there were 111 winning bidders, while the event lasted about three hours. Some 21 million tonnes of dairy products were sold. That was 3.8% less than at the previous auction held two weeks ago. The price of skimmed milk powder advanced 1.4% to $2,218 per tonne, whereas the price of whole milk powder dropped 3.3% to $3,022 per tonne. Prices of butter climbed 2.9% to $5,768 per tonne, while the cheddar price declined 3.8% to $4,121 per tonne. The price of lactose plunged 11.1% to $869 per tonne, whereas the rennet casein price dropped 8.0% to $6,104 per tonne. Meanwhile, butter milk powder was not traded at the auction. Despite the latest auction's drop, dairy product prices remained above their December highs. According to analysts, it will be highly crucial to keep prices in the following support area through the winter in order to support the underlying outlook.
Technical Outlook: GBPUSD – Bearish Bias Eisks Extension To 200SMA/Daily Cloud Base Targets
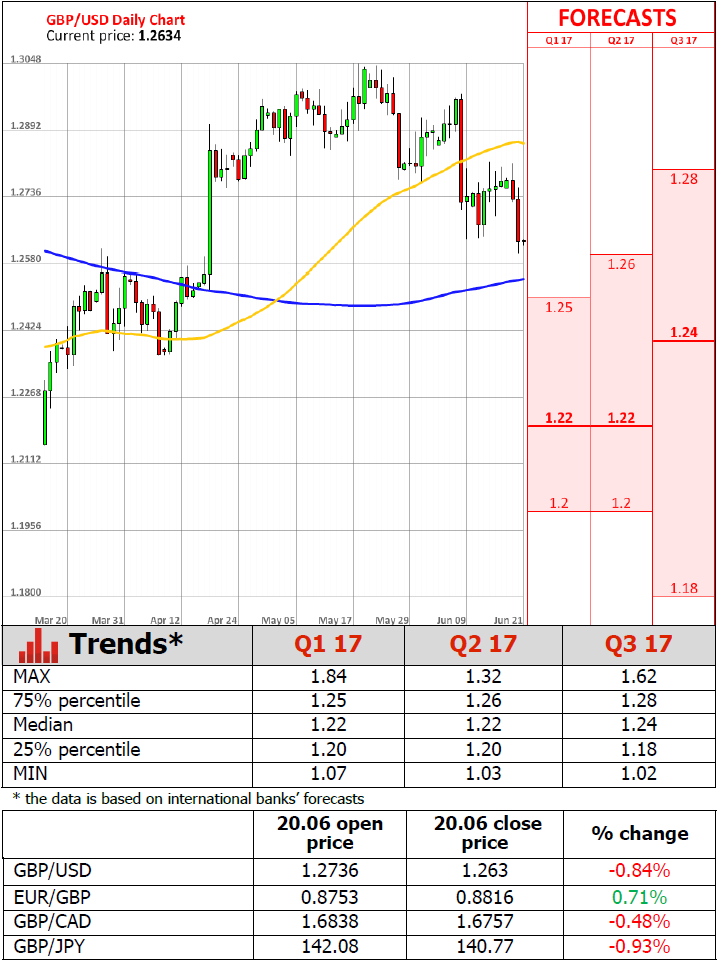
Cable traded within narrow consolidation range between Tuesday's fresh two-month low at 1.2602 and broken 100SMA at 1.2630, which capped the action during Asian session.
The pair maintains bearish bias, following strong fall on Tuesday and risks further downside.
Close below 1.2626 (Fibo 61.8% of 1.2365/1.3047), which Tuesday's bearish acceleration failed to clear, will generate another bearish signal for extension towards targets and strong supports at 1.2552/49 (200SMA/daily cloud base).
Initial resistance at 1.2630 limited recovery attempts so far and kept intact next barriers at 1.2660 and 1.2700. After dovish comments from BoE's Governor Carney on Tuesday, Sterling is looking for comments from BoE's chief economist and MPC member Haldane (who is seen as one of the MPC's most dovish members) at 11:00 GMT.
Res: 1.2630, 1.2660, 1.2700, 1.2734
Sup: 1.2600, 1.2552, 1.2549, 1.2526
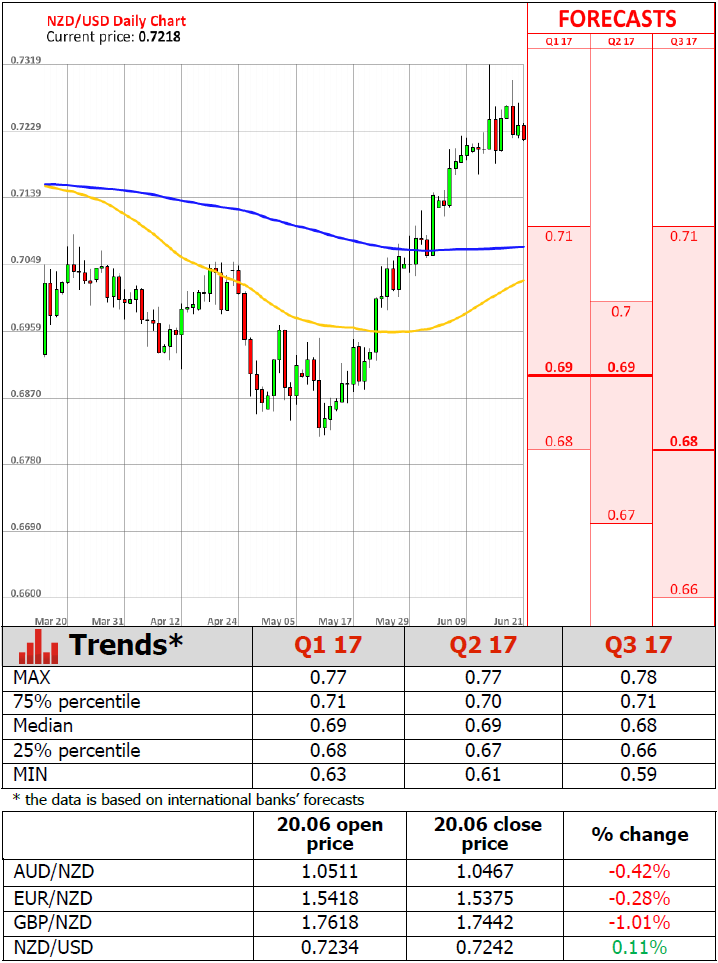
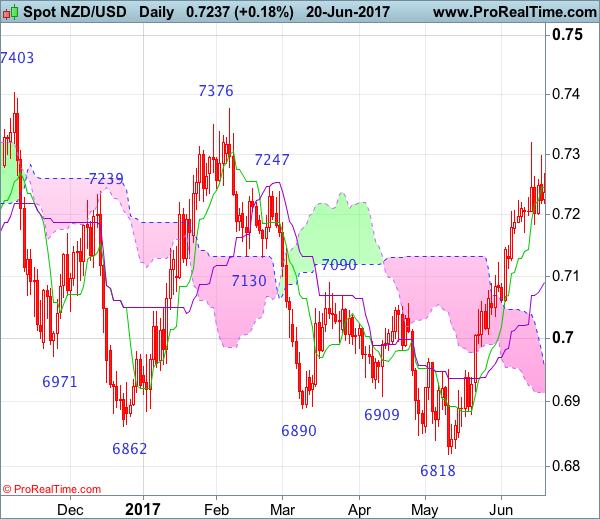
NZD/USD Candlesticks and Ichimoku Analysis
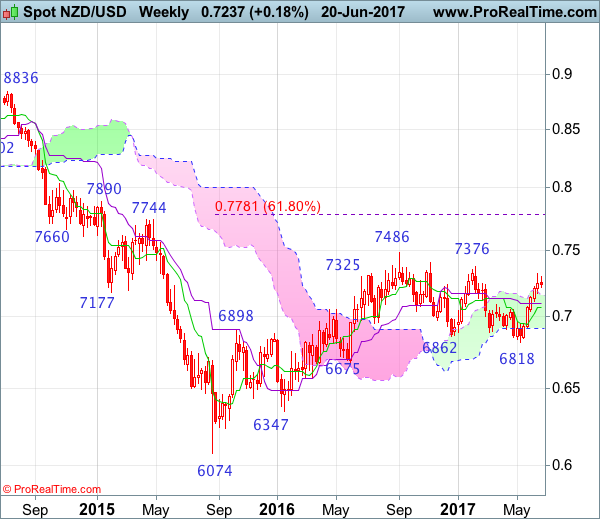
Weekly
• Last Candlesticks pattern: Shooting star
• Time of formation: 5 Sep 2016
• Trend bias: Down
Daily
• Last Candlesticks pattern: Hammer
• Time of formation: 14 Mar 2017
• Trend bias: Near term up
NZD/USD – 0.6974
Although kiwi surged to as high as 0.7320 last week, the subsequent retreat suggests consolidation below this level would be seen and pullback to 0.7170-75 cannot be ruled out, however, reckon the Kijun-Sen (now at 0.7091) would limit downside and bring another rise later, above said resistance at 0.7320 would signal the rise from 0.6818 low has resumed and extend gain to previous resistance at 0.7376, having said that, loss of near term upward momentum should prevent sharp move beyond 0.7400 and price should falter below previous chart resistance at 0.7486.
On the downside, whilst initial pullback to 0.7170-75 cannot be ruled out, reckon downside would be limited to 0.7100 and bring another rise later. A daily close below the Kijun-Sen (now at 0.7091) would defer and suggest a temporary top is formed, bring weakness to 0.7050-55 and possibly towards 0.7005-10 but reckon downside would be limited to 0.6985-90 and previous resistance at 0.6950 should remain intact, bring another upmove later.
Recommendation: Buy at 0.7100 for 0.7300 with stop below 0.7000.
On the weekly chart, as kiwi has eased after rising to 0.7320, suggesting minor consolidation below this level would be seen and pullback to 0.7170-75, then towards 0.7100-10 cannot be ruled out, however, the Kijun-Sen (now at 0.7097) should hold and bring another rise later, above said resistance at 0.7320 would extend the rise from 0.6818 to previous resistance at 0.7376, having said that, break there is needed to retain bullishness and signal the erratic decline from 0.7486 top has ended earlier, bring subsequent headway to 0.7400-10 but price should falter below said recent high, bring retreat later.
On the downside, although pullback to 0.7170-75 is likely, reckon the Kijun-Sen (now at 0.7097) would limit downside and bring another rise later. Only below support at 0.7035 would suggest top is possibly formed, risk test of 0.7000 but downside should be limited to 0.6950 and bring another rebound later. Below 0.6915-20 would defer and suggest the rebound from 0.6818 has possibly ended instead, risk further fall to 0.6880 first but said recent low at 0.6820 should hold on initial testing.
WTI Oil Bearish At 7-Month Lows, Further Downside Expected
WTI oil touched a 7-month low of $42.91 on Tuesday. Prices have been showing persistent signs of weakness since falling from the February 21 high of $55 a barrel and have retreated into bear-market territory after a 20% drop from this peak.
Looking at the technical indicators, the short-term 50-day moving average crossed below the longer-term 200-day MA on May 16, giving a bearish signal. The 50-day MA is falling.
Momentum indicators are bearish and are showing increased risk to the downside. RSI is below 50 and MACD is below zero.
After touching $42.91, prices paused their decline, making this level a support level. It is close to the November 14 low and has also provided support several times in the past. Meanwhile, it is also the 61.8% Fibonacci retracement level of the upleg from $35.24 to $55.40 (April to December 2016 uptrend). Below this, the August 3 low at $40 comes into view as an important support level before reaching the April 5 low at $35.24.
To the upside, resistance is expected at $45.24, this week's high and close to the 50% Fibonacci. The 38.2% Fibonacci level at $47.67 is another resistance. Surpassing this level would target the key $50 mark. Prices would have to rise above $50 in order to weaken the short-term bearish bias. This move would also bring the market above the 200-day MA average, giving it a more bullish bias.
The medium-term outlook is bearish and this is highlighted by the fact that the market has been carving out lower peaks and lower toughs since February. Looking at the bigger picture, as long as the market trades between $40 and $50, the bias is neutral.
AUD/USD Candlesticks and Ichimoku Analysis
Weekly
• Last Candlesticks pattern: Shooting doji
• Time of formation: 20 Feb 2017
• Trend bias: Sideways
Daily
• Last Candlesticks pattern: Bearish engulfing pattern
• Time of formation: 21 Mar 2017
• Trend bias: Near term down
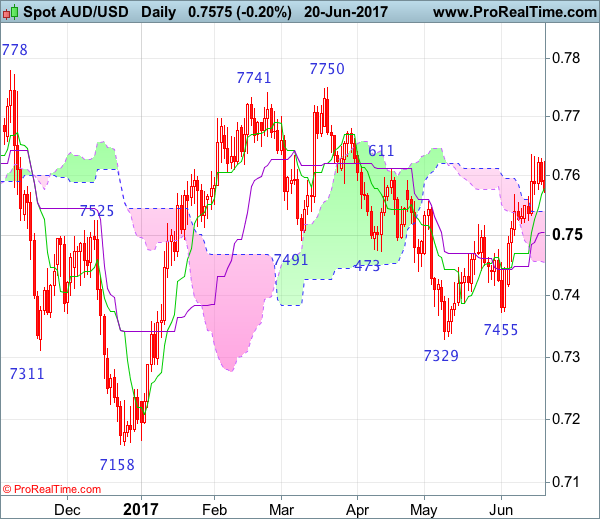
As aussie met resistance at 0.7636 last week and has eased, suggesting minor consolidation below this level would be seen and pullback to 0.7540-50, then 0.7515-20 cannot be ruled out, however, reckon the Kijun-Sen (now at 0.7510) would remain intact and bring another rise later, above said resistance at 0.7636 would extend recent upmove from 0.7329 low to previous resistance at 0.7680, having said that, aussie needs to break this level to signal the fall from 0.7750 top has ended and bring subsequent retest of said chart resistance at 0.7750.
On the downside, whilst initial pullback to 0.7550 cannot be ruled out, reckon the Kijun-Sen (now at 0.7510) would limit downside and bring another rise later. Below 0.7455-60 would defer and risk weakness towards 0.7400-10 but support at 0.7372 should remain intact. Looking ahead, only below 0.7372 would revive bearishness and suggest the rebound from 0.7329 has ended, bring retest of this level, break there would extend recent fall from 0.7750 top to 0.7300 and possibly 0.7250-60 but reckon downside would be limited to 0.7200-10 and price should stay well above indicated previous chart support at 0.7158.
Recommendation: Buy at 0.7510 for 0.7710 with stop below 0.7410.
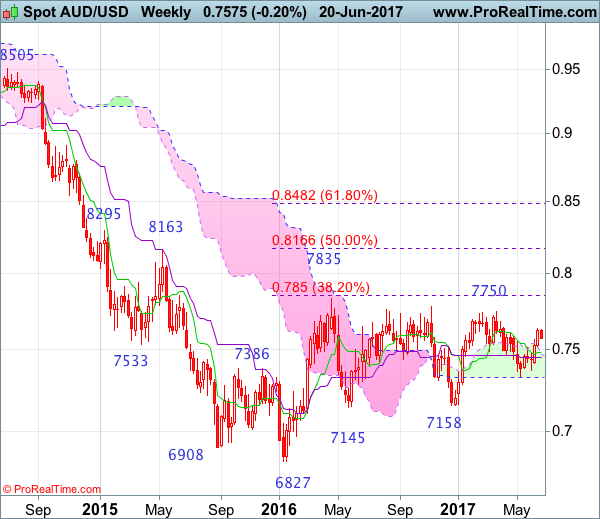
On the weekly chart, aussie has surged again last week and another white candlestick was formed, adding credence to our view that the retreat from 0.7750 has ended at 0.7329 and consolidation with upside bias remains for further gain to 0.7680, however, break there is needed to add credence to this view and bring retest of this level later. Looking ahead, only a break above 0.7750 would another leg of the major rise from 0.6827 low is underway for retest of 0.7778, then towards last year’s high at 0.7835.
On the downside, expect pullback to be limited to 0.7500-10 and bring another rise. Below the Kijun-Sen (now at 0.7454) would prolong consolidation and risk weakness to 0.7410-15 but break of support at 0.7372 is needed to signal the rebound from 0.7329 has ended, bring retest of this level first. A break below there would extend recent decline from 0.7750 to 0.7290-00 and possibly towards 0.7230, however, downside should be limited to 0.7200 and price should stay well above previous support at 0.7158, risk from there is seen for a rebound to take place later.
Shifting Technical Bias Points To Near-Term EUR Bullishness
Key Points:
- A near-term reversal is now likely given the technical bias.
- Any potential rally is likely to be limited to the 1.12 handle.
- Monitor the EU data as the week closes.
The Euro has been declining fairly consistently over the past few weeks but the bears may have finally met their match in the 1.1123 support level. As a result, a reversal may finally be back on the cards and this could potentially see the EURUSD make a beeline for the 1.12 handle in the days ahead.
Nevertheless, before we take a look at where the Euro could rally to, it’s prescient to look at exactly why a reversal is expected in the first place. First and foremost, it is the apparent robustness of the current level of support around the 1.1123 handle that gives us our initial clue that upsides are on the way. Indeed, looking back historically, this price has proven to be a reversal point on multiple occasions – most notably in the latter stages of last year. More recently, this level has shown a similar degree of rigidity and refused to give in to selling pressure.
However, a strong support level doesn't necessarily translate into a near-term uptrend every time which could mean that we will simply see losses stall going forward. Luckily for us, numerous other technical readings are intimating that a sizable rally is actually warranted. For one thing, the EMA bias is, quite patently, highly bullish even in the wake of a fortnight of losses. Furthermore, stochastics are overbought which means some buying pressure is likely to be seen shortly.
One final bit of technical analysis to consider is the current Bollinger band reading, depicted on the above chart. Currently, price action rests not only on the 38.2% Fibonacci level but also right on top of the lower band. Ordinarily, this signals that the pair is primed to move back towards the basis line which is, in this case, around the 1.12 handle
Overall, the technicals paint a rather bullish picture which should mean that a recovery is going to occur shortly. However, this recovery is unlikely to erode all of the recently incurred losses and should be limited to around the 1.12 handle. This is due, in part, to the basis line of the Bollinger bands but also to the parabolic SAR which has yet to shake its bearish bias. It is also worth noting that a bit of a deluge of EU-specific data is due out as the week closes which could kick start a recovery or delay it depending on the results.
Trade Idea : USD/CHF – Hold long entered at 0.9705
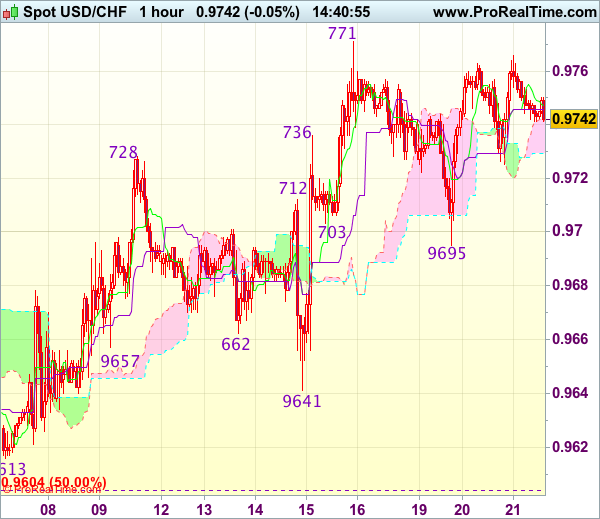
USD/CHF - 0.9745
Most recent candlesticks pattern : N/A
Trend : Near term up
Tenkan-Sen level : 0.9746
Kijun-Sen level : 0.9746
Ichimoku cloud top : 0.9741
Ichimoku cloud bottom : 0.9729
Original strategy :
Bought at 0.9705, Target: 0.9805, Stop: 0.9690
Position : - Long at 0.9705
Target : - 0.9805
Stop : - 0.9690
New strategy :
Hold long entered at 0.9705, Target: 0.9805, Stop: 0.9690
Position : - Long at 0.9705
Target : - 0.9805
Stop : - 0.9690
As the greenback has retreated after faltering below resistance at 0.9771 (last week’s high), suggesting further consolidation below this level would be seen, however, as long as support at 0.9695 holds, bullishness remains for recent upmove to resume after initial sideways trading, break of said resistance at 0.9771 would confirm recent rise from 0.9613 low has resumed for test of resistance at 0.9808 but reckon previous resistance at 0.9825 would hold from here due to near term overbought condition.
In view of this, we are holding on to our long position entered at 0.9705. Below said support at 0.9695 would defer and risk weakness towards said support at 0.9641 but only break there would abort and revive bearishness, this would also suggest the rebound from 0.9613 has ended instead, bring retest of this level later.