Sample Category Title
Macron Maxes Out
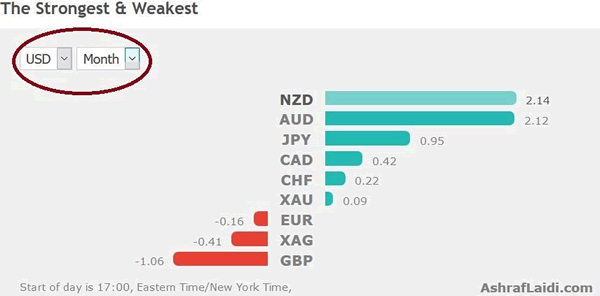
Six month ago Macron was an underdog to win the Presidency but his improbable surge has continued after a massive win in the first round of French parliamentary elections. The Australian dollar was the top performer last week while the pound sterling lagged. CFTC positioning data saw GBP shorts pile in ahead of the election. A new Premium video on the existing Premium trades will be posted mid Monday Asia morning.
Macron's La Republique En Marche won 415-455 seats in the first round of voting, out of a total of 577. The vote for the right wing National Front faded to only 1-5 seats and former President Hollande's Socialist party was decimated, winning only 10-20 seats.
The theme of 2016 in elections was a shift to populism but in 2017 it has turned into more of a shift to the fringes and away from establishment parties and candidates. Corbyn's ability to turn out the vote is as shocking as anything over the past year and may inspire leftist candidates elsewhere.
That sets up years of political drama and the specter of wildly divergent policies in a fragmented world. At the moment, a badly wounded May is attempting to hang on with the backing of the DUP but the knives are out. If she's toppled, the uncertainty will be a fresh reason to sell the pound.
CFTC Commitments of Traders
Speculative net futures trader positions as of the close on Tuesday. Net short denoted by - long by +.
EUR +74K vs +73K prior GBP -37K vs -30K prior JPY -55K vs -52K prior CHF -17K vs -19K prior CAD -94K vs -98K prior AUD 0K vs +3K prior NZD -2K vs -5K prior
The moves of committment of traders were modest this week but at least a few traders got short GBP ahead of Thursday's election and rode that to a quick profit. EUR longs inched to a fresh high dating back to 2007 and CAD shorts remain near a record, highlighting to vulnerability of the pair after another strong jobs report on Friday.
EUR/USD Weekly Outlook
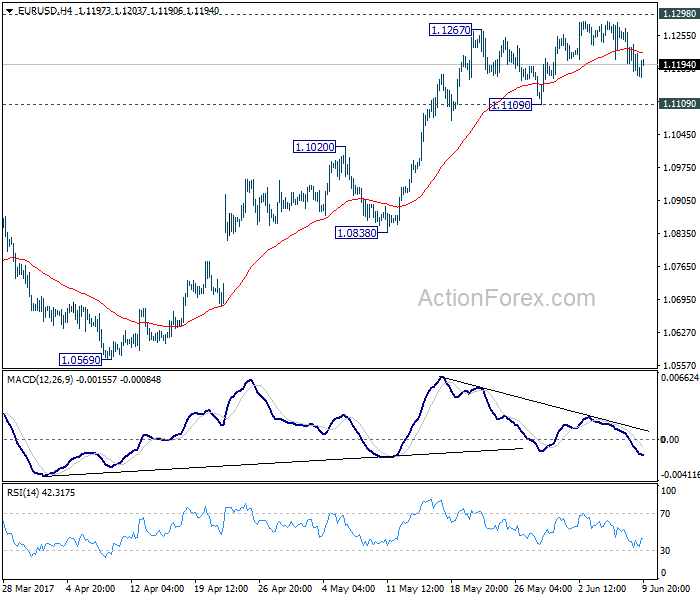
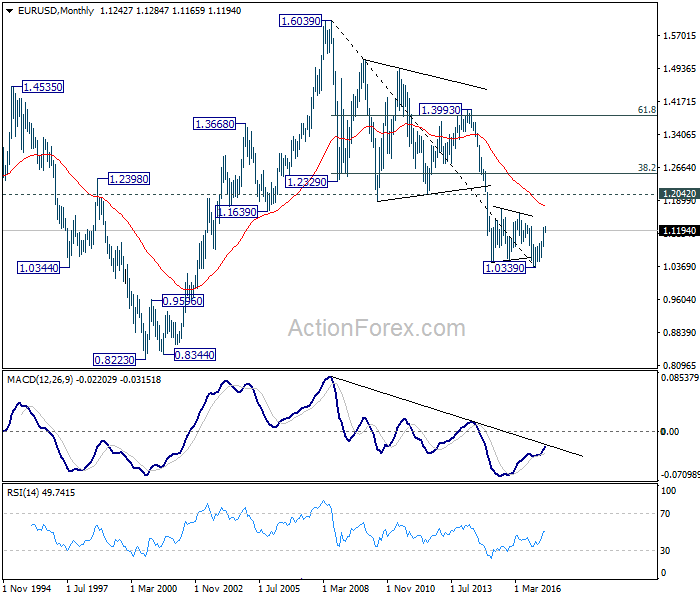
EUR/USD stays in consolidation below 1.1298 key resistance last week. Retreat was so far shallow and contained above 1.1109 support. Outlook is unchanged. Initial bias remains neutral this week first, with focus on 1.1298. Decisive break there will carry larger bullish implication and target 1.1615 resistance next. On the downside, break of 1.1109 support will indicate short term topping and rejection from 1.1298. In such case, intraday bias will be turned to the downside for 1.0838 support.
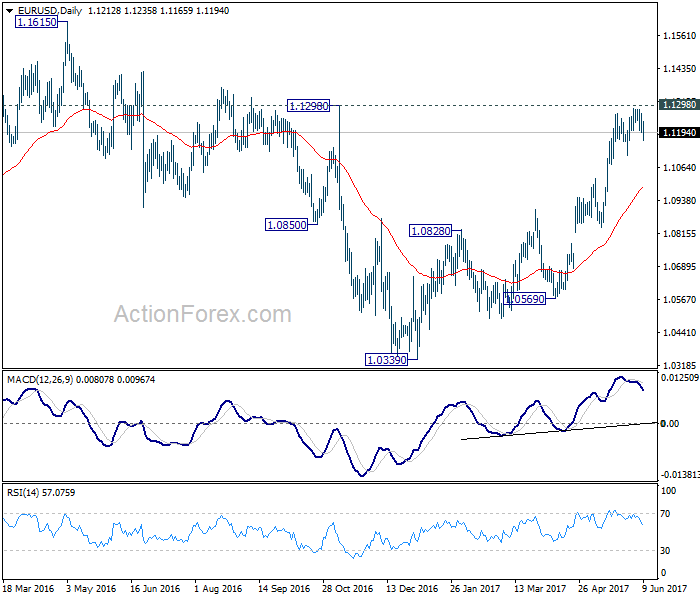
In the bigger picture, the case for medium term reversal continues to build up with EUR/USD staying far above 55 week EMA (now at 1.0922). Also, bullish convergence condition is seen in weekly MACD. Focus will now be on 1.1298 key resistance. Rejection from there will maintain medium term bearishness and would extend the whole down trend from 1.6039 (2008 high). However, firm break of 1.1298 will indicate reversal. In such case, further rally would be seen back to 1.2042 support turned resistance next.
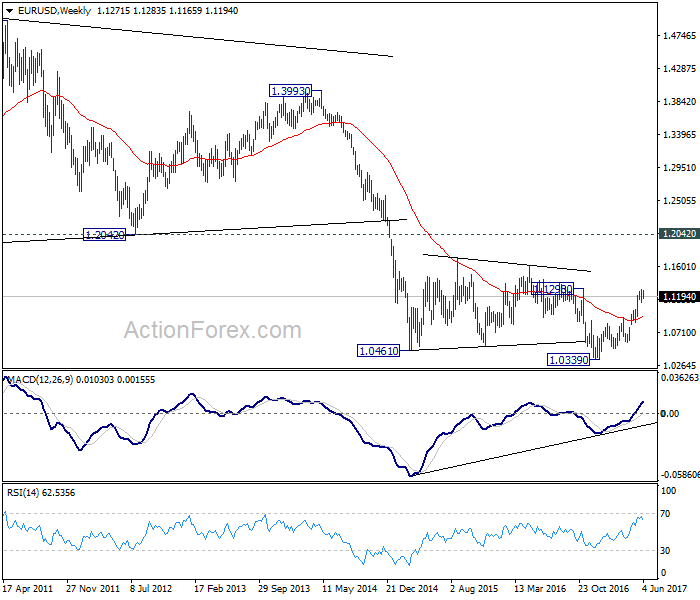
In the long term picture, the case for completion of down trend from 1.6039 (2008 high), and long term bottoming at 1.0339, is starting to build up. Decisive break of 1.1298 will bring rise back to 1.2042 as first resistance. And in that case, we should at least see rally back to 38.2% retracement of 1.6039 to 1.0339 at 1.2516.
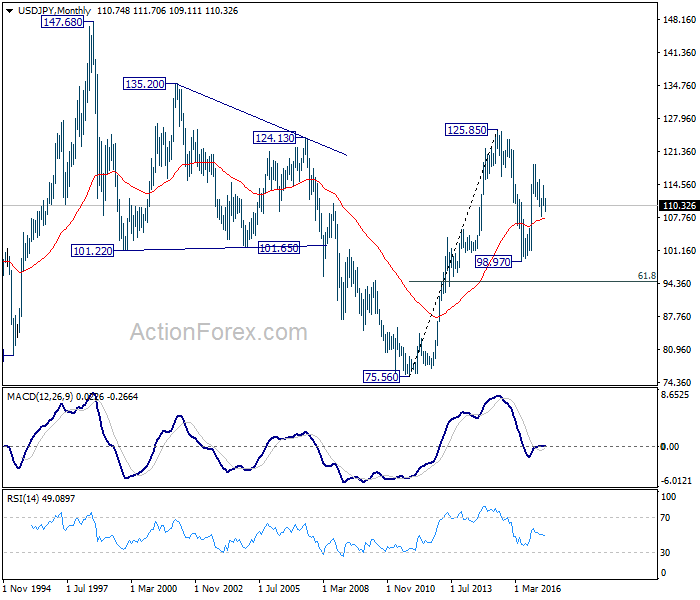
USD/JPY Weekly Outlook
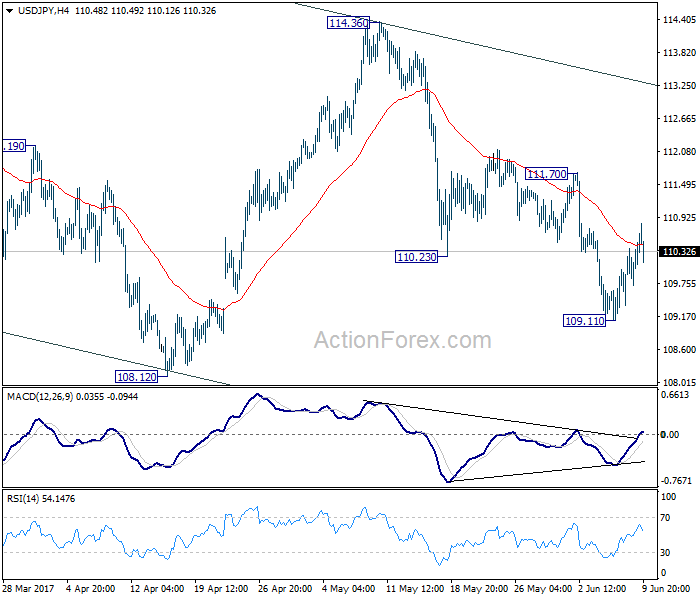
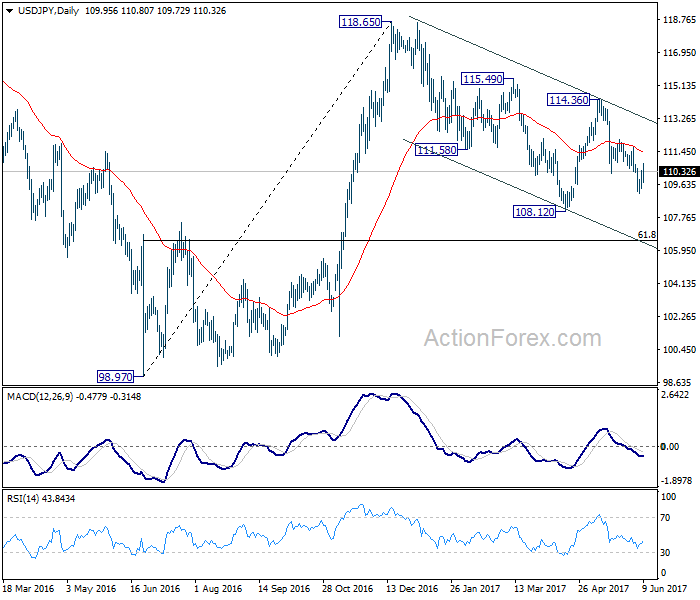
USD/JPY dived to 109.11 last week but rebounded since then. Structure of such rebound is still correctively looking and there is no clear sign of reversal. Initial bias remains neutral this week first. As long as 111.70 resistance holds, near term outlook stays mildly bearish for deeper fall. Below 109.11 will target 108.12 low first. Break will extend the whole corrective fall from 118.65 to 61.8% retracement of 98.97 to 118.65 at 106.48. We will look for bottoming sign there. Meanwhile, break of 110.70 will suggest near term reversal and turn bias back to the upside for 114.36 resistance instead.
In the bigger picture, price actions from 125.85 high are seen as a corrective pattern. It's uncertain whether it's completed yet. But in case of another fall, downside should be contained by 61.8% retracement of 75.56 to 125.85 at 94.77 to bring rebound. Overall, rise from 75.56 is still expected to resume later after the correction from 125.85 completes.
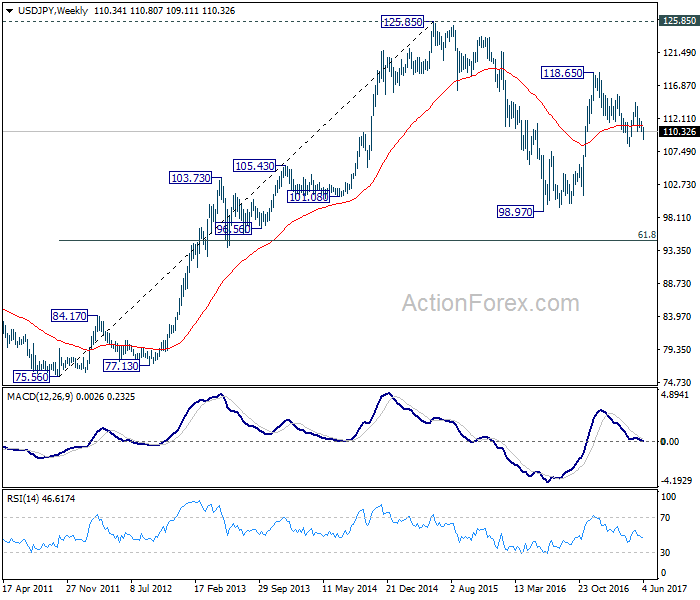
In the long term picture, the rise from 75.56 long term bottom to 125.85 medium term top is viewed as an impulsive move. Price actions from 125.85 are seen as a corrective move which could still extend. But, up trend from 75.56 is expected to resume at a later stage for above 135.20/147.68 resistance zone.
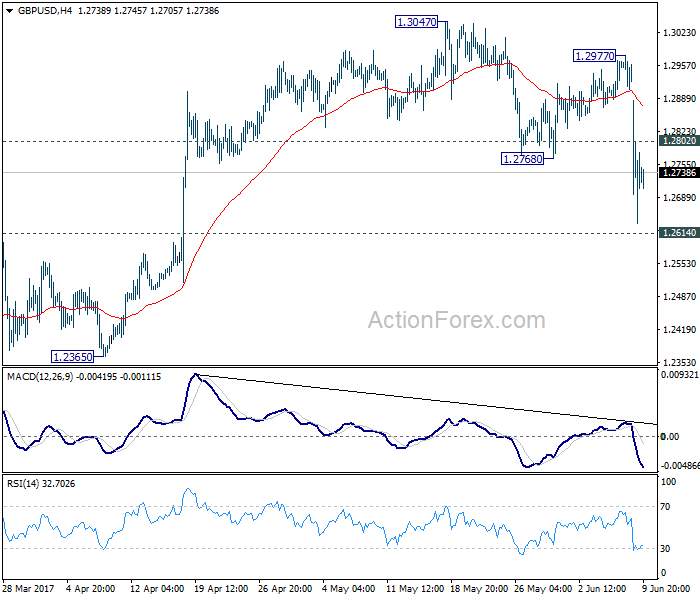
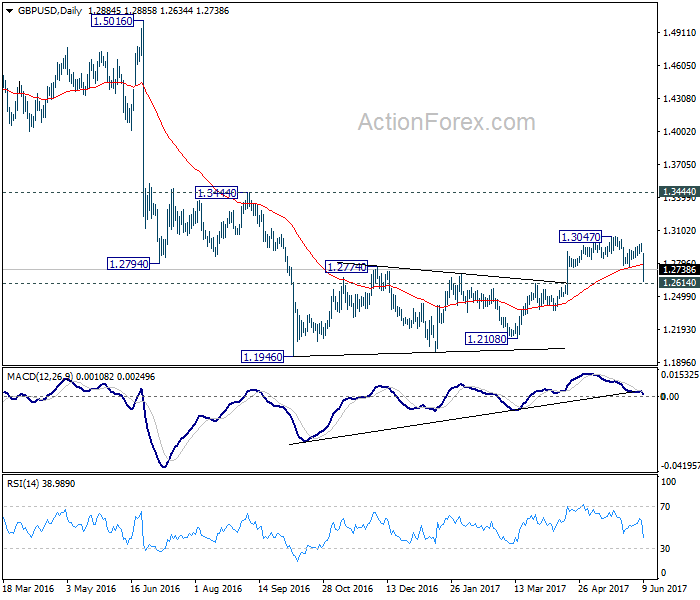
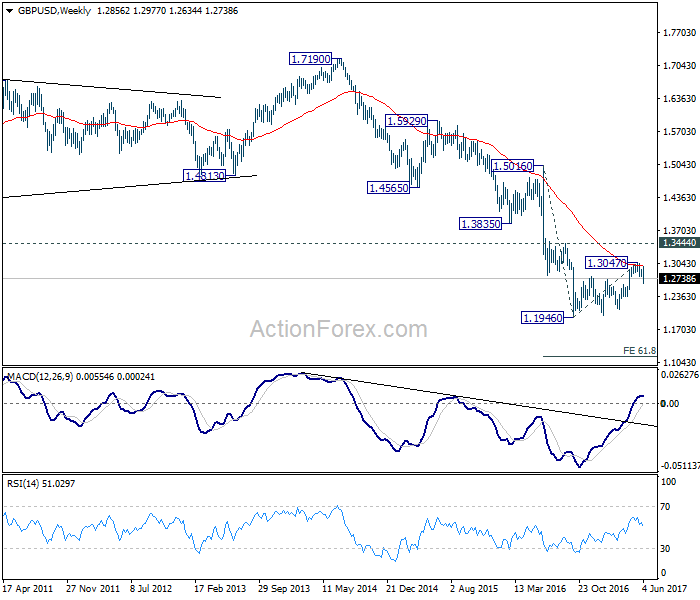
GBP/USD Weekly Outlook
GBP/USD's sharp decline and break of 1.2768 support last week indicates resumption of decline from 1.3047. Also, it affirmed the case that consolidation pattern from 1.1946 has completed at 1.3047 already, well below 1.3444 key resistance. Initial bias stays on the downside this week for 1.2614 key near term support. Break there would confirm our bearish view and target a test on 1.1946 low next. On the upside, above 1.2802 will bring turn bias neutral and bring recovery. But outlook will remain bearish as long as 1.2977 resistance holds.
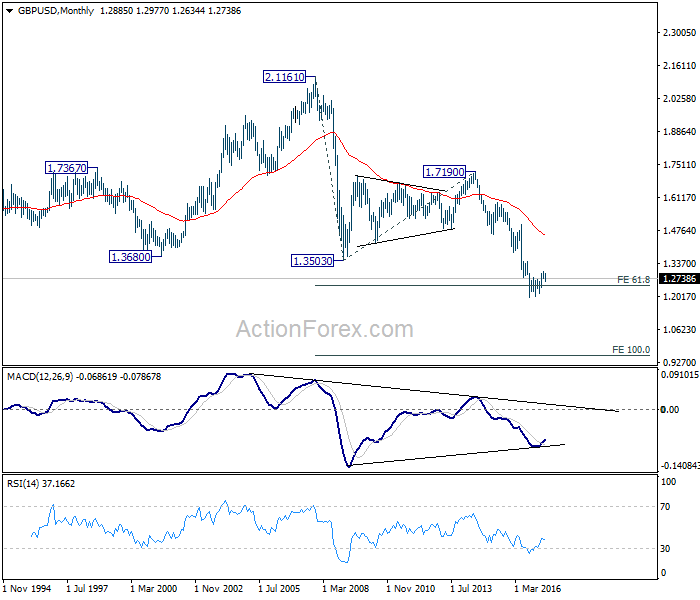
In the bigger picture, fall from 1.7190 is seen as part of the down trend from 2.1161. Price actions from 1.1946 medium term low are seen as a consolidation pattern, which could have completed after hitting 55 week EMA. Break of 1.1946 low will target 61.8% projection of 1.5016 to 1.1946 from 1.3047 at 1.1150 next. In case the consolidation from 1.1946 extends, outlook will stay remain bearish as long as 1.3444 resistance holds.
In the longer term picture, no change in the view that down trend from 2.1161 is still in progress. On resumption, such decline would extend deeper to 100% projection of 2.1161 to 1.3503 from 1.7190 at 0.9532.
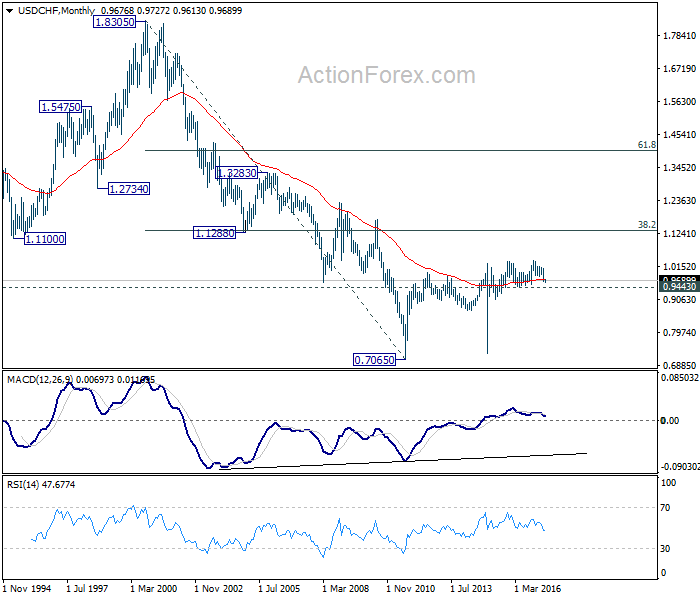
USD/CHF Weekly Outlook
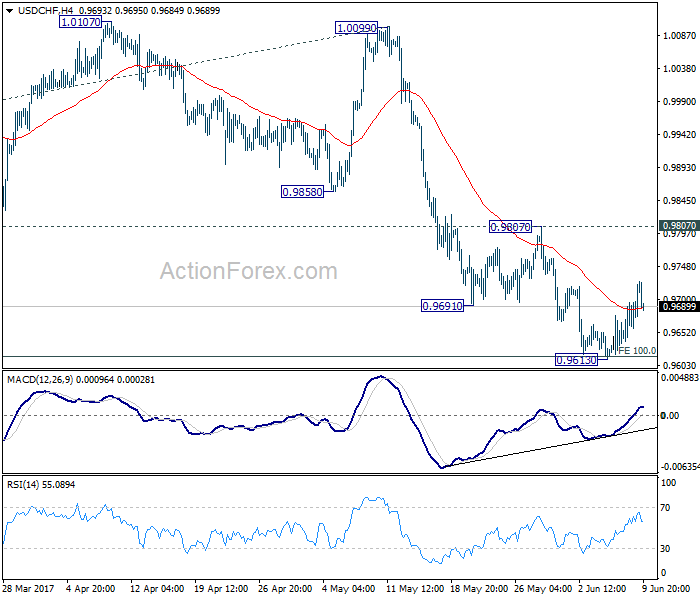
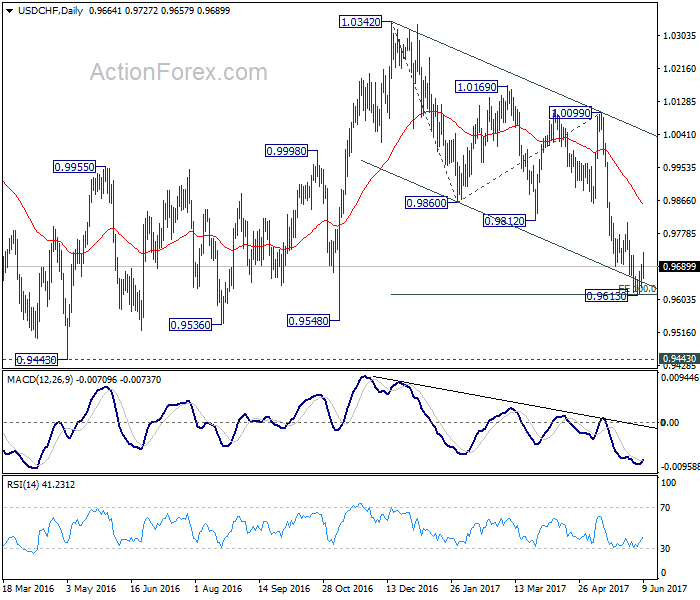
USD/CHF formed a short term bottom at 0.9613 last week and recovered. Such rise is corrective in structure so far and doesn't indicate reversal. Initial bias stays neutral this week first. Outlook will remain bearish as long as 0.9807 resistance holds. Break of 0.9613 will extend the whole fall from 1.0342 to 0.9548 support and below. We'd start to look for bottoming signal again as it approaches 0.9443 key support level. However, considering bullish convergence condition in 4 hour MACD, break of 0.9807 will indicate near term reversal and turn outlook bullish for 1.0099 resistance next.
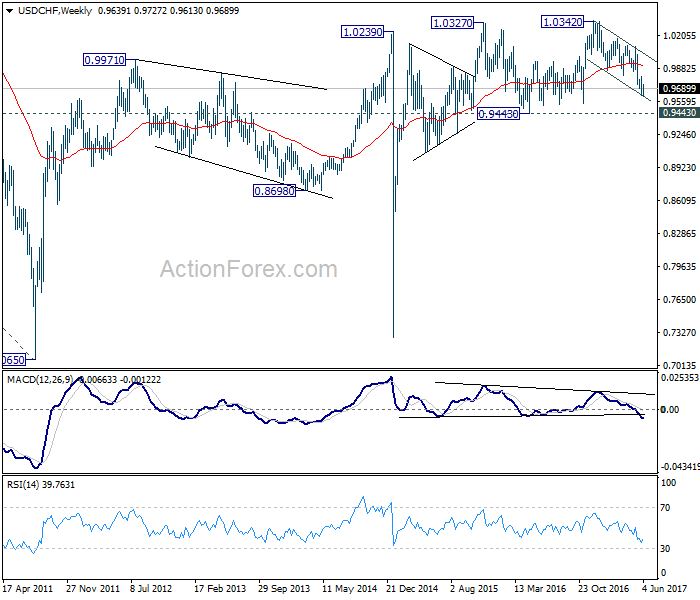
In the bigger picture, USD/CHF is still bounded in medium term range of 0.9443/1.0342 for the moment. Consolidative trading would likely continue and medium term outlook remains neutral. Break of 1.0342 key resistance is needed to confirm underlying bullish momentum in the pair. Meanwhile, downside attempts should be contained by 0.9443 key support level. However, sustained break of 0.9443 will carry larger bearish implication and target 0.9 handle.
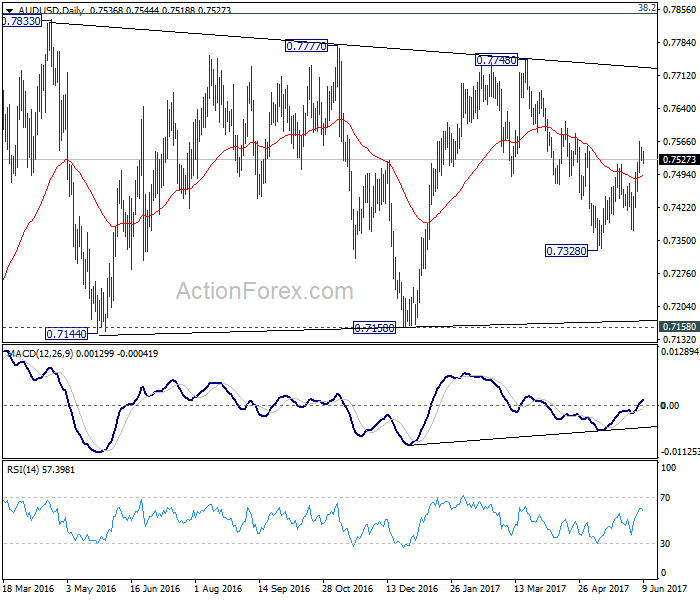
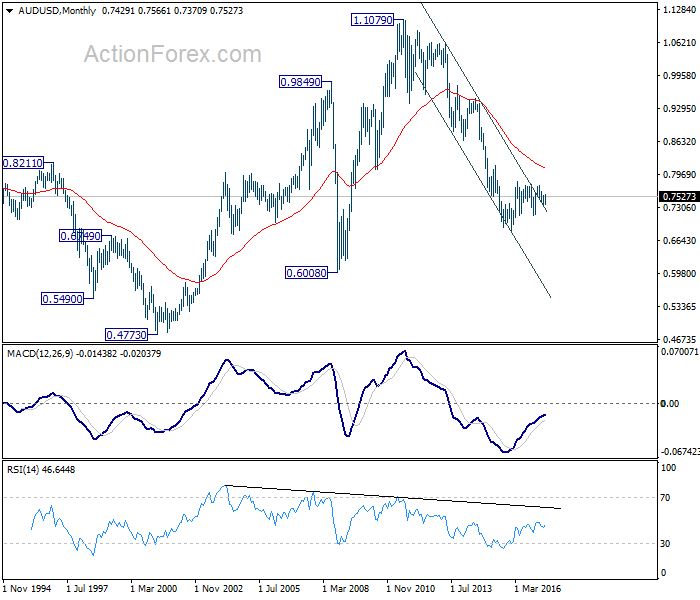
AUD/USD Weekly Outlook
AUD/USD's rise from 0.7328 resumed last week by taking out 0.7516 resistance. But a temporary top was formed at 0.7566. Initial bias is neutral this week first. Further rise is mildly in favor as long as 0.7456 minor support holds. Above 0.7566 will target 0.7748 resistance. In that case, we'll be cautious on topping again as it approaches medium term fibonacci level at 0.7849. On the downside, below 0.7456 minor support will turn bias back to the downside for 0.7328 short term bottom.
In the bigger picture, we're still treating price actions from 0.6826 low as a corrective pattern. And, as long as 38.2% retracement of 0.9504 to 0.6826 at 0.7849 holds, long term down trend from 1.1079 is expected to resume sooner or later. Break of 0.6826 low will target 0.6008 key support level. However, firm break of 0.7849 will indicate that rise from 0.6826 is developing into a medium term rebound, rather than a sideway pattern. In such case, stronger rise should be seen to 55 month EMA (now at 0.8091) and above.
In the longer term picture, while the down trend from 1.1079 might extend lower, we're not anticipating a break of 0.6008 (2008 low) yet. We'll look for bottoming above there to reverse the medium term trend.
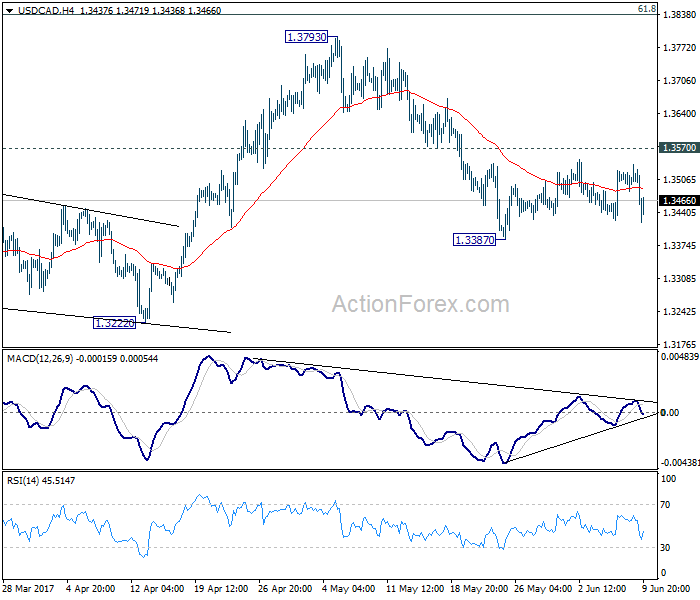
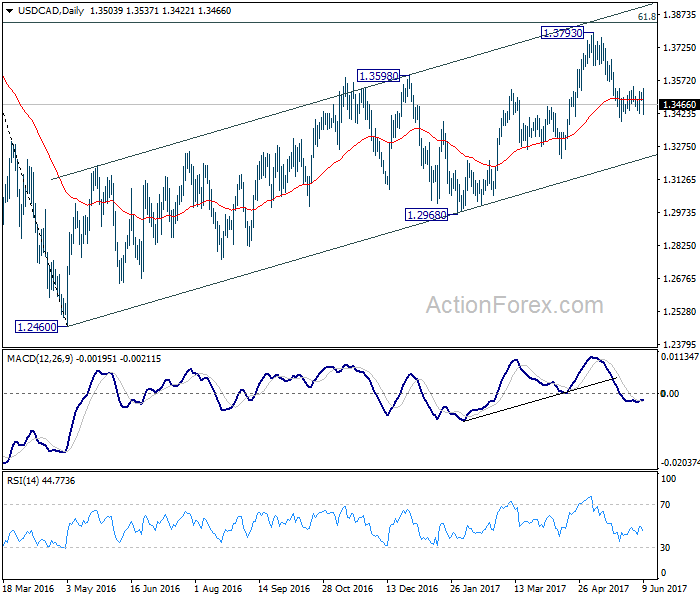
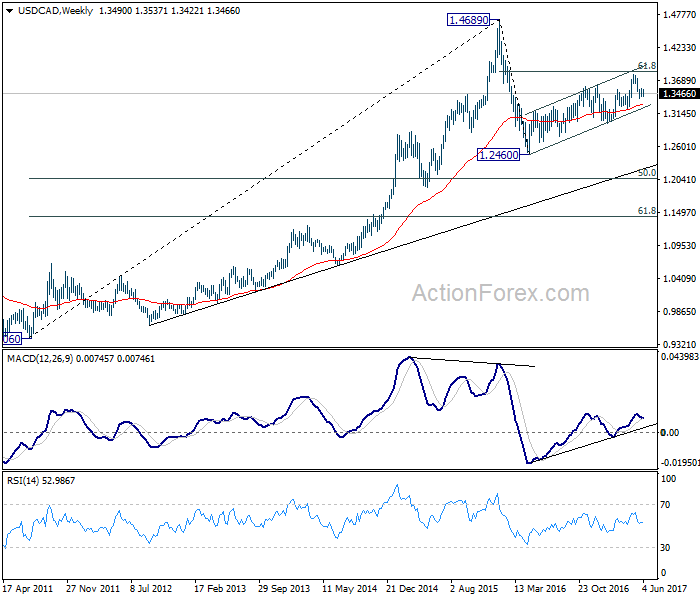
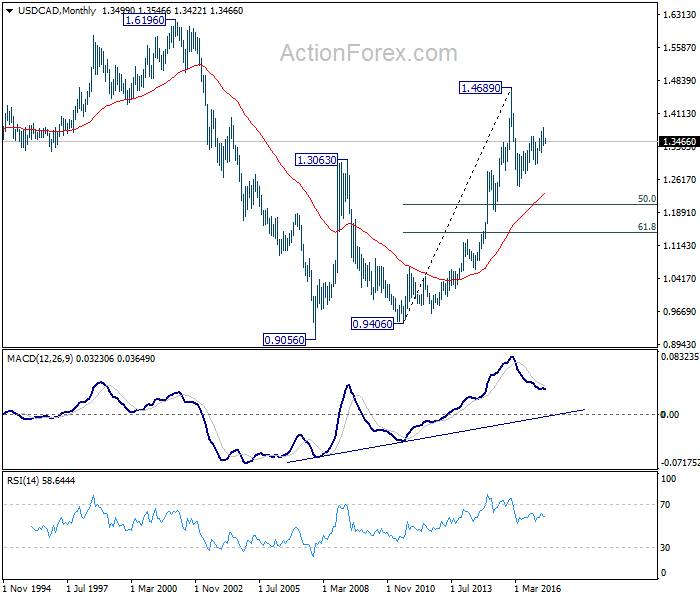
USD/CAD Weekly Outlook
USD/CAD stayed in the consolidation pattern from 1.3387 last week and outlook is unchanged. Initial bias remains neutral this week first. In case of another recovery, upside should be limited by 1.3570 resistance and bring fall resumption. We're holding on to the view that rise from 1.2968 has completed. And the larger rise from 1.2460 could have finished too. Below 1.3387 will target 1.3222 support first. Break of 1.3222 will affirm our bearish view and target 1.2968 key support level for confirmation. However, break of 1.3570 will turn focus back to 1.3793 high instead.
In the bigger picture, price actions from 1.4689 medium term top are seen as a correction pattern. The first leg has completed at 1.2460. Rise from 1.2460 is seen as the second leg and could have completed at 1.3793, ahead of 61.8% retracement of 1.4689 to 1.2460 at 1.3838. Break of 1.3222 should indicate the start of the third leg while further break of 1.2968 should confirm. Nonetheless, sustained trading above 1.3838 would pave the way to retest 1.4689 high.
In the longer term picture, rise from 0.9056 (2007 low) is viewed as a long term up trend. It's taking a breath after hitting 1.4689. But such rise expected to resume later to test 1.6196 down the road.
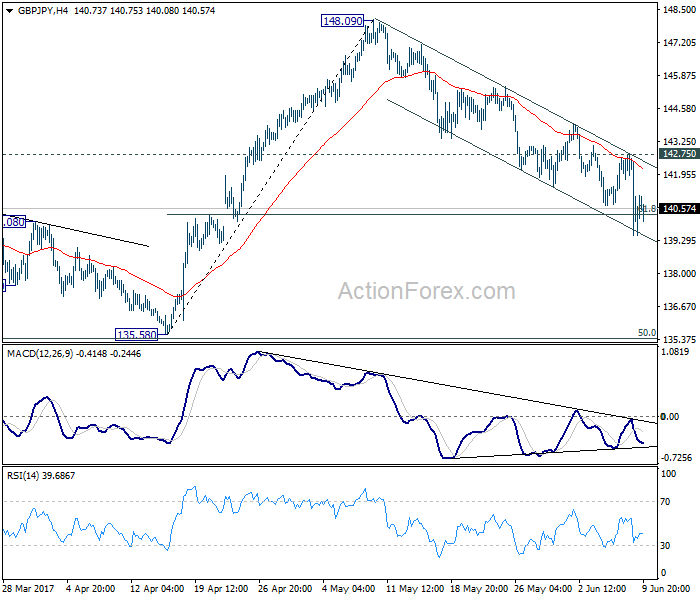
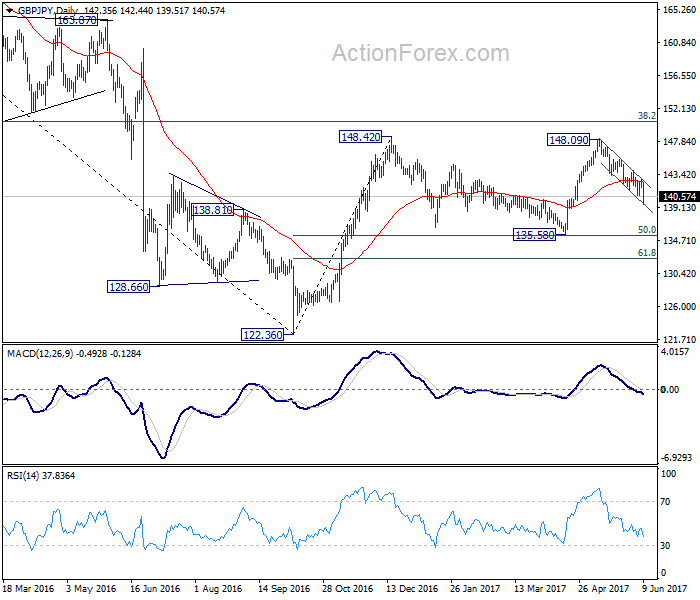
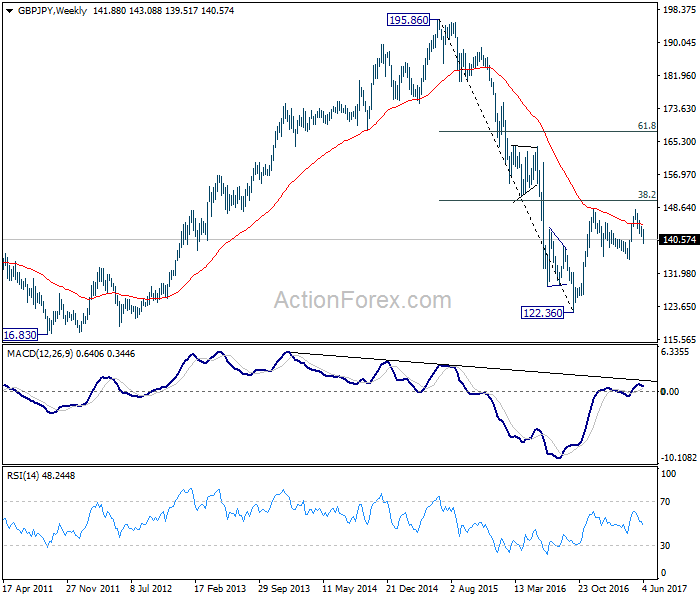
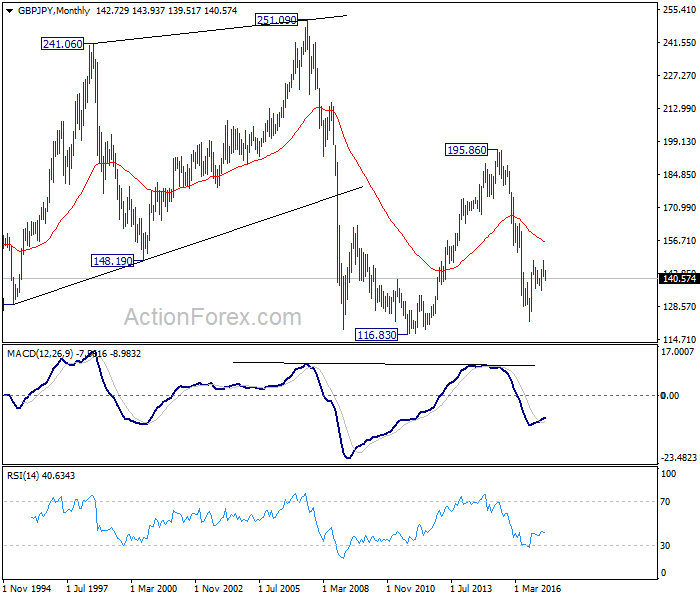
GBP/JPY Weekly Outlook
GBP/JPY's fall from 148.09 extended to as low as 139.52 last week and broke 61.8% retracement of 135.58 to 148.09 at 140.35. The cross is kept well below falling 4 hour 55 EMA and inside near term falling channel. Initial bias stays on the downside this week and current fall would target 135.58 support. We'll look for bottoming sign again around there. On the upside, break of 142.75 resistance is needed to indicate completion of fall from 148.09. Otherwise, near term outlook will say mildly bearish in case of recovery.
In the bigger picture, while the fall from 148.09 is deeper than expected, we're not bearish in the cross yet. Price action from 148.42 is possibly developing into a sideway pattern with fall from 148.09 as the third leg. Deeper decline could be seen but we're looking for strong support from 135.58 and 50% retracement of 122.36 to 148.42 at 135.39 to contain downside. Rise from 122.36 is still mildly in favor to resume at a later stage. However, sustained break of 135.58/39 will confirm reversal and target a retest on 122.36 low.
In the longer term picture, based on the impulsive structure of the decline from 195.86 to 122.36, such fall should not be completed yet. But we will now pay close attention to the structure of the rise from 122.36 to determine whether it's a corrective move, or an impulsive move. That would decide whether a break of 116.83 low would be seen.
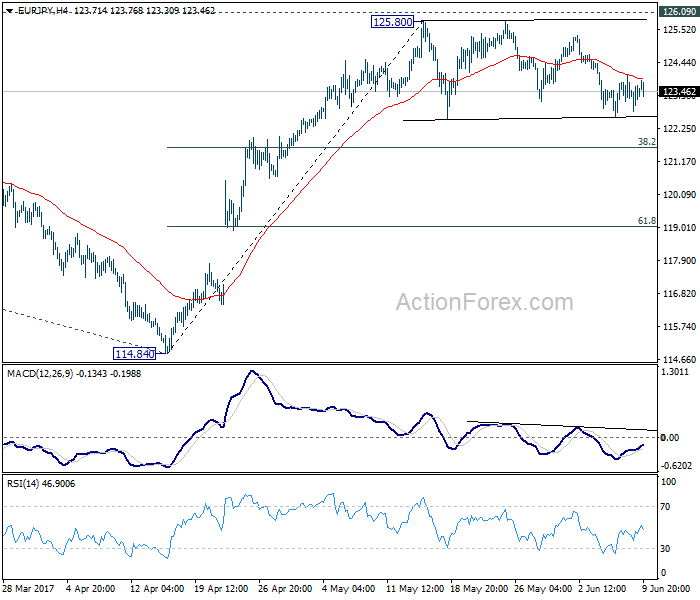
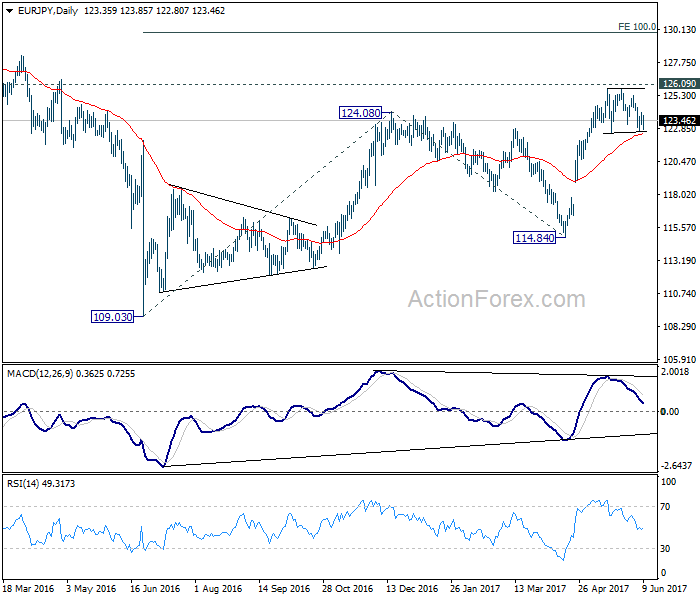
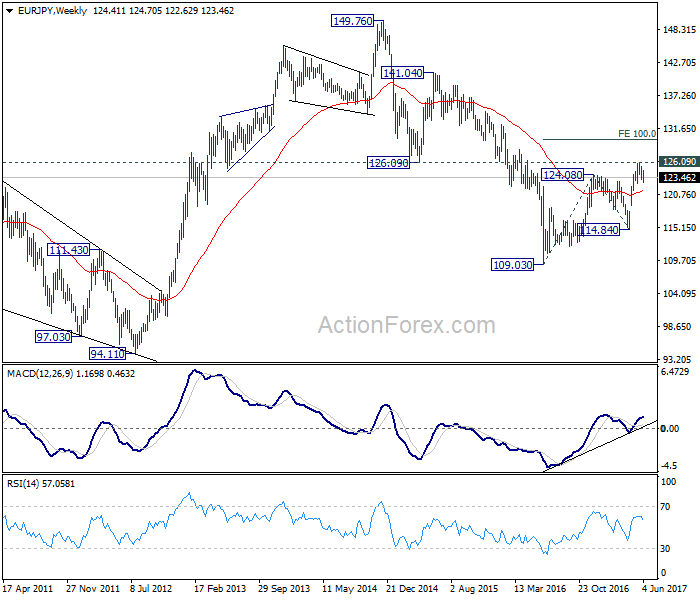
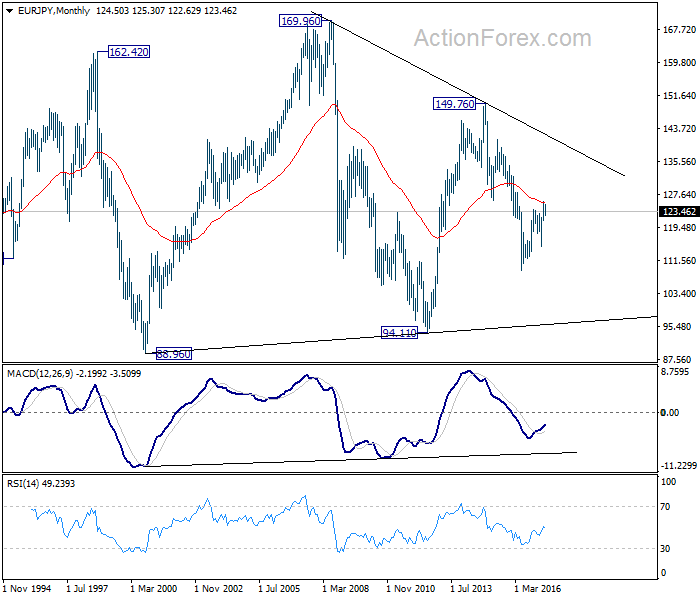
EUR/JPY Weekly Outlook
EUR/JPY stayed in the consolidation pattern from 125.80 last week and outlook remains unchanged. Initial bias stays neutral this week first. In case of another fall, downside should be contained by 38.2% retracement of 114.84 to 125.80 at 121.61 to bring rise resumption. We're staying mildly bullish in the cross. And, break of 126.09 key resistance will extend the whole rebound from 109.03 to 100% projection of 109.03 to 124.08 from 114.84 at 129.89. Nonetheless, firm break of 121.61 will dampen our bullish view and bring deeper fall to 61.8% retracement at 119.02.
In the bigger picture, focus is staying on 126.09 support turned resistance. Decisive break there will confirm completion of the down trend from 149.76. And in such case, rise from 109.20 is at the same degree and should target 141.04 resistance and above. Meanwhile, rejection from 126.09 and break of 114.84 will extend the fall from 149.76 through 109.20 low.
In the long term picture, medium term decline from 149.76 is seen as part of a long term sideway pattern from 88.96. We're not seeing any sign of an established long term trend yet. Hence, we'll be cautious on strong support at 94.11 in case of another fall. Also, there could be strong resistance at 149.76 in case of a medium term rise.
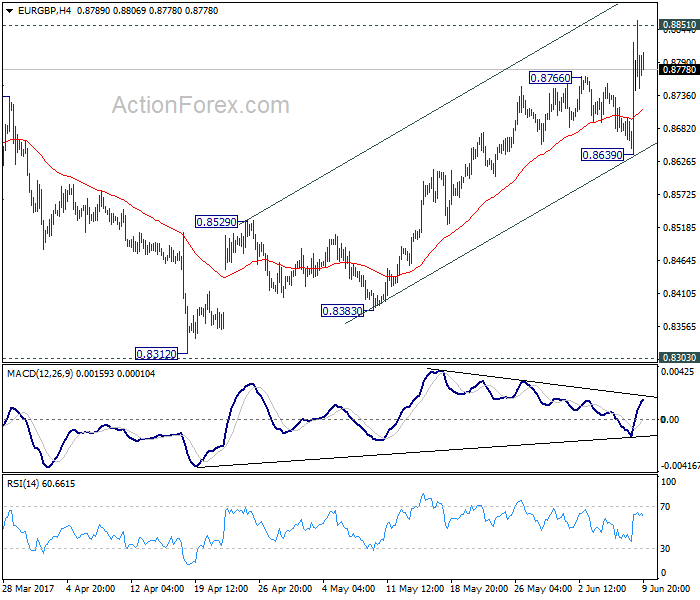
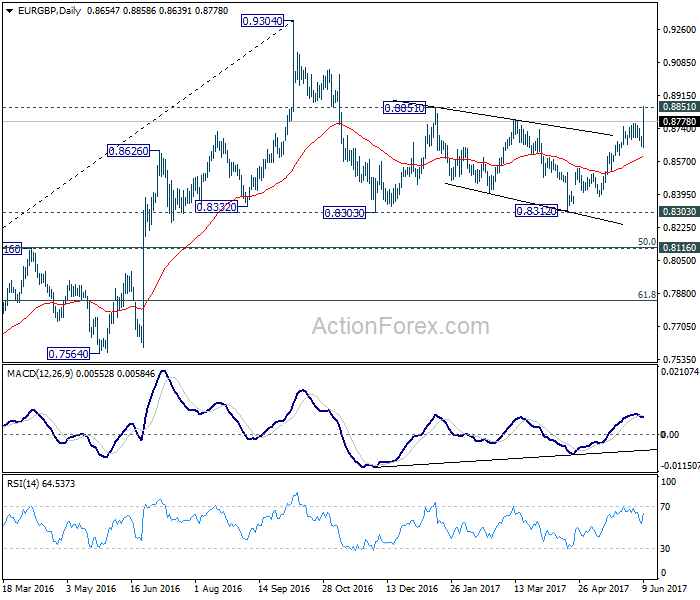
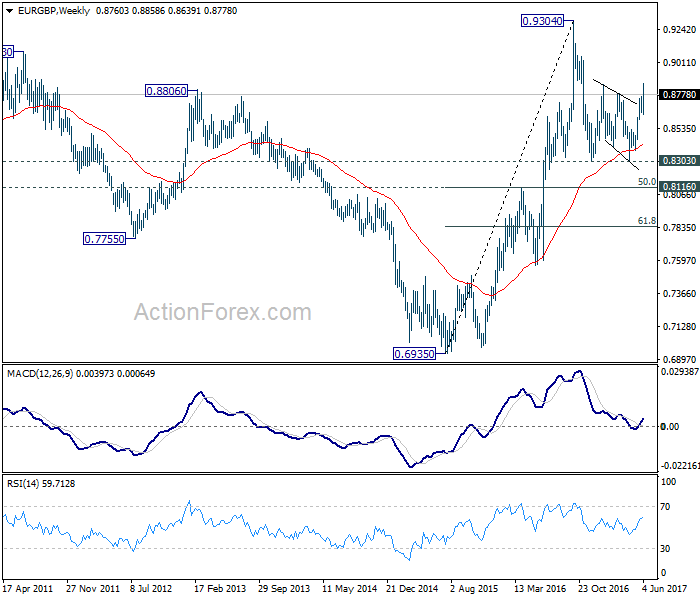
EUR/GBP Weekly Outlook
EUR/GBP's rise from 0.8312 resumed last week and breached 0.8851 resistance. Initial bias remains on the upside this week first. Firm break of 0.8851 will pave the way to retest 0.9304 high. At this point, there is no clear sign up larger up trend resumption yet. Hence, we'll be cautious on topping around 0.9304. On the downside, however, break of 0.8639 support will now indicate near term topping and bring deeper pull back to 55 day EMA (now at 0.8584) and below.
In the bigger picture, price actions from 0.9304 are viewed as a medium term corrective pattern. The leg from 0.9304 should have completed after testing 0.8332 structural support. But it's too early to say that larger rise from 0.6935 is resuming. Rejection from 0.9304 will extend the consolidation with another falling leg. Meanwhile, firm break of 0.9304 will target 0.9799 (2008 high). In case of another decline, we'd expect strong support from 0.8116 cluster support (50% retracement of 0.6935 to 0.9304 at 0.8120) to contain downside and bring rebound.
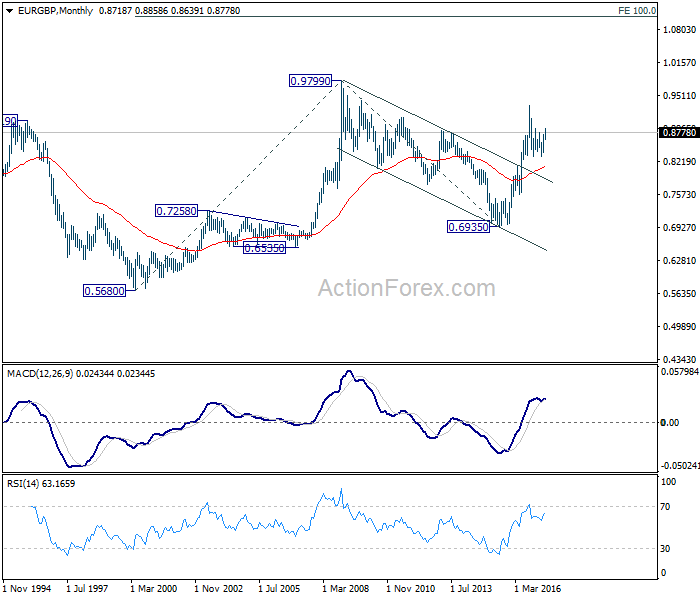
In the long term picture, firstly, price action from 0.9799 (2008 high) is seen as a long term corrective pattern and should have completed at 0.6935 (2015 low). Secondly, rise from 0.6935 is likely resuming up trend from 0.5680 (2000 low). Thirdly, this is supported by the impulsive structure of the rise from 0.6935 to 0.9304. Hence, after the correction from 0.9304 completes, we'd expect another medium term up trend to target 0.9799 high and above.