Sample Category Title
Australia’s HIA New Home Sales Rebounded In April
For the 24 hours to 23:00 GMT, the AUD declined 0.59% against the USD and closed at 0.7381.
LME Copper prices rose 0.4% or $21.0/MT to $5636.5/MT. Aluminium prices rose 0.6% or $10.5/MT to $1930.0/MT.
In the Asian session, at GMT0300, the pair is trading at 0.7382, with the AUD trading marginally higher against the USD from yesterday's close.
Early morning data indicated that Australia's HIA new home sales rebounded 0.8% on a monthly basis in April, following a drop of 1.1% in the prior month.
The pair is expected to find support at 0.7363, and a fall through could take it to the next support level of 0.7345. The pair is expected to find its first resistance at 0.7410, and a rise through could take it to the next resistance level of 0.7439.
Next week, market participants will keep a close watch on the Reserve Bank of Australia's (RBA) interest rate decision along with Australia's 1Q GDP data.
The currency pair is showing convergence with its 20 Hr moving average and trading below its 50 Hr moving average

Manufacturing Sector Growth Across The Eurozone Confirmed At A 6-Year High Level In May
For the 24 hours to 23:00 GMT, the EUR declined 0.22% against the USD and closed at 1.1217.
Macroeconomic data indicated that the Euro-zone's final Markit manufacturing PMI rose to a six-year high level of 57.0 in May, confirming the preliminary print. In the previous month, the PMI had registered a level of 56.7.
Additionally, growth in Germany's manufacturing sector expanded at its fastest pace since 2011 in May, with the PMI revised higher to a level of 59.5, compared to an advance to a level of 59.4 in the flash estimate and following a reading of 58.2 in the previous month.
The greenback gained ground against its major peers, following upbeat US private sector job report.
Private sector employment in the US jumped more-than-expected by 253.0K in May, pointing towards continued strength in the nation's labour market. The private sector employment had registered a revised gain of 174.0K in the prior month, while market participants anticipated for a rise of 180.0K.
Additionally, the nation's ISM manufacturing PMI recorded an unexpected rise to a level of 54.9 in May, suggesting that manufacturing sector continues to perform well in the second quarter of the year. Investors had envisaged the PMI to remain steady at a level of 54.8.
Another set of data indicated that the final Markit manufacturing PMI in the US eased less than initially estimated to a level of 52.7 in May, while the flash print had indicated a fall to a level of 52.5. In the previous month, the PMI had recorded a reading of 52.8. On the other hand, the nation's initial jobless claims advanced to a level of 248.0K in the week ended 27 May 2017, topping market expectations for it to rise to a level of 238.0K. Initial jobless claims had registered a revised reading of 235.0K in the previous week. Further, the nation's construction spending posted its biggest drop in a year, after it unexpectedly fell 1.4% on a monthly basis in April, defying investor consensus for a rise of 0.5% and following a revised gain of 1.1% in the prior month.
In the Asian session, at GMT0300, the pair is trading at 1.1217, with the EUR trading flat against the USD from yesterday's close.
The pair is expected to find support at 1.1194, and a fall through could take it to the next support level of 1.1170. The pair is expected to find its first resistance at 1.1249, and a rise through could take it to the next resistance level of 1.1280.
With no major economic releases in the Euro-zone today, investors will direct their attention to the crucial US non-farm payrolls and average hourly earnings data for May along with the nation's trade balance figures for April, all slated to release later in the day.
The currency pair is showing convergence with its 20 Hr and 50 Hr moving averages.

UK’s Manufacturing Sector Growth Slightly Eased In May
For the 24 hours to 23:00 GMT, the GBP rose 0.09% against the USD and closed at 1.2885, after the latest data indicated that UK's manufacturing sector is sustaining most of the growth momentum.
Britain's Markit manufacturing PMI fell less-than-expected to a level of 56.7 in May, compared to a reading of 57.3 in the prior month. Markets were expecting the manufacturing PMI to drop to a level of 56.5. Meanwhile, the nation's seasonally adjusted Nationwide house prices surprisingly eased 0.2% on a monthly basis in May, falling for the third consecutive month and confounding market expectations for an advance of 0.2%. House prices had dropped 0.4% in the prior month.
In the Asian session, at GMT0300, the pair is trading at 1.2877, with the GBP trading 0.06% lower against the USD from yesterday's close.
The pair is expected to find support at 1.2833, and a fall through could take it to the next support level of 1.2788. The pair is expected to find its first resistance at 1.2919, and a rise through could take it to the next resistance level of 1.296.
Moving ahead, traders would focus on Britain's Markit construction PMI for May, set to release in a few hours.
The currency pair is showing convergence with its 20 Hr moving average and trading above its 50 Hr moving average

Japanese Yen Trading Lower In The Asian Session
For the 24 hours to 23:00 GMT, the USD rose 0.54% against the JPY and closed at 111.39.
In the Asian session, at GMT0300, the pair is trading at 111.64, with the USD trading 0.22% higher against the JPY from yesterday’s close.
The pair is expected to find support at 111.09, and a fall through could take it to the next support level of 110.55. The pair is expected to find its first resistance at 111.93, and a rise through could take it to the next resistance level of 112.23.
Looking ahead, Japan’s final GDP, Nikkei services PMI, trade balance, tertiary industry index and Eco-Watchers survey data, all slated to release next week, will be on investors’ radar.
The currency pair is trading above its 20 Hr and 50 Hr moving averages.

Swiss Economic Growth Came In Softer-Than-Expected In The First Three Months Of 2017
For the 24 hours to 23:00 GMT, the USD rose 0.32% against the CHF and closed at 0.9710.
On the macro front, Switzerland's seasonally adjusted gross domestic product (GDP) climbed less-than-expected by 0.3% on a quarterly basis in 1Q 2017, compared to market expectations for an advance of 0.5%. In the previous month, GDP had advanced by a revised 0.2%.
On the contrary, the nation's real retail sales dropped 1.2% on an annual basis in April, after recording gain of 2.1% in the previous month. Moreover, the nation's SVME–PMI surprisingly fell to a level of 55.6 in May, compared to a reading of 57.4 in the prior month, while markets had anticipated the PMI to rise to a level of 57.8.
In the Asian session, at GMT0300, the pair is trading at 0.9714, with the USD trading slightly higher against the CHF from yesterday's close.
The pair is expected to find support at 0.9684, and a fall through could take it to the next support level of 0.9654. The pair is expected to find its first resistance at 0.9732, and a rise through could take it to the next resistance level of 0.9750.
Going ahead, investors will closely monitor Switzerland's unemployment rate and consumer price inflation data, both slated to release next week.
The currency pair is showing convergence with its 20 Hr and 50 Hr moving averages.

Canada’s Manufacturing Sector Activity Cooled In May
For the 24 hours to 23:00 GMT, the USD rose 0.1% against the CAD and closed at 1.3511.
In economic news, Canada's Markit manufacturing PMI declined to a level of 55.1 in May, compared to a reading of 55.9 in the preceding month.
In the Asian session, at GMT0300, the pair is trading at 1.3509, with the USD trading slightly lower against the CAD from yesterday's close.
The pair is expected to find support at 1.3478, and a fall through could take it to the next support level of 1.3448. The pair is expected to find its first resistance at 1.3533, and a rise through could take it to the next resistance level of 1.3558.
Moving ahead, investors will await the release of Canada's unemployment rate, housing starts and building permits data, all scheduled to release next week.
The currency pair is trading above its 20 Hr and 50 Hr moving averages.

US Equity Indices Ended The Day Up By 0.7-0.8%
Market movers today
Today, the US jobs report for May is due, one of the last important data releases ahead of the Fed's meet ing later this month. We forecast nonfarm payrolls rose 170,000 in May but note the ADP report released yesterday showed a stronger increase of 253,000. The Markit PMI employment index suggests slower growth of around 100,000. Weestimate the unemployment rate increased from 4.4% to 4.5%, as labour force growth was weak at the end of 2016 and in the beginning of 2017 and we think we could see some reversion. We estimate average hourly earnings rose +0.2% m/m, implying an unchanged annual growth rate of 2.5% y/y.
In the UK, we are scheduled to get const ruction activity for May.
In Norway, we are due to see NAV unemployment data, to which we assign greater importance than to Labour Force Survey (LFS) data. We expect the NAV measure to show a fall in the jobless rate to 2.6% in May, with gross unemployment down 500 people m/m. In Denmark, we get numbers for currency reserves and unemployment data.
Selected market news
The decision by Donald Trump to withdraw from the Paris climate accord was the main story in the global media yesterday night . The direct impact on financial markets is limited but it does highlight that Trump is serious about his election promises. Overnight, the Trump administ ration has asked the Supreme Court to the restore the travel bank. Hence, focus could potentially now turn to the different trade agreement deals that Trump has promised to withdraw from and issues such as border tax and in this way dent investor optimism more seriously.
However, for now, risk appetite is intact , especially as the US numbers cont inue to be strong, point ng to an accelerat ing growth rate following the somewhat disappointing growth in Q1.
The ADP employment report showed an increase in employment of 253,000 persons in May. It points to a strong non-farm pay-rolls report later today, though the predictive power of the ADP report is certainly not one-to-one. Hence, we stick to our 170,000 call. Also, the ISM report came out on the strong side, with a reading of 54.9, up a notch from 54.8 in April. Note that some details, such as business and government construction spending, were on the weak side.
The major US equity indices ended the day up by 0.7-0.8%, reaching all-time highs. The positive sentiment has been carried over to Asia, where the Nikkei was up 1.7% at the time of writing. Nikkei has topped 20,000 for the first time since 2015. Despite the strong risk appetite , the impact on the US treasury market was very limited, with the benchmark yield only marginally higher. This may reflect the market now being more or less fully priced for a June Fed hike.
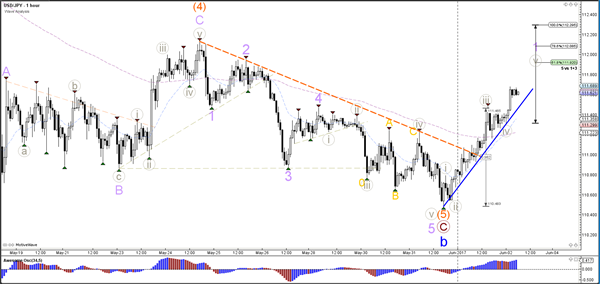
Daily Technical Analysis: USD/JPY Completes Truncated Wave 5 And Starts Bullish Wave 1
Currency pair USD/JPY
The USD/JPY has broken above the resistance trend line (dotted orange) which confirms the completion of wave 5 (orange) within wave C (brown). This particular wave 5 failed to break below the low of wave 3 which is called a truncated wave 5. The new bullish momentum could indicate the start of a wave 1 (purple).
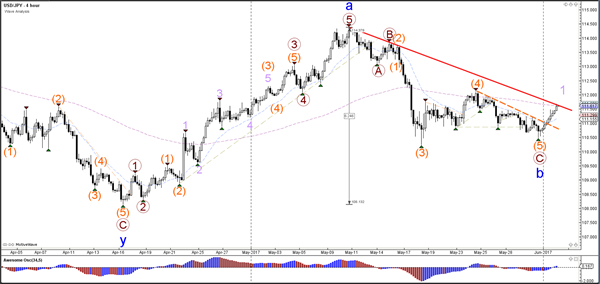
The USD/JPY bullish momentum has 5 internal waves (grey) within wave 1 (purple). Price could be heading towards the Fibonacci targets of wave 5 (grey).
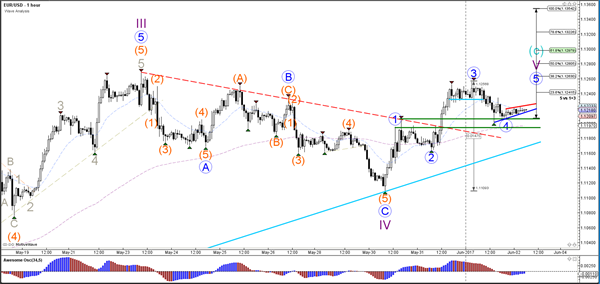
Currency pair EUR/USD
The EUR/USD is still moving sideways in a key decision zone: the resistance at 1.13 and the support (green) at 1.12 are very important levels as the breakout will provide key information about the next potential trend.

The EUR/USD wave 4 (blue) is invalidated if price breaks below support (green). A break above resistance (red) could spark one more wave 5 (blue).
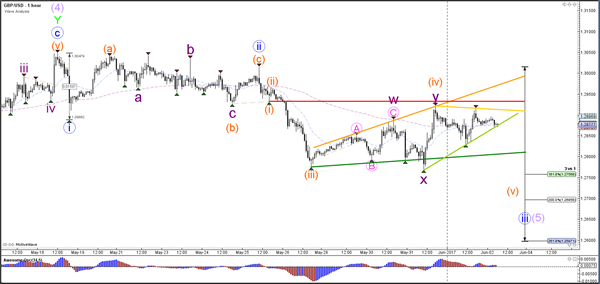
Currency pair GBP/USD
The GBP/USD is building a corrective pattern which is indicated by the trend lines. A break above it invalidates the wave 3 (blue) whereas a break below support (green) could confirm it.
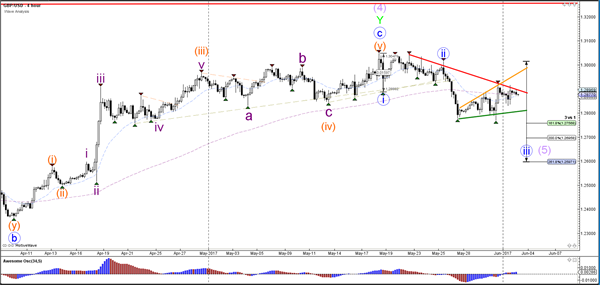
The GBP/USD continues with expanding its consolidation zone.
APAC Commodities: Every Rose Has It’s Thorn
A confusing night for commodities as gold trades sideways but oil falls despite a very bullish Crude Inventory Report.
Oil traders were left scratching their heads in confusion overnight as the U.S DOE Crude Inventory Report showed much larger than expected drawdowns in crude and gasoline inventories. It should have been bullish for oil, and indeed it was for a short time, but it turned out to be a dead cat bounce with both Brent and WTI finishing in New York approximately 1.20% lower than their open.
Every rose has its thorn apparently, and in oils case, it may well have been President Trump's announcement from the White House Rose Garden, that the United States would leave the Paris Climate Accords. From our point of view, this could lead to a drilling free for all in the U.S. and also see other signatories waver in their commitments as well. This outcome could increase the supply side equation from the United States and complicate OPEC's forward projections. A scenario that would not be favourable to oil prices.
Whichever way you cake the cake, however, Brent in particular and WTI both start Friday looking more like sludge than light sweet.
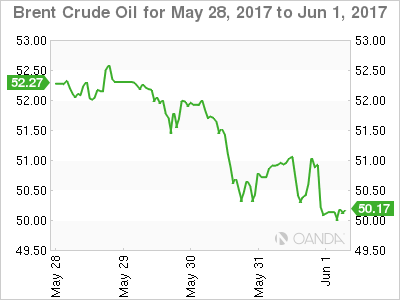
Brent spot opens at its New York lows at 50.10 with immediate support just below at 50.00. Behind this is plenty of clear air until the 48.00 regions. Resistance is at the 51.20 level followed by 51.50 its 200-day moving average.
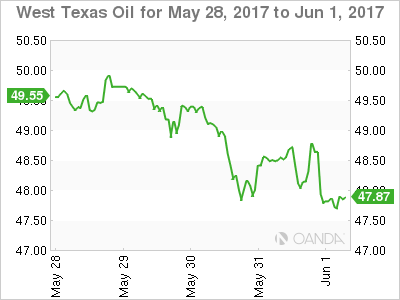
WTI spot trades at 47.75 with initial support at 47.15 before minor support appears at 45.30. Resistance is at 49.00.
GOLD
Gold closed five dollars lower overnight, having shrugged off the worst of its overnight sell-off to post a mid-range close for the New York session. More importantly, it held the ascending trend line support at 1261.00 intraday to keep the recent uptrend intact for now. A slightly stronger U.S. Dollar overnight saw gold run out of steam in the absence of any geopolitical news to cause safe haven buying.
This morning gold trades at 1263.20, resting on the abovementioned trend line, now at this level. Beyond here support appears at 1259.00 with a break below this level possibly triggering some stop-loss selling. Resistance lies at 1270.50 and then at 1274.25, Wednesday's highs.
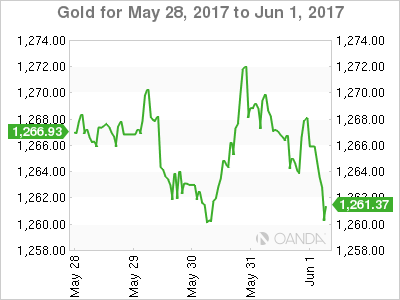
Buying may emerge ahead of 1260.00, at least initially, in Asia, if we follow previous weeks recent patterns. Traders are preferring to hedge potential weekend event risk by picking up the yellow metal in Friday's sessions.
Elliott Wave View: EURJPY Short Term Pullback
Short Term EURJPY Elliott Wave view suggests the rally from 4/16 low is unfolding as a double three Elliott Wave structure. Up from 4/16 (114.8) low, Intermediate wave (W) ended at 125.81 and Intermediate wave (X) ended at 122.53. A break above 125.81 however is still needed to add conviction that the next leg higher has started.
From 122.53 low, the rally is also unfolding as a double three Elliott Wave structure. Minute wave ((w)) ended at 125.8 and Minute wave ((x)) ended at 123.11. Near term, cycle from 5/30 low (123.11) is mature and expected to end soon. This cycle from 5/30 low is unfolding as a Flat Elliott Wave structure and expected to end with Minutte wave (w) at 125.5 – 125.7 area. Once Minutte wave (w) is over, expect pair to pullback in Minutte wave (x). The pullback should unfold in 3, 7, or 11 swing and while the pullback stays above 123.11, pair should extend higher. If pair breaks below 123.11, then pair is likely doing a double correction from 5/16 peak. This suggests pair can open extension lower to 121.6 – 122.25 area in case of a double correction. From this area, buyers should appear again for an extension higher or at least a 3 waves bounce. We do not like selling the proposed move to the downside and expect dips to find buyers in 3, 7, or 11 swing.
EURJPY Elliott Wave 1 Hour Chart