
Sample Category Title
EUR/CHF Daily Outlook
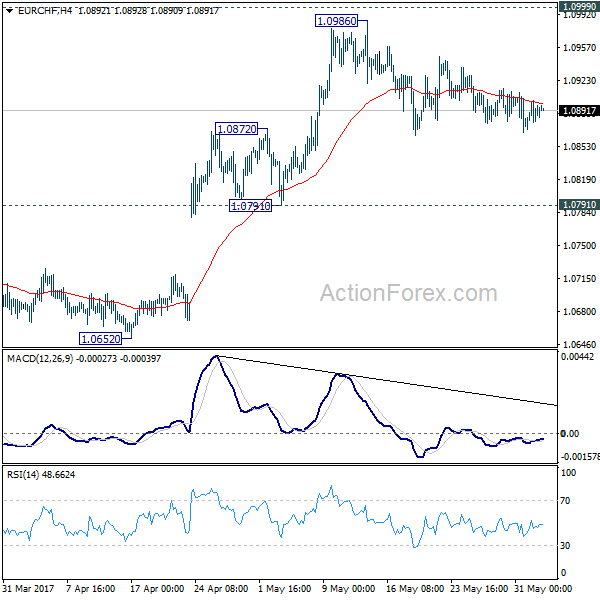
Daily Pivots: (S1) 1.0875; (P) 1.0888; (R1) 1.0906; More...
No change in EUR/CHF's outlook as consolidation from 1.0986 continues. Intraday bias stays neutral for the moment. Deeper fall cannot be ruled out. But downside should be contained by 1.0791/0872 support zone to bring rise resumption. As noted before, the consolidative pattern from 1.1198 should be completed. Firm break of 1.0999 resistance will pave the way for a retest on 1.1198 high.
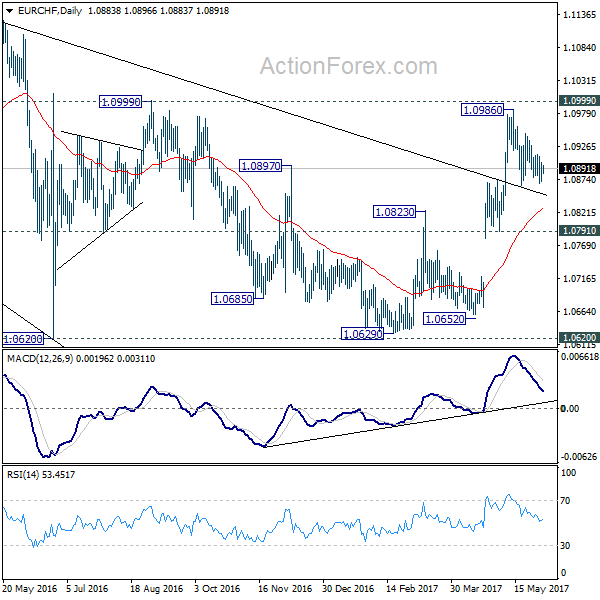
In the bigger picture, the price actions from 1.1198 are seen as a corrective move. Current strong rebound is raising the chance that it's completed after defending 38.2% retracement of 0.9771 to 1.1198 at 1.0653. Decisive break of 1.0999 resistance will target a test on 1.1198 high. For now, this will be the preferred case as long as 1.0791 support holds.
EUR/USD Daily Outlook
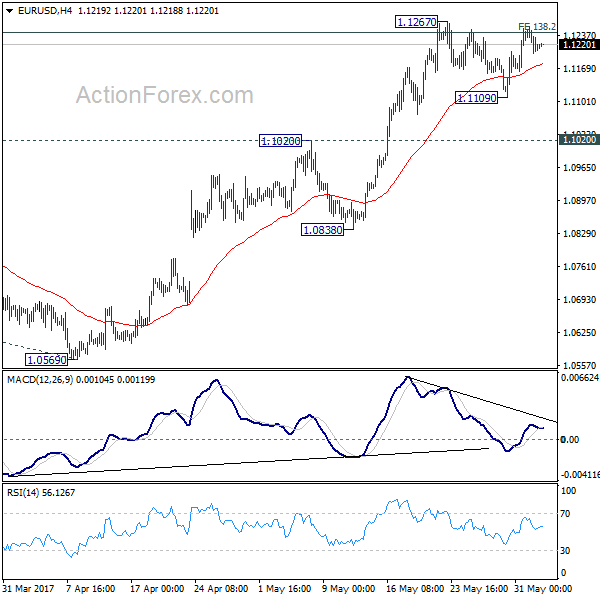
Daily Pivots: (S1) 1.1189; (P) 1.1223 (R1) 1.1244; More....
Intraday bias in EUR/USD remains neutral for the moment. On the upside, break of 1.1267 will resume recent rise. Decisive break of 1.1245/98 (138.2% projection of 1.0339 to 1.0828 from 1.0569 at 1.1245) resistance zone will carry larger bullish implication and target 1.1615 resistance next. In case consolidation from 1.1267 extends with another fall, further rise will remain in favor as long as 1.1020 support holds. But, break of 1.1020 will indicate rejection from 1.1245/98 and turn bias to the downside for 1.0838 support.
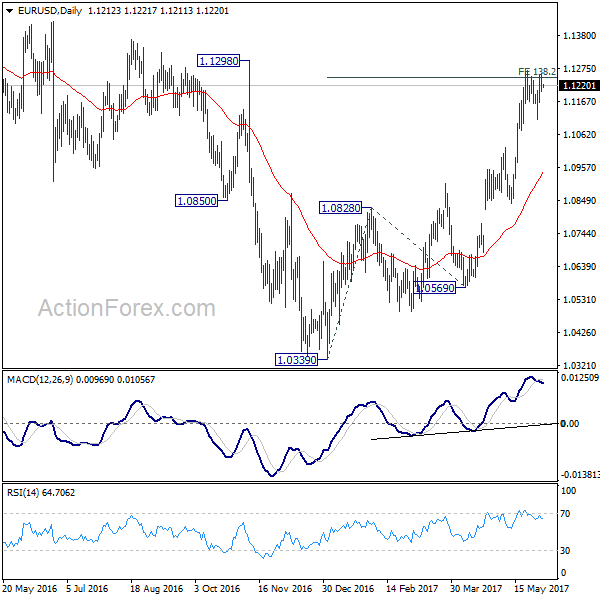
In the bigger picture, the case for medium term reversal continues to build up with EUR/USD staying far above 55 week EMA (now at 1.0888). Also, bullish convergence condition is seen in weekly MACD. Focus will now be on 1.1298 key resistance. Rejection from there will maintain medium term bearishness and would extend the whole down trend from 1.6039 (2008 high). However, firm break of 1.1298 will indicate reversal. In such case, further rally would be seen back to 1.2042 support turned resistance next.
GBP/USD Daily Outlook
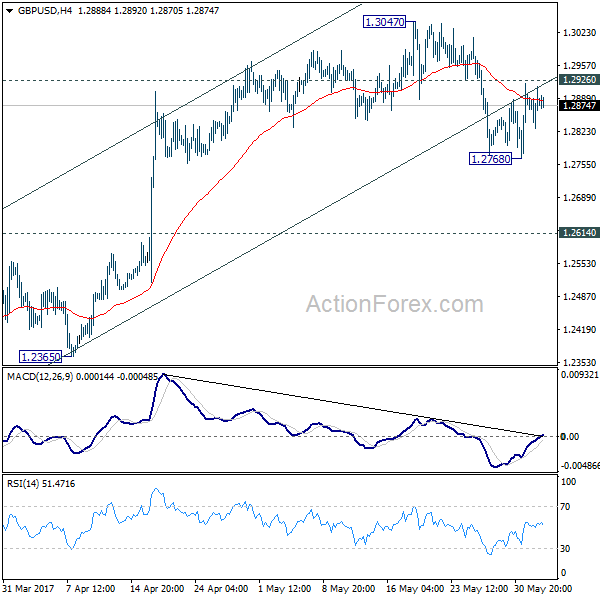
Daily Pivots: (S1) 1.2833; (P) 1.2874; (R1) 1.2919; More...
Intraday bias in GBP/USD remains neutral first. With 1.2926 minor resistance intact, deeper fall is still in favor. We're holding on to view that rise from 1.2108 is completed. Below 1.2768 will target 1.2614 resistance turned support next. Break there should also indicate completion of whole consolidation pattern from 1.1946 and target a retest on this low. Meanwhile, above 1.2926 minor resistance will turn focus back to 1.3047 high instead.
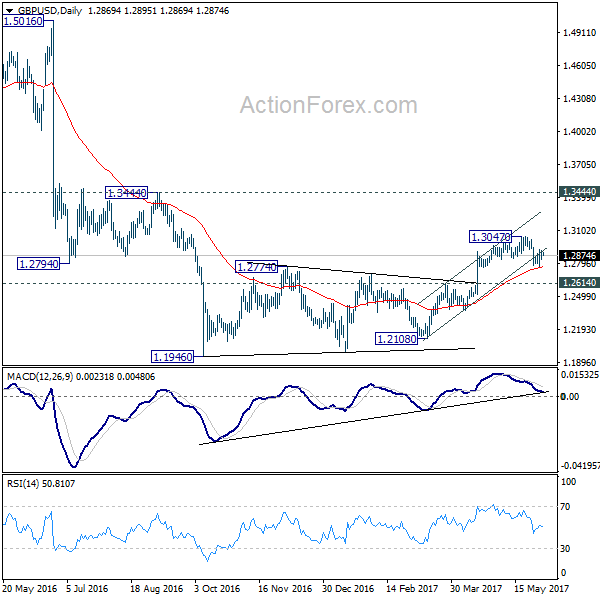
In the bigger picture, fall from 1.7190 is seen as part of the down trend from 2.1161. The rejection from 55 week EMA is maintaining bearishness in the pair. Also, at this point, as long as 1.3444 resistance holds, fall from 1.7190 is still expected to continue. Break of above mentioned 1.2614 support will affirm this bearish case.
USD/CHF Daily Outlook
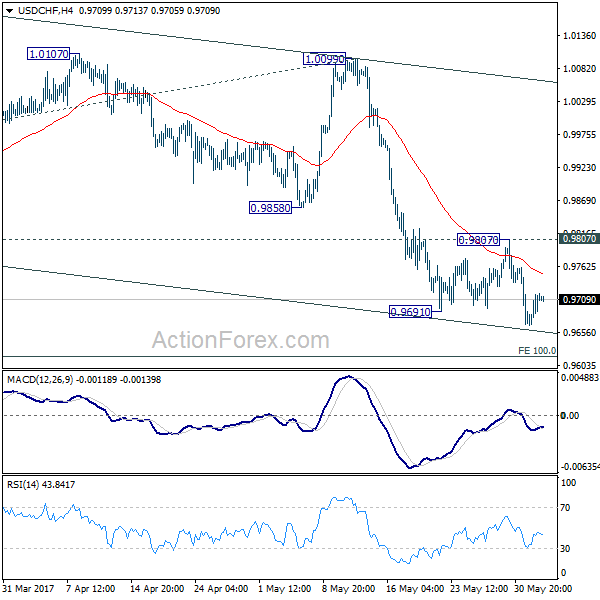
Daily Pivots: (S1) 0.9678; (P) 0.9699; (R1) 0.9734; More.....
Further decline is still expected in USD/CHF with 0.9807 resistance intact. Current fall from 1.0342 should target 100% projection of 1.0342 to 0.9860 from 1.0099 at 0.9617. We'll start to look for reversal signal below there. Meanwhile, break of 0.9807 will be the first sign of near term reversal. In such case, intraday bias will be turned back to the upside for 0.9860 support turned resistance for confirmation.
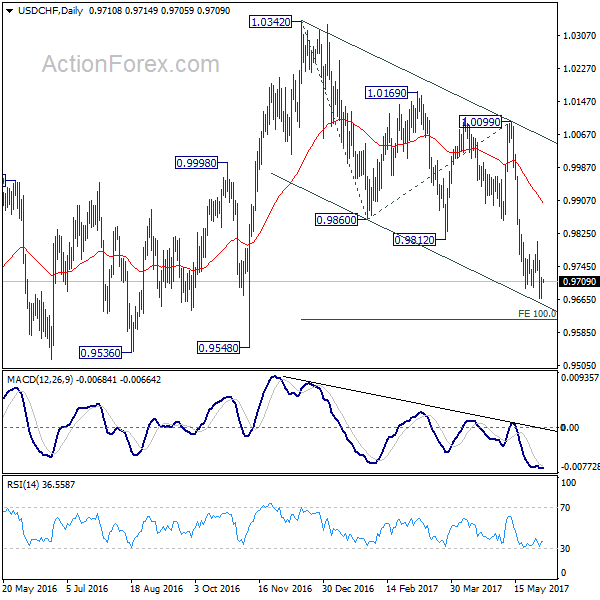
In the bigger picture, USD/CHF is bounded in medium term range of 0.9443/1.0342 for the moment. Consolidative trading would likely continue and medium term outlook remains neutral. Break of 1.0342 key resistance is needed to confirm underlying bullish momentum in the pair. Meanwhile, downside attempts should be contained by 0.9443 key support level.
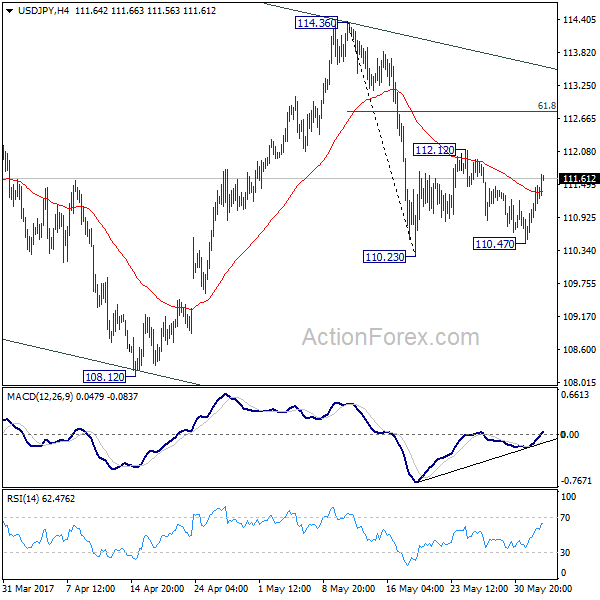
USD/JPY Daily Outlook
Daily Pivots: (S1) 110.83; (P) 111.15; (R1) 111.69; More...
USD/JPY's consolidation from 110.23 is extending with another rise and intraday bias stays neutral first. Break of 112.12 might be seen but upside should be limited by 61.8% retracement of 114.36 to 110.23 at 112.78 to bring fall resumption. Below 110.23 will turn bias to the downside and will likely resume the fall from 118.65 through 108.12 low. At fall from 118.65 is seen as a correction, we'll look for bottoming signal again at 61.8% retracement of 98.97 to 118.65 at 106.48. However, sustained break of 112.78 will turn focus back to 114.36 resistance instead.
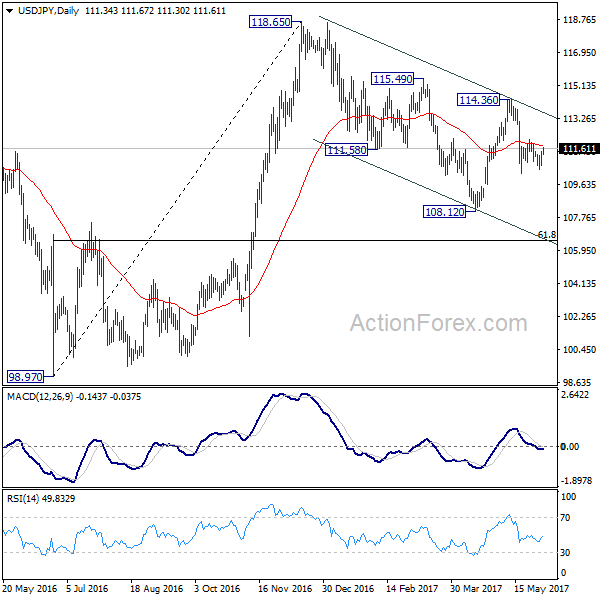
In the bigger picture, price actions from 125.85 high are seen as a corrective pattern. It's uncertain whether it's completed yet. But in case of another fall, downside should be contained by 61.8% retracement of 75.56 to 125.85 at 94.77 to bring rebound. Overall, rise from 75.56 is still expected to resume later after the correction from 125.85 completes.
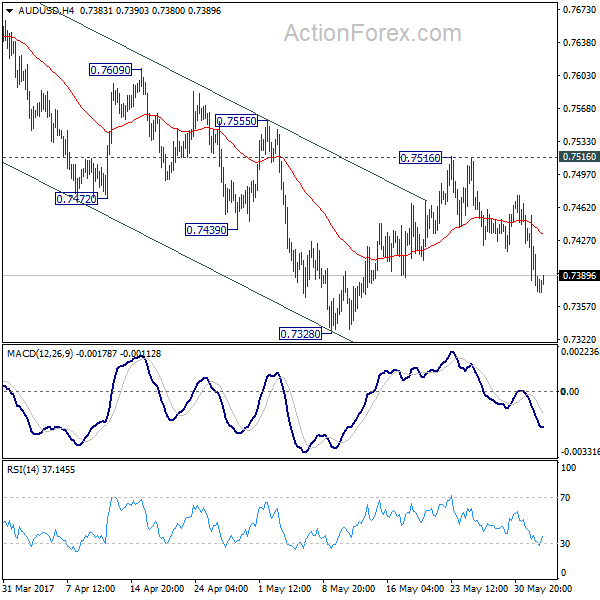
AUD/USD Daily Outlook
Daily Pivots: (S1) 0.7347; (P) 0.7400; (R1) 0.7429; More...
Intraday bias in AUD/USD remains mildly on the downside for 0.7328 support. Recovery from 0.7328 should have completed at 0.7516 after failing to sustain above 55 day EMA. Break of 0.7328 will resume whole fall from 0.7748 to 0.7144/7158 support zone. On the upside, break of 0.7516 resistance will indicate near term reversal and turn bias back to the upside.
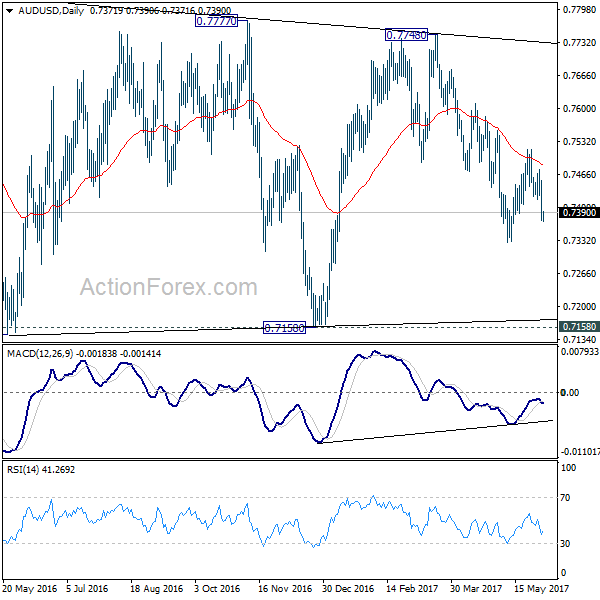
In the bigger picture, we're still treating price actions from 0.6826 low as a corrective pattern. And, as long as 38.2% retracement of 0.9504 to 0.6826 at 0.7849 holds, long term down trend from 1.1079 is expected to resume sooner or later. Break of 0.6826 low will target 0.6008 key support level. However, firm break of 0.7849 will indicate that rise from 0.6826 is developing into a medium term rebound, rather than a sideway pattern. In such case, stronger rise should be seen to 55 month EMA (now at 0.8115) and above.
USD/CAD Daily Outlook
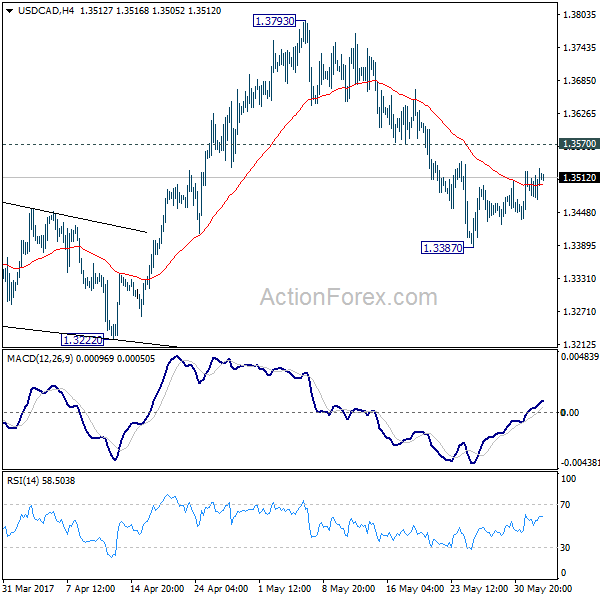
Daily Pivots: (S1) 1.3482; (P) 1.3505; (R1) 1.3538; More....
USD/CAD's consolidation from 1.3387 is still in progress and outlook is unchanged. Intraday bias remains neutral first. Upside of recovery is expected to be limited by 1.3570 resistance to bring another decline. At this point, we're still favoring the case that rise from 1.2968 has completed. And the larger rise from 1.2460 could have finished too. Below 1.3387 will target 1.3222 support first. Break of 1.3222 will affirm our bearish view and target 1.2968 key support level for confirmation. However, break of 1.3570 will turn focus back to 1.3793 high instead.
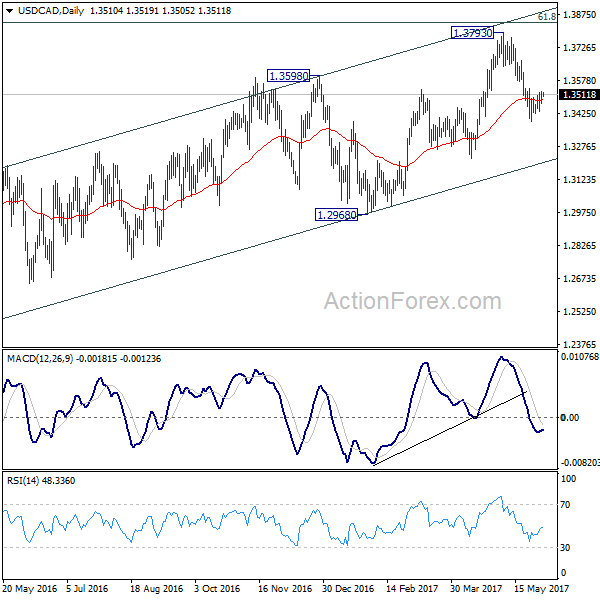
In the bigger picture, price actions from 1.4689 medium term top are seen as a correction pattern. The first leg has completed at 1.2460. Rise from 1.2460 is seen as the second leg and could have completed at 1.3793, ahead of 61.8% retracement of 1.4689 to 1.2460 at 1.3838. Break of 1.3222 should indicate the start of the third leg while further break of 1.2968 should confirm. Nonetheless, sustained trading above 1.3838 would pave the way to retest 1.4689 high.
DOW, S&P, NASDAQ Surged to Records on NFP Optimism, Dollar Stays Mixed
Major US indices surged to new record high overnight as boosted by solid ADP job data. Positive sentiments also carry on in Asian session. DOW gained 135.53 pts, or 0.65% to close at 2114.18, a record close even if it's slightly short of record intraday high at 21169.11. S&P 500 rose 18.26 pts, or 0.76% to close at 2430.06. NASDAQ rose 48.31 pts or 0.78% to close at 6264.83. Both were also record close. Nikkei follows in Asia and is trading up 1.4% at the time of writing, at 20140. That's also the first time Nikkei tops 20000 handle since December 2015. Elsewhere, 10 year yield closed up 0.021 at 2.217 but was way off session high at 2.239. Gold struggled to find follow through buying above 1270 again and is back at 1262. WTI crude oil stays soft at around 48.
In the currency markets, Sterling stabilized this week and is trading mildly higher against all other major currencies. In particular, the rebound in GBP/JPY, more thanks to weakness in Yen, suggests short term bottoming at 141.43. But the Pound could stay vulnerable as the election on June 8 approaches. Euro follows as the second strongest major currency for the week on expectation that ECB will tweak its language to the hawkish side in June meeting. Aussie and Loonie are trading as the weakest ones for the week so far, followed by Dollar. The greenback will look into today's non-farm payroll report.
A solid NFP expected with focus on wage
The markets are expecting NFP to show 185k growth in May. Unemployment rate is expected to be unchanged at 4.4%. Average hourly earnings are expected to rise 0.2% mom. Looking at other related data, the "rip-roaring" ADP report suggests that is upside potential in today's NFP. ADP private jobs grew 253k in May, well above expectation of 181k. Four week moving average of initial claims dropped to 238k in the week ended May 27, down from 243k four weeks ago. Continuing claims stayed below 2m handle for all of the May data released so far. Employment component of ISM manufacturing rose slightly to 53.5, up from 52.0. Conference board consumer confidence dropped for the second month to 117.9 in May but the three month average stayed at the highest level since 2001. Overall, there is much prospect of a strong NFP report today. The focus would be on whether such healthy growth in job markets could push up wages.
Trump announced withdrawal from Paris climate accord
Some attributed the surge in stocks to US President Donald Trump's announce to withdraw from the Paris accord on climate change. But we would like to point out that such a move should be well priced in as Trump is just delivering his election promise. And, based on the reactions from European leaders during and after Trump's visit to Europe, it was already clear that the withdrawal was a decision made. So, we'd maintain our view that the surge in stocks was mainly due to optimism on the US economy.
Trump announced US is withdrawing from the Paris climate pact yesterday and said that "we are getting out, but we will start to negotiate and we will see if we can make a deal, and if we can, that's great." Environmentalist reacted to the announcement with anger as many could easily predict. But there were also business leaders who expressed disagreement to the move. Tesla CEO Elon Musk tweeted that his is leaving the presidential councils and warned that "leaving Paris is not goof for America or the world:". Walt Disney CE Robert Iger also resigned from presidential council over the withdrawal, "as a matter or principle". Goldman Sachs CEO Lloyd Blankfein tweeted for the first time ever that the decision was a "setback for the environment and for the US's leadership position in the world".
Elsewhere...
Japan monetary base rose 19.4% yoy in May. Consumer confidence will be released in Asian session. UK will release construction PMI in European session while Eurozone PPI will be featured US and Canada will release trade balance today too. Meanwhile, the main focus is of course on US non-farm payroll.
USD/CAD Daily Outlook
Daily Pivots: (S1) 1.3482; (P) 1.3505; (R1) 1.3538; More....
USD/CAD's consolidation from 1.3387 is still in progress and outlook is unchanged. Intraday bias remains neutral first. Upside of recovery is expected to be limited by 1.3570 resistance to bring another decline. At this point, we're still favoring the case that rise from 1.2968 has completed. And the larger rise from 1.2460 could have finished too. Below 1.3387 will target 1.3222 support first. Break of 1.3222 will affirm our bearish view and target 1.2968 key support level for confirmation. However, break of 1.3570 will turn focus back to 1.3793 high instead.
In the bigger picture, price actions from 1.4689 medium term top are seen as a correction pattern. The first leg has completed at 1.2460. Rise from 1.2460 is seen as the second leg and could have completed at 1.3793, ahead of 61.8% retracement of 1.4689 to 1.2460 at 1.3838. Break of 1.3222 should indicate the start of the third leg while further break of 1.2968 should confirm. Nonetheless, sustained trading above 1.3838 would pave the way to retest 1.4689 high.
Economic Indicators Update
| GMT | Ccy | Events | Actual | Forecast | Previous | Revised |
|---|---|---|---|---|---|---|
| 23:50 | JPY | Monetary Base Y/Y May | 19.40% | 19.60% | 19.80% | |
| 5:00 | JPY | Consumer Confidence May | 43.5 | 43.2 | ||
| 8:30 | GBP | Construction PMI May | 52.6 | 53.1 | ||
| 9:00 | EUR | Eurozone PPI M/M Apr | 0.20% | -0.30% | ||
| 9:00 | EUR | Eurozone PPI Y/Y Apr | 4.50% | 3.90% | ||
| 12:30 | CAD | Labor Productivity Q/Q Q1 | 0.40% | |||
| 12:30 | CAD | International Merchandise Trade (CAD) Apr | 0.0B | -0.1B | ||
| 12:30 | USD | Trade Balance Apr | -45.5B | -43.7B | ||
| 12:30 | USD | Change in Non-farm Payrolls May | 185K | 211K | ||
| 12:30 | USD | Unemployment Rate May | 4.40% | 4.40% | ||
| 12:30 | USD | Average Hourly Earnings M/M May | 0.20% | 0.30% |
Market Morning Briefing: Aussie (0.7386) Remains Weak
STOCKS
Most of the stock indices are looking bullish for the coming week.
Dow (21144.18, +0.65%) has risen sharply and has come up to re-test previous high of 21170, also an important near term resistance. A break on the upside is needed to turn further bullish in the near to medium term.
Immediate support is seen near 12600 on Dax (12664.92, +0.40%). While that holds, a rise towards 12800 seems possible in the coming sessions.
Shanghai (3088.54, -0.45%) is trading lower and could test levels near 3050 before again bouncing back towards 3100-3150 over the next week. Overall ranged movement in the 3050-3150 region is possible in the next couple of weeks.
Nikkei (20139.31, +1.41%) has moved up sharply breaking above the 20000 resistance and while the rise sustains there is scope of rising towards 20500-21000 in the coming sessions. Near term looks bullish.
Nifty (9616.10, -0.05%) closed a little lower yesterday. We could possibly see a rise back towards 9650-9660 today. A small dip towards 9500 is possible next week before it resumes its upward rally towards 9700-9800.
COMMODITIES
Gold (1262.97) is struggling near the resistance zone of 1275-85 but the bears need a break below 1255-50 to confirm a fresh decline towards 1230 levels.
Silver (17.20) resolved the contraction phase to the downside but the support of 17.00 is holding so far. Similar to Gold, Silver requires a break below this immediate support of 17.00 for a confirmation of the downtrend.
Copper (2.57) has been consolidating in the range of 2.55-60 for the last few sessions. As discussed previously, it remains bearish below the short term channel resistance near 2.62/65 and the chances of a decline to 2.45-40 remains open but it could be prudent to be prepared for a sudden turnaround to the upside in the medium term.
Brent (50.41) is yet to show our expected recovery as it wanders just above our target/support of 50.00. A break below 50.00 may negate the chances of an immediate recovery and open up further downside towards 48.30. In that case, WTI (48.12) may test 47.00 to the downside and even lower levels below 46 may be on the cards.
FOREX
Dollar Index (97.21) has recovered some of the losses made in the previous 2 sessions on the back of better than expected American private hiring data but the resistance of 97.40-50 may limit the bounce after the US Job data release tonight.
Euro (1.1217) is in a minor pause after the sharp rally earlier in the week and may resume the uptrend soon for 1.1300.
Dollar Yen (111.61) is rising towards the higher end of its near term range of 110-112 but the resistance near 112.00 is expected to hold for the week. Repeat, it’s better to wait for a breakout as any attempt to gauge any directional clue from these oscillations may turn out to be deceiving.
As discussed yesterday, the chance of a prolonged phase of sideways consolidation of Pound (1.2874) in the broader range of 1.2750-1.3000 is strengthening every day and this phase may well extend to the next week.
Aussie (0.7386) remains weak and a failure to end the week above 0.74 may push it down to 0.7325 next week.
Dollar Rupee (64.50) to remain within 64.40-64.60 this week. A break on either side is needed to get some directional clarity.
INTEREST RATES
The US yields are mixed. The shorter term yields of 2YR and 5Yr are trading slightly higher today while the longer term 10YR (2.22%) and the 30Yr (2.87%) yields are stable.
The UK-US 10YR (2.16%) is headed lower and has enough scope on the downside. We could possible see a short bounce from 2.0% in the next week.
The UK yields have bounced back from immediate support levels as expected and could now move up in the coming sessions. The 5Yr (0.507%), 10YR (1.061%) and the 20YR (1.618%) are trading higher today.
The Japan yields have risen but could remain ranged in the near term. The 10Yr (0.06%) has risen the most among the other tenure yields and could be headed towards 0.08-0.10% in the near term.
Oil Prices Poised For Further Losses
Key Points:
- Oil's technicals are looking rather grim.
- The commodity seems to be shrugging off fundamental developments.
- The $45 handle could now be in the crosshairs for the bulls.
Oil prices could be in trouble moving forward as they seem to have shrugged off both renewed commitments from OPEC and a 6.43M barrel draw in US inventories. This could be, in part, a result of the technical bias which is looking fairly dour going ahead. Indeed, current readings are suggesting that we could see the commodity retreats to the $45 mark within a fairly short timeframe.
More precisely, whilst we are currently seeing oil hover above a robust support level at 47.70, there is growing evidence to suggest further losses are now warranted. For one thing, we can see that the 12 and 20 day moving averages have just completed a bearish crossover and the overall EMA bias is now in highly bearish. Furthermore, the MACD and signal line have also experienced a crossover – a sign that oil prices are predisposed to a tumble in the coming days.
If we take a closer look at a number of other technical indicators, the story remains largely consistent with the EMA bias. Notably, the Parabolic SAR is still well and truly above price action and is, therefore, signalling that a continuation of the downtrend is likely to occur. Moreover, a decline back to the downside of the bearish channel would be in line with the regression trend analysis which continues to suggest downside risks are abundant.
Speaking of the channel, the structure highlighted in the above chart represents a near-term cap on downsides but we may see a reversal prior to an actual challenge to the lower constraint. Specifically, the $45 handle should hold as a support zone given that there is a historical zone of support around this price. Additionally, both stochastics and RSI would be deeply oversold around this price if oil tumbles at its current pace which will be worth keeping in mind.
Ultimately, the future isn't looking too buoyant for oil prices and it's only likely to get worse unless OPEC members can pull something major out of their collective hats. However, do keep an eye on the North American rig count data as, if the uptick in active rigs begins to slow, this could help to give some credence to OPEC's cuts – potentially saving the embattled commodity from sinking much further.