Sample Category Title
Foreign Exchange Market Commentary: EUR/USD, USD/JPY, GBP/USD, GOLD, WTI CRUDE, DJIA, FTSE100, DAX
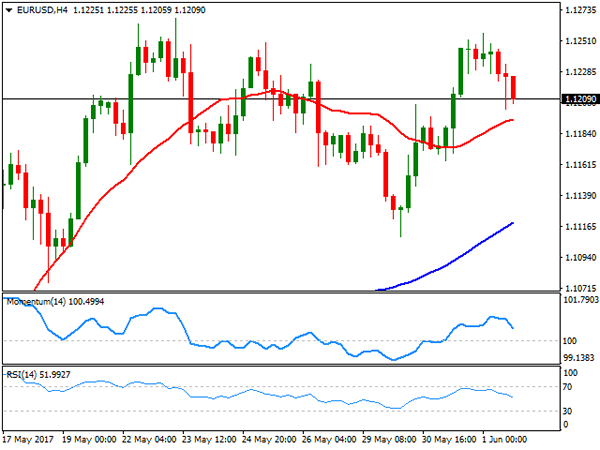
EUR/USD
The EUR/USD pair ended marginally lower this Thursday, with the dollar finding support in a stronger-than-expected ADP employment survey. The US private sector added 253,000 new jobs in May, well above market's forecast of 239K and previous 174K. Unemployment claims however, surged in the week ended May 26, with the number of Americans filing for benefit claims reaching 248K from previous 235K, pausing initial enthusiasm over the US employment sector's health. Both numbers, however, anticipate another solid NFP report for this Friday that anyway would probably do little for the greenback, unless it's a big disappointment, in which case, will only fuel the negative stance towards the US currency.
Technically, the bullish momentum in the pair has faded partially, but the pair is far from bearish, considering is barely 50 pips away from its 2017 high. The 4 hours chart shows that the price holds above all of its moving averages, with the 20 SMA barely below the current level and losing upward strength, whilst technical indicators eased within positive territory, nearing their mid-lines. Anyway, much of the upcoming direction will depend on the outcome of the NFP report, with the scale lean towards the upside. The pair topped at 1.2156 this week, and at 1.2167 for May and 2017, the level to surpass to confirm further gains ahead. Below 1.1160, on the other hand, the downward corrective movement could extend down to 1.1080 without actually affecting the dominant bullish trend.
Support levels: 1.1200 1.1160 1.1120
Resistance levels: 1.1265 1.1300 1.1345
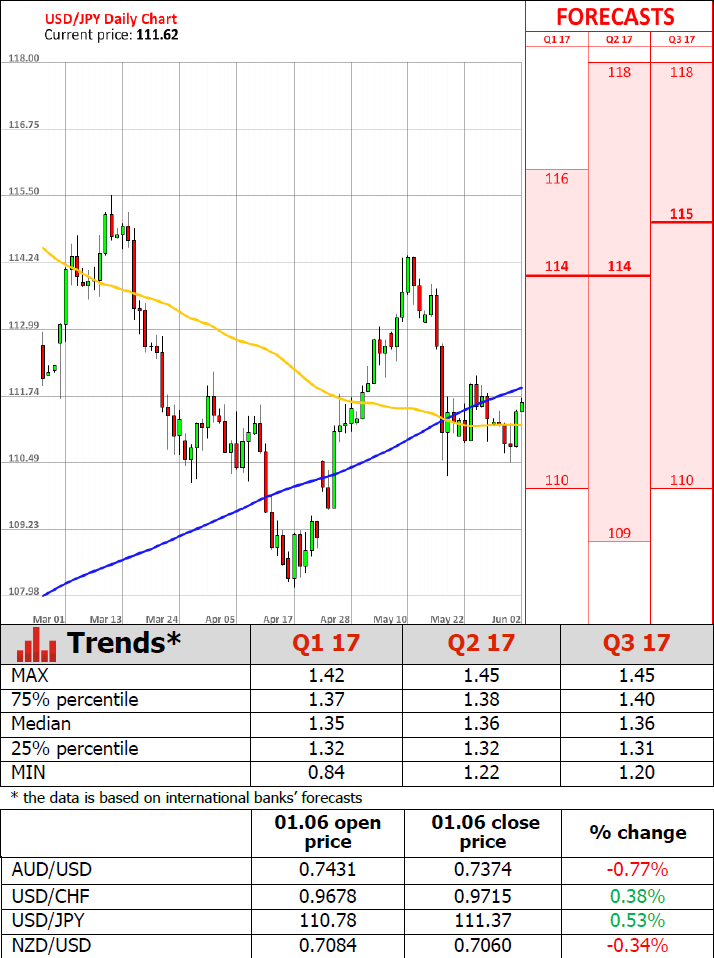
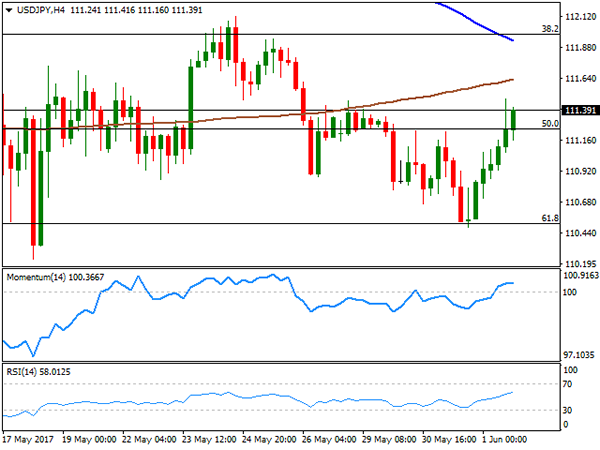
USD/JPY
The USD/JPY pair recovered ground, advancing up to 111.47 in the American afternoon, and settling not far below it. The recovery may have had more to do with technical readings than with fundamentals, as the pair bottomed around 110.50 late Wednesday, the 61.8% retracement of the 108.12/114.36 rally seen between April and May. The Nikkei-Markit manufacturing PMI rose to 53.1 in May from, 52 .7 in April, a healthy figure, although rising yields and a strong ADP report weighed more. The short term picture is modestly positive for the USD/JPY pair, as the pair remains near its daily highs, whilst technical indicators in the 4 hours chart stand in positive territory. Still, the price remains below its moving averages, and more relevant, the 112.00 level, the 38.2% retracement of the mentioned rally and where the pair met selling interest last week. The US Nonfarm Payroll report will need to surprise big towards the upside to be able to push the pair beyond this last.
Support levels: 111.20 110.80 110.50
Resistance levels: 111.60 112.00 112.45
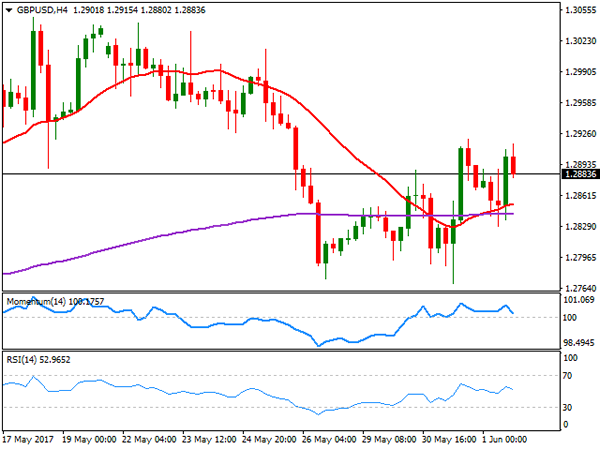
GBP/USD
The GBP/USD pair stands barely 10 pips above from its daily opening, having traded on the upper half of Wednesday's range over the past 24 hours, but unable to regain the 1.2900 mark. News coming from the UK were a bit better this Thursday, as the UK final Markit manufacturing PMI came in at 56.7, better than the 56.5 expected and not far below the three-year high posted in April at 57.3. Election's jitters however, still weigh on Pound, with polls coming at a faster pace just one week ahead of the event, and with more notorious headlines. The latest one, published by The Independent, showed that PM May's lead is at its lowest, just three points ahead of her Labour rivals, clearly limiting Pound's gains. Technically, the 4 hours chart shows that choppy trading persists, but also that the price is above its 20 SMA and 200 EMA, both in a tight range in the 1.2840/50 region, whilst technical indicators turned lower within positive territory, heading lower within neutral territory. Given Pound's weakness, a strong US employment report could put the pair under pressure, but a break below the 1.2760 region seems unlikely at this point.
Support levels: 1.2840 1.2800 1.2760
Resistance levels: 1.2920 1.2960 1.3000
GOLD
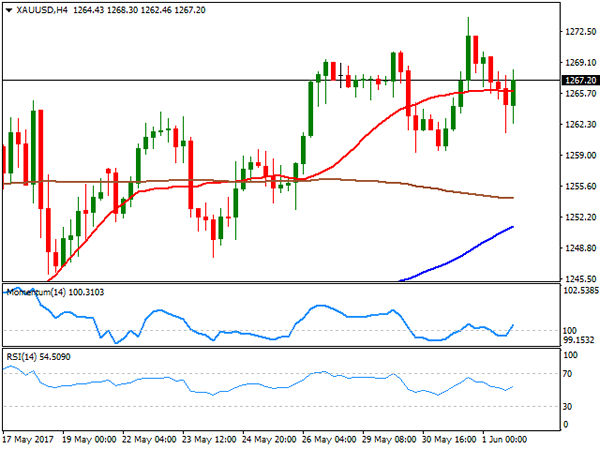
Spot gold lost some ground this Thursday, ending at $1,267.41 a troy ounce. The commodity held steady after reaching a fresh 1-month high on Wednesday, easing modestly amid a stronger greenback and resurging optimism among stocks' traders. Still, investors remained in cautious mode ahead of the NFP report and upcoming events this June, including the UK election and the US Fed meeting. From a technical point of view, the commodity remains in positive territory but losing upward potential, as in the 4 hours chart, the price remains well above its moving averages, although technical indicators hover within positive territory, turning modestly lower but with not enough strength to support a downward move. In the 4 hours chart, the price is hovering around a flat 20 SMA, whilst technical indicators turned north around their mid-lines, but remain below previous weekly highs, suggesting that a break above the high set at 1,274.05 is required to confirm additional gains ahead.
Support levels: 1,265.90 1,254.60 1,245.20
Resistance levels: 1,274.05 1,283.10 1,295.40
WTI CRUDE OIL
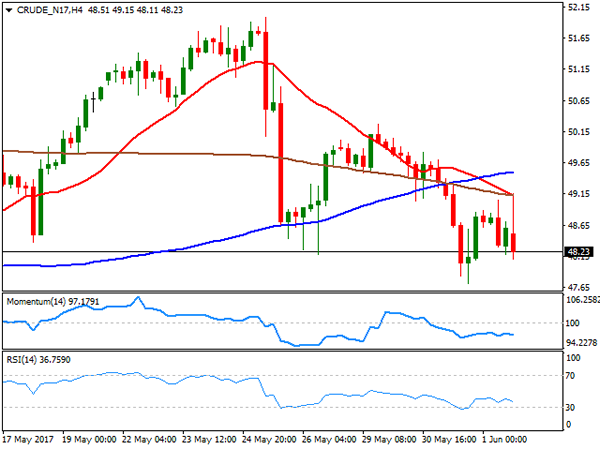
Crude oil prices advanced intraday following the release of the US EIA report, showing that US commercial stockpiles fell by 6.4 million barrels in the week ended May 26, beating expectations of a 2.5 million barrels' decline. Nevertheless, the commodity was unable to hold on to gains, and closed the day in the red, with West Texas Intermediate futures settling at $48.20 a barrel, despite being the eighth consecutive drop in US stockpiles, as the report also showed that inventories stand near record highs, whilst refineries keep operating at 95% of their capacity. The daily chart shows that the price remained below its moving averages and trading within the lower half of Wednesday's range, whilst technical indicators entering bearish territory, and particularly the RSI heading south around 41. In the 4 hours chart, selling interest surged on a test of a bearish 20 SMA, whilst technical indicators have lost their bearish strength, but hold well below their mid-lines.
Support levels: 47.70 47.10 46.45
Resistance levels: 48.60 49.30 49.90
DJIA
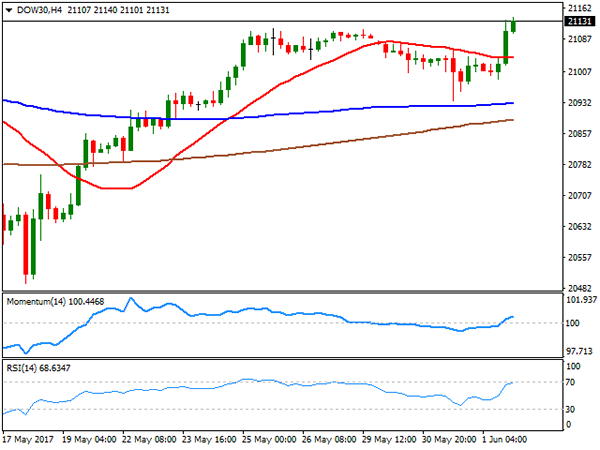
Wall Street rallied this Thursday, with the Dow Jones Industrial Average settling at an all-time high of 21,144.18, up by 135 points, while the Nasdaq Composite also advanced, adding 48 points to end at 6,246.83. The S&P closed at 2,430.06, up by 0.76%. A better-than-expected ADP report boosted markets' confidence, alongside with upward revisions to final manufacturing PMIs in May. Financials and health-care equities led the advance, with UnitedHealth Group up 2.32%, followed by Goldman Sachs that gained 1.79%. Nike was the worst performer, down by 1.08%, followed by Verizon Communications that shed 0.50%. The Dow daily chart shows that technical indicators head north after bouncing from their mid-lines, maintaining their upward strength, and near its recent highs, whilst the index is advancing above a still horizontal 20 DMA. In the shorter term, and according to the 4 hours chart, the benchmark accelerated through a still flat 20 SMA, while technical indicators entered positive territory with a moderate upward momentum, supporting additional gains that will anyway depend on the NFP report.
Support levels: 21,091 21,045 21,002
Resistance levels: 21,140 21,190 21,235
FTSE100
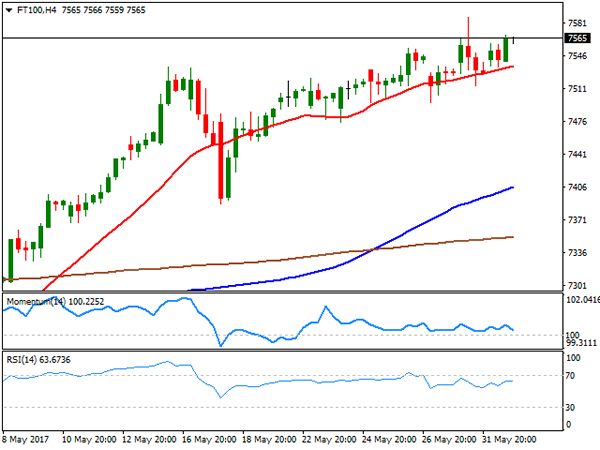
The FTSE 100 added 23 points, to end at 7,543.77 this Thursday, recovering after a two-day decline, helped by a mute Pound and better-than-expected local manufacturing data. Additionally, stocks' traders sentiment improved following the release of the US ADP employment survey, anticipating some strong gains in the jobs' sector for May. Exporters were among the best performers, with Paddy Power up 4.34%, leading advancers, followed by 3i Group that added 3.58%. Mediclinic was the worst performer, down by 3.40%. The daily chart for the index shows that it stalled near the intraday record high posted on Wednesday, still holding on to a bullish stance, as technical indicators resumed their advances within positive territory, whilst the index remains far above bullish moving averages. In the shorter term, and according to the 4 hours chart, the index keeps finding buying interest on retracements towards a bullish 20 SMA, whilst the Momentum indicator remains flat around its 100 level, while the RSI indicator heads modestly higher around 65, in line with further advances.
Support levels: 7,550 7,515 7,490
Resistance levels: 7,587 7,620 7,660
DAX
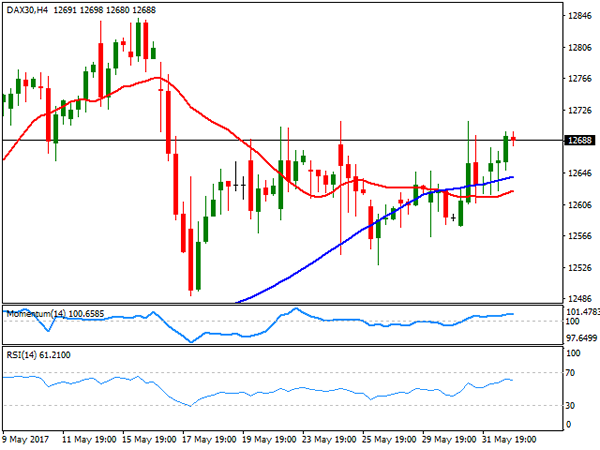
The German DAX advanced 50 points or 0.40% at 12,664.92, up daily basis on the back of positive data coming from both shores of the Atlantic. The EU manufacturing sector was confirmed to have grew at its fastest pace in six years last May, prompting demand for local equities. Within the DAX Linde was the best performer with a 3.24% gain, followed by Bayerische Motoren that added 1.87%, with the automotive sector leading the advance. ThyssenKrupp led decliners with a 1.31% loss, followed by Deutsche Boerse that closed 0.63% lower. The index is slowly grinding higher near record highs, but still lacks momentum in the daily chart, given that the index is now hovering around its 20 SMA, whilst the Momentum indicator remains flat around its 100 level. The RSI indicator however, aims north around 59, anticipating some additional gains for this Friday. In the 4 hours chart, the technical outlook is neutral-to-positive, as technical indicators hold flat within positive territory, as the index develops above its 20 and 100 SMAs, both lacking directional strength.
Support levels: 12,649 12,602 12,542
Resistance levels: 12,729 12,781 12,843
NFP In Focus, Oil Weighs On CAD
US: Strong NFP expected
The market is looking for a solid May job report, especially after ADP’s upside surprise. According to data collected by the ADP Research Institute, US companies added 253k jobs in May, well above estimates of 180k, while the previous month’s reading was upwardly revised to 174k.
Expectations for Nonfarm payrolls, which are due for release at GMT 12:30 today, are therefore quite high, suggesting that the risk is mostly on the downside for the greenback. Markets are expecting a reading of 182k in May, compared to 211k in April. In this current set-up, a weaker print will drive the USD lower, especially against the euro, while an upside surprise should have limited effects as it is already priced in.
We believe the market is impatiently waiting for the recent and sustained employment gains to finally translate into wage growth. Indeed, a solid pick-up in average hourly earnings (expected at 2.6%y/y) should drive the USD higher as it would allow for a more aggressive path of tightening from the Federal Reserve. EUR/USD has been treading water slightly above 1.12 in the European morning.
CAD looks Vulnerable on weak crude
President Trump's decision to walk away from the Paris Climate Accord is likely to result in additional oil production. This is not supportive of oil since recent reports indicate that OPEC nations - that are exempt for production cuts - have started to increase production. According to a Bloomberg report, total OPEC production increased by 315k barrel/daily to 32.21mln.
In addition, softness in 1Q US suggests that the demand backdrop is not as supportive as originally anticipated. With oil at already low prices, it is difficult to visualise further weakness. However, sustained $48 brl oil ($45-$55 range) will drag certain economies down. Canada and Mexico run external deficits at this oil prices range so an extend period of weakness will only worsen balances. Further erosion in economic positions is likely to hurt their currencies. In addition, with CAD negative carry with USD will pressure traders to quickly liquidate positioning given the choice.
On the other hand, Russia and Norway as oil exporters can generate current account surpluses and support mid-term currency strength. From a trading perspective we suspect the RUB is overbought and comments from the central bank indicated their discomfort with the strong currency would keep away. Yet, short CAD (long USDCAD) looks very attractive on fundamental basis. USDCAD held key support at 1.3385 on the bearish shift for oil and break above 1.3570 would suggest further bullish momentum.
Technical Outlook: AUDNZD – Steep Downtrend Eyes 2017 Low At 1.0324
The Aussie dollar remains in steep descend against its New Zealand counterpart and approaches round-figure 1.0400 support on fresh bearish extension on Friday.
The pair is riding on extended wave C of five-wave cycle from 1.1019 (16 Mar peak) which met its 138.2% Fibonacci expansion and could travel to key support at 1.0324 (217 low, also FE 161.8%).
Series of long red daily candles weigh and maintain strong bearish pressure, along with recently formed 10/200SMA Death Cross.
The pair is also on track for third consecutive strong weekly close in red that reinforces strong bearish stance.
Previous week’s long bearish candle marks the biggest one-week loss since the last week of Apr 2016 and also produces strong bearish pressure, along with thick weekly cloud (cloud base lies at 1.0533).
Deeply oversold daily studies suggest correction, however, no firmer signal being generated so far that keeps the pair in strong downtrend.
Corrective actions should be ideally capped under weekly cloud base, reinforced by falling 10SMA.
Res: 1.0453, 1.0500, 1.0533, 1.0598
Sup: 1.0400, 1.0374, 1.0324, 1.0236
NFP: The Final Confirmation For A June Rate Hike ?
The crucial US labour market data for May will be released today, June 2nd at 13:30 BST. It includes non-farm payrolls, unemployment rate and average hourly earnings. Please note that the release of US labour market data will likely cause volatility for USD, USD crosses and commodities.
Non-farm payroll in April was 211K, beating the shocking low downward revised reading of 79K in March. The unemployment rate in April hit a record low of 4.4%, not seen since May 2007.
US unemployment rate has seen a downtrend since 2010 and has stabilised in a range between 4.6% – 5% since early 2016. The readings over the past two months had continued reaching even lower than 4.6%, indicating the US labour market remains sound.
Average wages have seen an upswing since early 2015, however seeing a moderate slowdown over the past three months.
Be aware that, the revision figures are also significant which also affect data performance. In addition, based on prior experience after the release of the data, market trends sometimes reverse within 1-2 hours after the initial move.
The Fed sees the labour market as close to full employment. The FOMC June meeting will be held on Wednesday June 14th. Per the CME FedWatch tool, the probability for a rate hike in June has rose to 95.8%. If the incoming US labour market data overall in line with or better than consensus, despite the uncertain political climate, markets will likely see a June rate hike to happen nearly for sure, which will likely strengthen USD.
Originally markets expect two more rate hikes by end of the year: in June and September respectively. Nevertheless, per the FOMC May meeting minutes released on May 25th, the Fed sees to raise rates once again is ‘soon be appropriate’, and considers it prudent to wait for further evidence for subsequent rate hikes. That said, it will likely take an extended period to raise rates after a June rate hike, unless seeing incoming data continuously being robust.
On Thursday June 1st, the dollar index bounced around 0.87%, breaking the 97.00 resistance level. This morning in early European session, USD consolidates ahead of NFP, trading around 97.15.
On Thursday, USD/JPY rallied 0.21% hitting a 1-week high of 111.70. EUR/USD fell by 0.27%. AUD/USD plunged by 0.75%. NZD/USD fell by 0.31%. Spot gold fell by 0.23% on Thursday and hit a 1-week low of 1258.92 on Friday morning.
Technical Outlook: AUDUSD – Weekly Cloud Base In Focus, Limited Correction To Precede Fresh Downside
The Aussie is consolidating in a narrow range on Friday, holding above fresh three-week low at 0.7370, posted after strong two-day fall.
Australian currency accelerated lower strongly on Thursday, pressured by weak Chinese data and generated strong bearish signal on daily close below 0.7400 pivot (Fibo 61.8% of 0.7328/0.7517 upleg).
Two long red daily candles on Wed/Thu weigh on near-term action which shows risk of return to key short-term support at 0.7328 (09 May low / weekly cloud top).
Slow stochastic entered oversold territory on daily chart, suggesting stronger hesitation on approach to 0.7328 target, however, no firmer signal being generated for now.
The pair is also on track for strong weekly bearish close which is expected to maintain bearish pressure.
Broken 0.7400 support now acts as initial barrier, followed by converged daily Kijun-sen / Tenkan-sen lines at 0.7442/43, where extended upticks should be capped.
Res: 0.7400, 0.7421, 0.7443, 0.7475
Sup: 0.7370, 0.7350, 0.7328, 0.7300
Technical Outlook: USDJPY – Extended Recovery Pressure Daily Cloud Top
The dollar remains well support against yen on Friday and extends rally of the previous day, sparked by upbeat US data. Recovery extension on Friday hit one week high at 111.70 and pressures key near-term barrier at 111.80, provided by top of daily Ichimoku cloud. Near-term studies are back to bullish mode and turn bias higher, as Friday's price action is underpinned by formation of 10/55SMA's bull-cross. Firm break above daily cloud would trigger fresh acceleration higher for test of resistances that lay between 111.95 and 112.28, consisting of 30/20 and 100SMA's. The pair may pause under 111.80 pivot, awaiting release of US NFP data for fresh signals. Broken 10 and 55 SMA's offer immediate supports at 111.33/24, with extended dips not to exceed 111.00 handle to keep near-term bullish bias in play.
Res: 111.70, 111.80, 112.12, 112.28
Sup: 111.24, 111.00, 110.62, 110.50
Trade Idea: GBP/USD – Hold short entered at 1.2920
GBP/USD – 1.2867
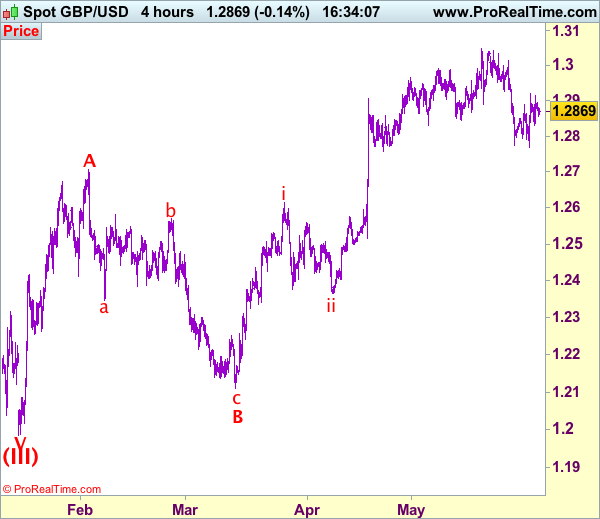
Recent wave: Wave V of larger degree wave (III) has ended at 1.1986 and major correction has commenced from there for gain to 1.3000 and 1.3140-50
Trend: Near term up
Original strategy :
Sold at 1.2920, Target: 1.2770, Stop: 1.2920
Position: - Short at 1.2920
Target: - 1.2770
Stop: - 1.2920
New strategy :
Hold short entered at 1.2920, Target: 1.2770, Stop: 1.2920
Position: - Short at 1.2920
Target: - 1.2770
Stop:- 1.2920
Although the British pound rebounded after finding support at 1.2769 earlier this week, as sterling met resistance at 1.2921 and has retreated, retaining our bearishness and as long as this level holds, mild downside bias remains, below 1.2840 would signal the rebound from 1.2769 has ended, bring weakness to 1.2800, then retest of said support, break there would extend recent decline from 1.3048 to support at 1.2757 which is likely to hold on first testing.
Our preferred count on the daily chart is that cable's rebound from 1.3500 (wave (A) trough) is unfolding as a wave (B) with A ended at 1.7043, followed by triangle wave B and wave C as well as wave (B) has ended at 1.7192, the subsequent selloff is the larger degree wave (C) which is still unfolding with minor wave (III) of larger degree wave 3 ended at 1.1986, hence wave (IV) correction is in progress which could either be a triangle wave (IV) of a complex formation but upside should be limited to 1.3500 and price should falter well below 1.4000, bring another decline in wave (V) of 3 for weakness to 1.1500, then 1.1200.
On the upside, above 1.2921-26 (said resistance and previous support) would defer and suggest low has been formed instead, risk a stronger rebound to 1.2965-70 and possibly towards 1.3000 but only break of resistance at 1.3015 would signal the retreat from 1.3048 has ended.
British Manufacturing Activity Slows In May But Less Than Expected
'The sector should have sufficient momentum to see it through the uncertainty generated by the current unexpected general election and into the start of Brexit negotiations later in the quarter.' - Rob Dobson, IHS Markit
Manufacturing activity in the United Kingdom fell less than expected last month, a private survey revealed on Thursday. Markit reported that its PMI for the British manufacturing sector came in at 56.7 points in May, the strongest since June 2014, down from the preceding month's 57.3. However, market analysts anticipated a bigger drop to 56.5 during the reported month. Furthermore, Markit noted that new order growth remained strong, whereas the pace of job creations hit its 35-month high in May. The Markit Senior Economist Rob Dobson said that the strong PMI data suggested that the British economy gained positive momentum in the second quarter. Strong manufacturing activity is set to provide a boost to the UK Prime Minister Theresa May's ruling Conservative Party ahead of the 2017 General Election, which is scheduled to take place on June 8. Markit also noted that domestic demand remained the key driver of growth in the manufacturing sector. Apart from that, the report showed that manufacturers' optimism over the economy hit a 20-month high last month.
Trade Idea: GBP/JPY – Hold short entered at 143.65
GBP/JPY - 143.55
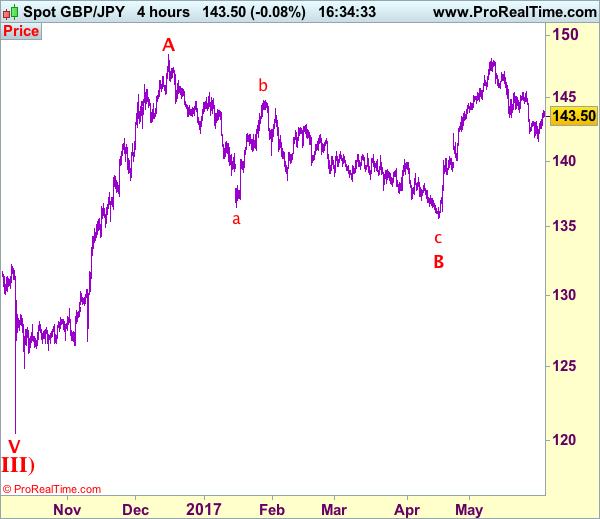
Recent wave: Medium term low formed at 120.50 and (A)-(B)-(C) major correction has commenced with (A) leg ended at 148.45, hence wave (B) is unfolding for retreat to 131.00-10.
Trend: Near term up
Original strategy:
Sold at 143.65, Target: 141.65, Stop: 144.25
Position: - Short at 143.65
Target: - 141.65
Stop: - 144.25
New strategy :
Hold short entered at 143.65, Target: 141.65, Stop: 144.00
Position: - Short at 143.65
Target: - 141.65
Stop:- 144.00
Although sterling edged higher to 143.95, as price has retreated after meeting resistance there, suggesting as long as this level holds, consolidation with mild downside bias would be seen and weakness to 143.00, then 142.50-55 would be seen, however, break of latter level is needed to signal the rebound from 141.50 has ended, bring another fall towards this level. Looking ahead, below said support at 141.50 would extend the selloff from 148.10 top to 141.00 but loss of momentum should limit downside to 140.50-55 and price should stay above psychological support at 140.00, bring rebound later.
In view of this, we are holding on to our short position entered at 143.65. Above 143.95-00 would risk a a stronger rebound to 144.50 but upside would still be limited to 145.00 and price should falter well below said resistance at 145.45, bring another decline later.
Our preferred count is that larger degree wave V with circle is unfolding from 251.12 with wave (I) 219.34, (II): 241.38 and wave (III) is subdivided into 1: 192.60, 2: 215.89 (23 Jul 2008) and wave 3 ended at 118.87 earlier in 2009. The correction from there to 162.60 is wave 4 which itself is a double three and is labeled as first a-b-c ended at 151.53, followed by wave x at 139.03, 2nd a ended at 162.60, 2nd b at 146.75 and 2nd c leg of wave 4 ended at 163.00. Therefore, the decline from 163.00 to 116.85 is now treated as wave 5 which also marked the end of larger degree wave (III), hence wave (IV) major correction has commenced for retracement of the wave (III) from 241.38 and upside target at 183.95-00 (50% Fibonacci retracement of the wave (II) from 241.38) had been met, a drop below 160.00 would suggest wave (IV) has ended at 195.85, bring decline in wave (V) for initial weakness to 130 (already met) and 120.
US Companies Create 253K New Jobs Last Month Vs 181K Forecast
'The current pace of job growth is nearly three times the rate necessary to absorb growth in the labor force. Increasingly, businesses' number one challenge will be a shortage of labor.' — Mark Zandi, Moody's Analytics
US private companies created more than expected jobs last month, official figures showed on Thursday. The ADP National Employment Report revealed that the US private sector added 253K new jobs to the economy in May, compared to the preceding month's downwardly revised gain of 174K positions. Meanwhile, analysts expected private firms to create 181K new jobs during the reported month. The Moody's Analytics Chief Economist Mark Zandi said that wage growth would likely accelerate 'through the year into 2018' amid the tightening labour market. Strong job creation is expected to comfy the Federal Reserve and force it to raise interest rates further in the upcoming months. The ADP data come ahead of the Labour Department's non-farm payrolls report, scheduled to be released on Friday. According to analysts, both US private and public sector created 181K new jobs last month, following April's gain of 211K new positions. Moreover, the jobless rate is set to come in at 4.4% for May, unchanged from the previous month. Economists suggest that the US labour market is close to or at full employment.