Sample Category Title
Dollar Rebuffed on Disappointing Non-Farm Payrolls
- European equity markets joined WS and Asian optimism and currently trade around 0.5% higher with the German Dax outperforming (+1.5%). US equity markets opened nearly unchanged despite the disappointing payrolls report.
- May US payrolls disappointed. Net job growth was 138k, down from 174k in April and below 182k consensus. The previous two months' numbers were downwardly revised by 66k. The unemployment rate declined to 4.3%, the lowest level since early 2001, but it was mainly due to a decline of the labour force participation rate. Average hourly earnings stabilized at 2.5% Y/Y while consensus expected an acceleration to 2.6% Y/Y.
- International anger at Trump's decision to withdraw from the Paris climate agreement has been led by the US's closest G7 allies, with Germany, France and Italy warning that they are unwilling to renegotiate the treaty. UK PM May abstained from the statement and indicated she believed policy on climate should be left to Washington.
- Oil prices extended losses to hit a three-week low, after rising U.S. production and President Trump's withdrawal from the Paris Climate Accord overrode the fall in crude inventories there. Brent crude dropped below the psychological $50/barrel mark.
- British construction activity grew at its fastest rate since the end of 2015 last month, as a pick-up in house building helped builders shake off a lacklustre start to the year. The Markit/CIPS construction PMI jumped to 56.0 from 53.1, its highest since December 2015, way above 52.6 consensus.
Rates
Disappointing payrolls push US 10y yield to 2.16%
Global core bond trading was uneventful, as usual, ahead of the US payrolls report. A disappointment across the line lifted core bonds with US Treasuries outperforming German Bunds. The US 10-yr yield tested key support at 2.16%, but a break didn't occur. The payrolls weren't that bad that they question a June rate hike. However, investors may at one point put the Fed's tightening intentions in doubt if data continue to disappoint in H2 2017, which is not our base scenario. At the time of writing, US yields drop 1.2 bps (2-yr) to 3.8 bps (10-yr). Changes on the German yield curve range between -0.8 bps (2-yr) and -2.3 bps (10-yr). On intra-EMU bond markets, 10-yr yield spreads versus Germany barely moved with Portugal underperforming (-5 bps).
The US economy created 138k jobs in April, below 182k consensus. The previously two payrolls numbers were downwardly revised by 66k, implying a total negative surprise of 110k which is very significant. Average hourly earnings stabilised at 2.5% Y/Y, while consensus expected an acceleration to 2.6% Y/Y. That's also disappointing in the current environment where the Fed reached its full employment target, but not its price stability target. The unemployment rate unexpectedly dropped to 4.3%, the lowest level since early 2001, but that was mainly due to a decrease in the labour force participation rate. Overall, it was a disappointing payrolls report.
Currencies
USD rebuffed on disappointing payrolls
The US payrolls were the dominant factor for FX trading. They missed consensus by quite a big margin and triggered a new wave of USD selling. EUR/USD extensively tested the 1.1268 area. No sustained break occurred yet, but the heat is still on. USD/JPY also fell off a cliff. The pair almost lost a big figure and trades in the 110.60/70 area. The dollar isn't out of the woods yet.
Overnight, yesterday's US equity rally continued in Asia with Japanese indices taking the lead. There were plenty of headlines on the BOJ's balance nearing the JPY 500 trillion milestone. However, it hardly weakened the yen. USD/JPY touched an intraday top in the 111.68 area, but the decline of the yen remained modest given the equity performance. EUR/USD (1.1220 area) was little changed from yesterday's close.
European equities joined the risk rally from the US and Asia. However, there was hardly any fall-out on yields or the FX markets. Interest rate differentials between the US and Europe/Germany barely changed. EUR/USD held a tight range in the low 1.12 area. Despite a good equity run, USD/JPY even declined slightly off the Asian top despite the equity rally and settled in the mid 111 area, awaiting the US payrolls release.
The US payrolls brought quite a significant miss. Taking into account the revision of the previous months, job creation was 110K lower than expected. Wages (2.5% Y/Y) were marginally softer than expected. The unemployment rate declined to 4.3%, but for the wrong reason (lower participation rate, decline labour force). The market reaction was straightforward. US yields and the dollar declined. The setback of equities (futures) remained modest. EUR/USD extensively tested the 1.1268 recent top. This test is ongoing. USD/JPY also fell off a cliff. The pair changes hands in the 110.75 area. No technically important levels area broken, but the picture is again becoming heavy.
EUR/GBP retests the recent highs after the payrolls
Sterling trading initially showed no clearer trend today and was confined to rather tight ranges. The construction PMI was surprisingly strong at 56.00 (from 53.1 (vs. 52.6 expected). However, as was mostly the case of late, good UK eco data were unable to counterbalance political uncertainty. A Ipso Mori poll also indicated that the lead of the Conservatives over Labour had declined to 5%., keeping sterling in the defensive. In the afternoon, cable underperformed EUR/USD as the dollar was sold after the US payrolls report. EUR/GBP is currently again testing the recent highs in the mid 0.87 area. Cable temporary spiked to the 1.2 area, but the gain could not be sustained. The pair trades currently again in the 1.2870 area, a level that was also on the screens this morning before the US payrolls.
Slower-than-Expected May U.S. Payrolls Though Greater Strength in the Details
Highlights:
- Employment a less-than-expected 138k in May following downwardly revised 174k (previously 211k) and 50k (was 79k) increases in April and March, respectively.
- Private employment rose 147k following a 173k increase in April.
- The unemployment rate declined to a new cycle-low of 4.3%. The broader 'U6' rate popular among Fed officials declined to 8.4% - also a new cycle low - from 8.6% in April.
- Average hourly earnings rose 0.2% on a month-over-month basis and 2.5% from a year ago.
The May employment increase was smaller than expected - and more-so when adding in downward revisions to earlier months. Slower employment growth has long been expected, though, as slack in labour markets is increasingly absorbed. Put in context, the average 162k monthly increase in employment yearto- date, and even the more modest 121k average over the last three months, is still above most estimates of the pace needed to keep downward pressure on the unemployment rate. Indeed, the unemployment rate inched lower to 4.3% in May, and is down almost half a point over the last three months.
Labour force participation also declined in May but there is little sign that a 'discouraged' worker effect was behind that drop. The broader 'U-6' unemployment rate, which includes discouraged workers as well as involuntary part-time workers, declined more than the official unemployment rate and wages continued to increase at a 2.5% year-over-year pace. In short, although the headline employment gain was weaker than expected, there is little in the details to suggest a fundamental weakening in labour markets that would prevent the Fed from hiking rates again in June.
Job Growth Moderates, Unemployment Overstates Strength
The early survey week kept headline job gains lower than trend - watch for a June rebound. Meanwhile job and wage numbers for May still support the case for continued economic growth and stronger income.
Jobs Up 138,000 in May: More Consistent with Fundamentals
Nonfarm payrolls rose a modest 138,000, with the three month average at 121,000 jobs. This morning's print is consistent with the demographics of the labor force and the anecdotal comments of a skills shortage. Hiring in the services sector remained above its three month moving average, as gains in business services, education & health and leisure & hospitality were solid. Retail continues to exhibit weakness due to ongoing structural challenges. Financial services continue to exhibit modest gains.
In the goods sector, manufacturing employment posted a decline out of line with other indicators, although April's reading was revised up. Hiring in construction, however, was up 11,000 jobs, likely reflecting some seasonal improvement. State and local employment declined - particularly noneducational related. Our outlook remains for a rebound in real GDP growth in Q2 and gains of roughly 2.5-3.0 percent for the second half of this year.
Wages: Not an Isolated Number but Part of the Economic System
Average hourly earnings rose 0.2 percent in May, keeping the year-ago pace of wage growth at 2.5 percent. Despite continued steady job growth in 2017, earnings have yet to break out of this mid-two percent pace. The softer inflation readings over the past couple months have likely weighed on nominal wage growth. On balance, average hourly and weekly earnings continue to improve and, along with more jobs, support the case for household income gains.
Over the longer run, wages reflect the economic fundamentals of the labor market, and those fundamentals include productivity and inflation (middle chart). During the current cycle, analysts have repeatedly commented on low productivity, while inflation has been persistently below the FOMC's target of two percent. With both productivity growth and inflation continuing to prove sluggish, it is not altogether surprising that wage growth has disappointed given the performance of the fundamentals.
Underneath the Cycle-Low Unemployment Rate
The headline unemployment rates were 4.3 percent (U-3) and 8.4 percent (U-6) in May, once again new cycle lows. Yet, underneath the headline, the labor market continues to face a cross-current of challenges.
First, the labor force participation rate has stabilized in recent months, but is below the rates seen for both men and women over the prior two decades. Second, despite steady improvement, those employed parttime for economic reasons remains higher than has been the case in previous expansions. Finally, the long-term unemployed as a percent of total unemployment remains elevated relative to the prior three expansions. These are structural issues that require focused, targeted microeconomic policies, not more macroeconomic policy actions.

Weak Job Report Will Not Dissuade the Fed from Hiking in June, but 17H2 Hikes Up in the Air
Non-farm payrolls increased by 138k in May, well below the 182k expected by the street. Revisions to the previous two months' of payrolls subtracted 66k positions, with April and March hiring reduced to 174 and 50k, respectively. As a result, the three-month moving average of job growth slowed from 174k to 121k.
Private payrolls rose by 147k, some 28k below consensus expectations. Private-services hiring was once again led by health care & education (+47k), business services (+38k), leisure & hospitality (+31k) and finance (+11k). Goods hiring was meager, with construction (+11k) and mining & logging (+5k) up slightly while manufacturing (-1k) was largely flat. Government hiring (-9k) was weak, as federal level hiring (+8k) was more than offset by sharp cutbacks at the local and state level (-17k).
The unemployment rate ticked down by 0.1 percentage points to 4.3% as 429k Americans left the labor force in the month of May. As a result of the exodus from the workforce, the labor participation rate fell 0.2 percentage points to 62.7% - the lowest level in six months. The shrinkage of the labor force also led to an improvement broader underemployment measures, with the broadest measure (U-6) down 0.2pp to 8.4%.
Average hourly earnings rose by 0.2% during the month, on par with expectations, with the year-over-year wage metric holding steady at 2.5% in May.
Average weekly hours were unchanged at 34.4.
Key Implications
It is hard to find good news in the May report. The headline print disappointed expectations, contrary to the strong ADP print mid-week. Alongside the large downward revisions to prior months', trend payroll growth slowed from 174k prior to the report to just 121k given the new data. Moreover, the diffusion index - which measures the breadth of the gains across industries - pulled back to sharply to 54.8 - the lowest level since November 2016.
The one sliver of positive news was the decline in the jobless rates. The headline (U3) declined to 4.29%, or the lowest level in sixteen years, while the broadest measure (U6) fell to the lowest level since late-2007. Still, most of this is related to the decline in the labor force with participation rates lower in aggregate as well as for the core age group.
To make matters worse the wage print, while decent at 0.2% m/m in May, did not show as much strength as would be suggested by the very low jobless rates. Having said that, this metric should begin to grind higher in the coming months, and should help put some upward pressure on inflation. As such, we still expect the Fed to hike rates by 25 basis points when the FOMC meets the Wednesday after next, but the probability of additional rate hikes later this year is diminishing.
U.S. Trade Deficit Widened in April
The U.S. international trade deficit widened in April by $2.3 billion to $47.6bn from the revised March figure of $45.3bn (previously reported as $43.8 billion). Consensus expectation was for the trade balance to widen a bit less to -$46.1 billion. It should be noted that this release includes annual historical revisions to monthly data from 2014 to March 2017, with minimal effects on historical measures of the trade balance.
Goods exports decreased 0.3% m/m in April, driven lower by consumer goods (-4.3%), and automotive vehicles, parts, and engines (-4.1%). Small increases in industrial supplies and materials (+1.2%) and capital goods (+0.1%) were not sufficient to offset the larger declines in the categories mentioned. In contrast to goods, services exports moved up 0.2% on the month.
Imports rose about 1% m/m in April, driven higher by broad gains in most categories, especially non-food consumer goods (+4%), capital goods (+1.9%), and other merchandise goods (+10.3%). Declines were recorded in imports of industrial supplies and materials (-3.4%) and automotive vehicle and parts (-2.2%).
Adjusting for price changes, merchandise exports declined 0.4% m/m in April, the third consecutive month of decline. Similarly, import volumes rose 1.3% m/m in April, firmer than the unadjusted figure.
Key Implications
After contributing a small positive to first quarter growth, today's release is consistent with the view that net trade will likely be a small drag for second quarter economic activity, and is also not expected to contribute much to 2017 growth.
Although the trade-weighted U.S. dollar has retraced much of its strength and is back at pre-election levels, lagged effects of the past high dollar will continue to exert a drag on foreign demand for U.S. exports for some time yet. Moreover, with signs that earlier strength in foreign demand is beginning to wane, it raises concerns that global demand for U.S. goods and services may slow later on this year, providing further downside risk to U.S. net trade. Add to this elevated policy uncertainty both globally and domestically and the outlook for U.S. exports has more chance of downside than upside surprises going forward.
Export Gains Lead to a Shrinking Canadian Trade Deficit in April
Canada's goods trade balance shrank to a deficit of $370 million in April, from a revised $936 million deficit in March (was: $135 million). The improved balance resulted from exports (+1.8%) outpacing imports (+0.6%). In volume terms, it was an even stronger result, as export volumes rose 1.1%, while imports fell 0.3%, leading to a real trade surplus of $843 million (in 2007 dollars).
Leading exports higher were the motor vehicles and parts (+4.4%), energy products (+2.5%), and forestry/building/packaging products (+4.7%). On the flip side, declines in energy product imports were offset by electronic and electrical equipment (+4.6%), and basic and industrial chemical/plastic/rubber products (+4.9%).
Canadian automotive products go by and large to the United States, and so April's improvement in this category helped drive the Canadian trade surplus with the U.S. to $5.0 billion, the largest surplus since May 2014. Elsewhere, lower shipments of gold contributed to declining non-U.S. exports (-7.8%), with only a modest offset from non-U.S. imports (-0.2%).
Key Implications
Historic revisions may have led to a wider than expected nominal deficit, but today's trade data was encouraging nevertheless. Still healthy U.S. demand for Canadian automotive products helped drive a more than half billion dollar improvement in the trade balance, and a second month of respectable export volume growth was icing on the cake. There was tentative cause for optimism on the import side as well: imports must go somewhere, and decent figures for electronic and electrical equipment, as well as industrial machinery, point to continued business investment in the second quarter.
Indeed, while the healthy gains of the first quarter are not likely to be repeated, solid trade volumes add to the economic momentum going into the second quarter. Preliminary tracking indicates that growth may be as high as 2.5% to 3.0% q/q annualized, which would mark a fourth straight quarter of robust growth.
Of course, trade data is among the most volatile, and two months do not make a trend. As such, we remain of the view despite improving growth prospects, the Bank of Canada will maintain a cautious approach, waiting until April of 2018 to begin a monetary tightening cycle, although the balance of risks are beginning to shift towards an earlier start, rather than a later one.
Gold Jumps to 5-Week Highs on Soft Nonfarm Payrolls
Gold prices have posted strong gains in Friday's North American session, climbing 1 percent. Currently, spot gold is trading at $1274.13 an ounce. On the release front, US employment numbers were a major disappointment. Nonfarm Payrolls plunged to 138 thousand, well off the forecast of 181 thousand. Wage growth softened, as Average Hourly Earnings edged lower to 0.2%, matching the forecast. The unemployment rate continues to fall, and came in at 4.3%, beating the estimate of 4.4%.
US employment numbers often move gold prices, as the health of the labor market is an important gauge of the strength of the US economy. When this data is softer than expected, investors often become jittery and dump dollar-denominated assets in favor of safe-haven assets, such as gold. This was the case on Friday, as an unexpectedly soft Nonfarm Payrolls boosted gold above $1276 earlier on Friday, its highest level since late April. The markets had hoped that a sparkling ADP Nonfarm Payroll report would be repeated, but this was not to be, as Nonfarm Payrolls slid to 138 thousand in May, compared to 253 thousand a month earlier. Wage growth dropped from 0.3% to 0.2%, as wages and inflation remain stubbornly low. Low levels of inflation have become a head-scratcher for Fed policy makers, as inflation remains stubbornly low despite a red-hot labor market. As for additional rate hikes in the second half of 2017, the markets are much more skeptical, as the heady predictions that the Fed could raise rates up to four times this year have faded considerably. Currently, a September rate increase is priced in at just 27 percent. With the next rate decision just less than two weeks away, we could see more volatility from gold, as the metal moves inversely with interest rates. Gold investors and traders will be glued to any comments from Fed policy makers, and any clues from the Fed about its rate plans could trigger swings in gold prices.
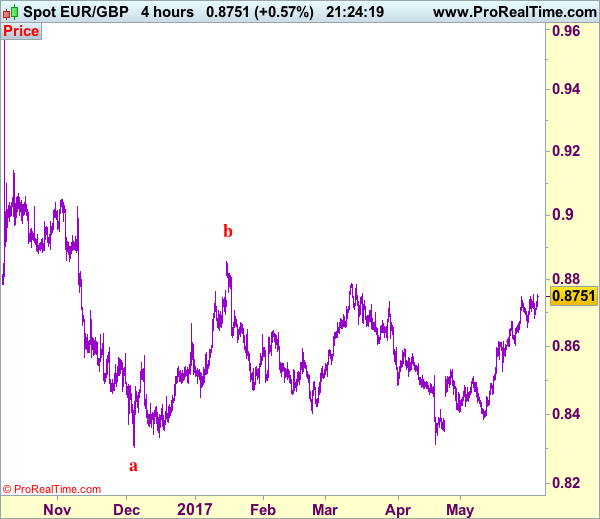
Trade Idea: EUR/GBP – Hold short entered at 0.8735
EUR/GBP - 0.8751
Recent wave: Major double three (A)-(B)-(C)-(X)-(A)-(B)-(C) is unfolding and 2nd (A) has possibly ended at 0.6936.
Trend: Near term up
Original strategy :
Sold at 0.8735, Target: 0.8610, Stop: 0.8775
Position : - Short at 0.8735
Target : - 0.8610
Stop : - 0.8775
New strategy :
Hold short entered at 0.8735, Target: 0.8610, Stop: 0.8775
Position : - Short at 0.8735
Target : - 0.8610
Stop : - 0.8775
Although euro has maintained a firm undertone and marginal gain from here cannot be ruled out, loss of upward momentum should prevent sharp move and may bring retreat later, below 0.8680-85 would suggest top is possibly formed, then test of indicated support at 0.8655 would follow, however, break of latter level is needed to add credence to this view, bring retracement of recent rise to 0.8600-10 later.
In view of this, we are holding on to our short position entered at 0.8735. Above 0.8770 would extend recent rise from 0.8312 low to previous resistance at 0.8788, however, reckon upside would be limited to 0.8800-10 due to weakening of upward momentum.
Our preferred count is that, after forming a major top at 0.9805 (wave V), (A)-(B)-(C) correction is unfolding with (A) leg ended at 0.8400 (A: 0.8637, B: 0.9491 and 5-waver C ended at 0.8400. Wave (B) has ended at 0.9413 and impulsive wave (C) has either ended at 0.8067 or may extend one more fall to 0.8000 before prospect of another rally. Current breach of indicated resistance at 0.9043 confirms our view that the (C) leg has ended and bring stronger rebound towards 0.9150/54, then towards 0.9240/50.
Trade Idea: USD/CAD – Sell at 1.3560
USD/CAD - 1.3506
Recent wave: Only wave v of c has ended at 0.9407 and wave C of major A-B-C correction is underway for headway to 1.4700
Trend: Near term up
Original strategy :
Sell at 1.3550, Target: 1.3350, Stop: 1.3610
Position: -
Target: -
Stop: -
New strategy :
Sell at 1.3560, Target: 1.3360, Stop: 1.3620
Position: -
Target: -
Stop:-
As long as minor support at 1.3472 holds, near term upside risk remains for the rebound from 1.3387 (last week’s low) to bring retracement of recent decline, however, reckon upside would be limited to 1.3550-60 and bring retreat later, below said support would suggest top is possibly formed, bring fall to 1.3436, break there would signal the rebound from 1.3387 has ended, bring retest of this level first. A drop below this support at 1.3387 would extend the fall from 1.3794 top for further weakness to 1.3350, then towards 1.3300 but loss of near term downward momentum should prevent sharp fall below 1.3250-60.
In view of this, would be prudent to sell on further recovery as 1.3550-60 should limit upside, bring another decline. Above 1.3571-79 (previous support and 50% Fibonacci retracement of 1.3770-1.3387) would defer and suggest a temporary low is formed instead, risk a stronger rebound to 1.3600 but still reckon resistance at 1.3670 would remain intact.
To recap, wave B from 1.3066 is unfolding as an a-b-c and is sub-divided as a: 1.2192, b: 1.2716 and wave c is a 5-waver with i: 1.1983, ii: 1.2506, extended wave iii with minor iii at 1.0206, wave iv ended at 1.0781 and wave v as well as wave iii has ended at 0.9931, hence the subsequent choppy trading is the wave iv which is unfolding as (a)-(b)-(c) with (a) leg of iv ended at 1.0854, followed by (b) leg at 1.0108 and (c) leg as well as the wave iv ended at 1.0674. The wave v is sub-divided by minor wave (i): 0.9980, (ii): 1.0374, (iii): 0.9446, (iv): 0.9913 and (v) as well as v has possibly ended at 0.9407, therefore, consolidation with upside bias is seen for major correction, indicated target at 1.3700 and 1.4000 had been met and further gain to 1.4700 would be seen later.
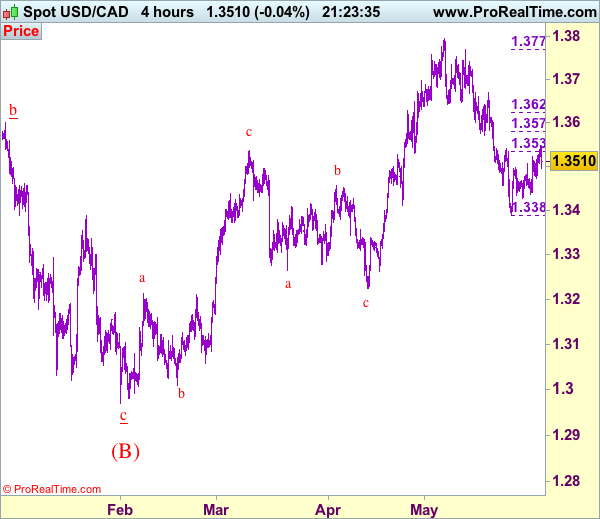
USD/CAD Bulls Test 20-day SMA Resistance
USD/CAD has plunged 2.5% from May 5th to 24th caused by rising oil prices.
The trend has turned to an upswing since May 24th, seeing a 0.8% rebound, helped by a slump in oil prices after the recent OPEC meeting.
On the 4-hourly chart USD/CAD has turned bullish, trading above the downside uptrend line support.
This morning USD/CAD hit a 2-week high of 1.3546.
Currently, on the daily chart, the price is approaching the long-term major resistance zone between
1.3550 - 1.3600, where also the 20-day SMA is situated (1.3560).
The bulls still have momentum, however, be aware that the selling pressure is heavy at this zone.
The resistance level is at 1.3550 followed by 1.3600.
The support line is at 1.3500 followed by 1.3470.
The crucial US labour market data for May will be released today, June 2nd at 13:30 BST. It includes non-farm payrolls, unemployment rate and average hourly earnings.
Please note that the release of US labour market data will likely cause volatility for USD/CAD and other USD crosses.
Be aware that, based on prior experience after the release of the data, market trends sometimes reverse within 1-2 hours after the initial move.