Sample Category Title
GOLD – Retains Its Upside Pressure
GOLD - The commodity continues to hold on to its upside pressure short term leaving risk higher in the new week. On the downside, support comes in at the 1,270.00 level where a break will turn attention to the 1,260.00 level. Further down, a cut through here will open the door for a move lower towards the 1,250.00 level. Below here if seen could trigger further downside pressure targeting the 1,240.00 level. Conversely, resistance resides at the 1,290.00 level where a break will aim at the 1,300.00 level. A turn above there will expose the 1,310.00 level. Further out, resistance stands at the 1,320.00 level. All in all, GOLD looks to strengthen further in the new week.
EUR/USD Weekly Outlook
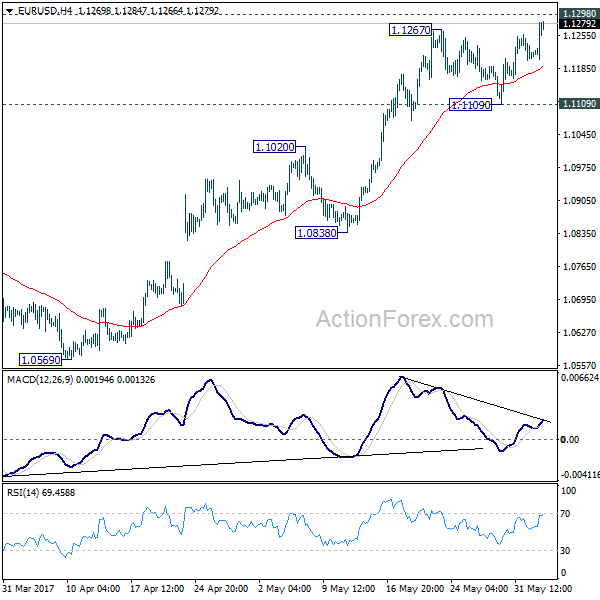
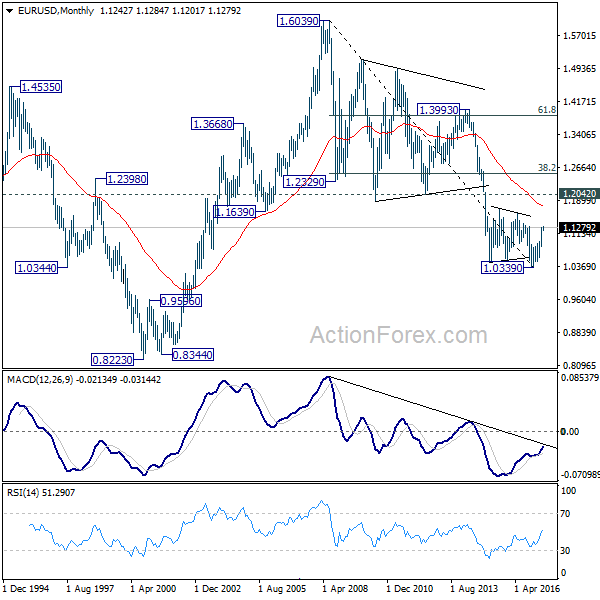
EUR/USD's rally resumed after some consolidation later week. Initial bias stays on the upside this week with focus on 1.1298 key resistance. Decisive break there will carry larger bullish implication. In such case, further rise should be seen to 1.1615 resistance next. On the downside, break of 1.1109 support will indicate short term topping and rejection from 1.1298. In such case, intraday bias will be turned to the downside for 1.0838 support.
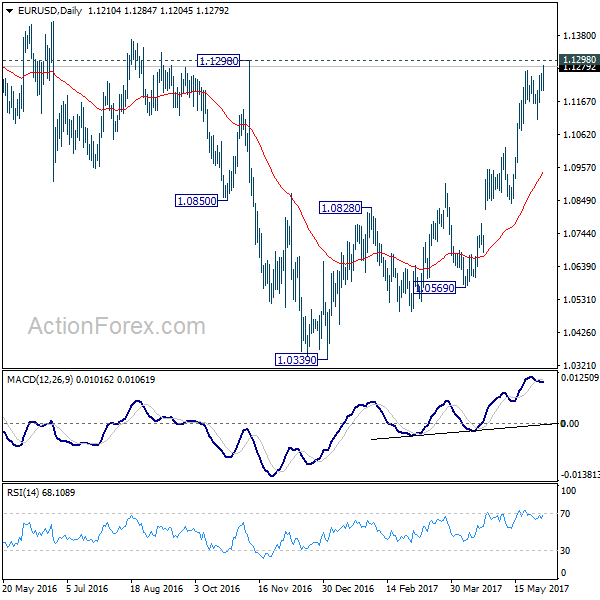
In the bigger picture, the case for medium term reversal continues to build up with EUR/USD staying far above 55 week EMA (now at 1.0912). Also, bullish convergence condition is seen in weekly MACD. Focus will now be on 1.1298 key resistance. Rejection from there will maintain medium term bearishness and would extend the whole down trend from 1.6039 (2008 high). However, firm break of 1.1298 will indicate reversal. In such case, further rally would be seen back to 1.2042 support turned resistance next.
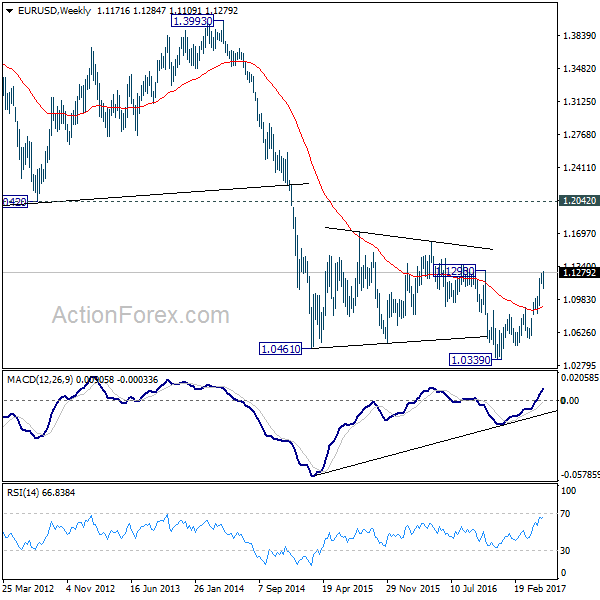
In the long term picture, the case for completion of down trend from 1.6039 (2008 high), and long term bottoming at 1.0339, is starting to build up. Decisive break of 1.1298 will bring rise back to 1.2042 as first resistance. And in that case, we should at least see rally back to 38.2% retracement of 1.6039 to 1.0339 at 1.2516.
USD/JPY Weekly Outlook
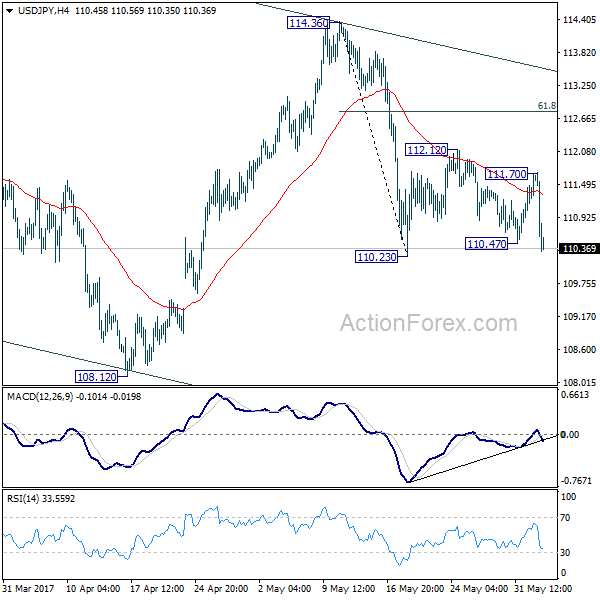
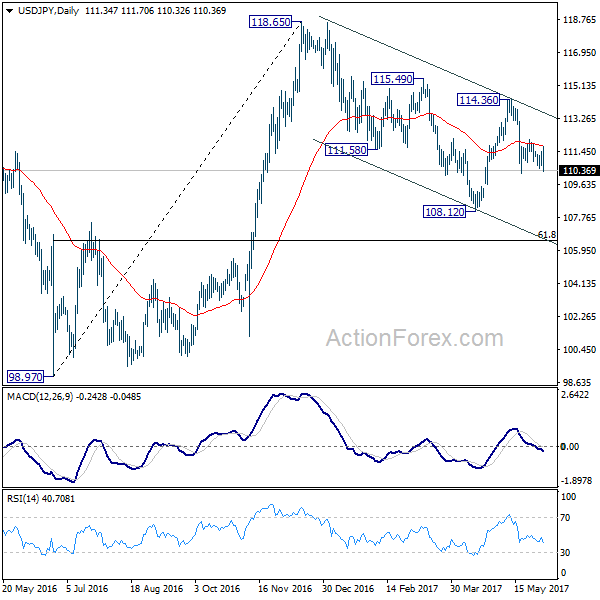
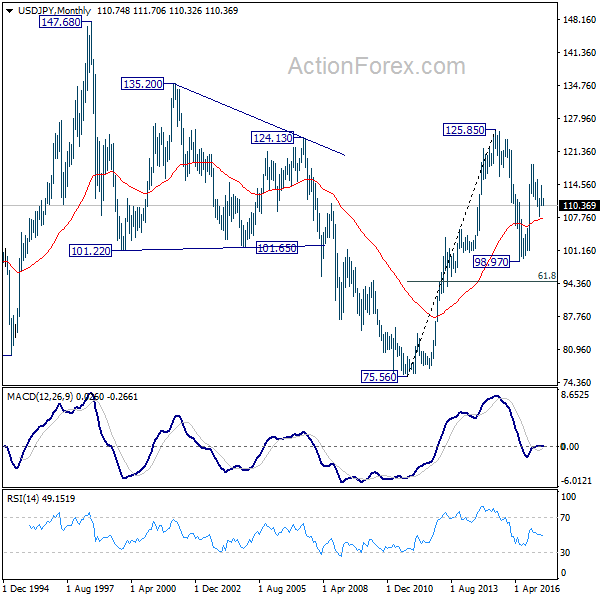
USD/JPY recovered ahead of 110.23 last week as consolidation from there extended. But it was rejected by 55 day EMA and dropped sharply to close at 110.36. Initial bias is cautiously on the downside this week. Break of 110.23 will resume the fall from 114.36. In such case, intraday bias will be turned back to the downside for 108.12 and below. Whole decline from 118.65 is seen as a correction and is still in progress. We'll look for bottoming signal at 61.8% retracement of 98.97 to 118.65 at 106.48 as the correction extends. Meanwhile, above 111.70 will turn intraday bias back to the upside. But we'd expect strong resistance from 61.8% retracement of 114.36 to 110.23 at 112.78 to limit upside and bring fall resumption.
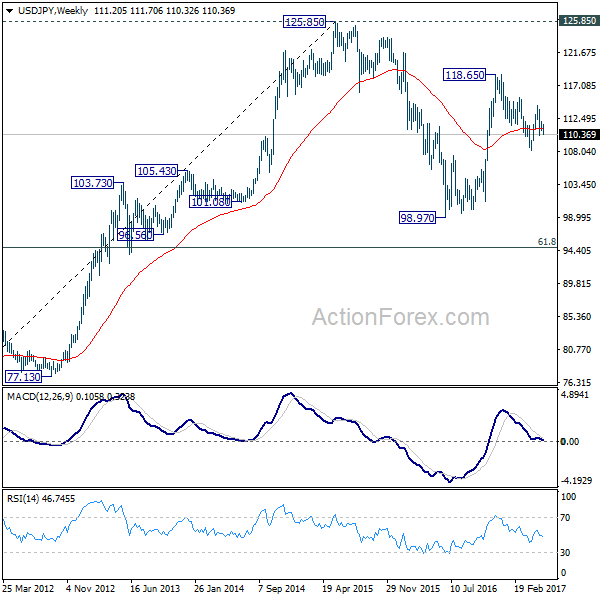
In the bigger picture, price actions from 125.85 high are seen as a corrective pattern. It's uncertain whether it's completed yet. But in case of another fall, downside should be contained by 61.8% retracement of 75.56 to 125.85 at 94.77 to bring rebound. Overall, rise from 75.56 is still expected to resume later after the correction from 125.85 completes.
In the long term picture, the rise from 75.56 long term bottom to 125.85 medium term top is viewed as an impulsive move. Price actions from 125.85 are seen as a corrective move which could still extend. But, up trend from 75.56 is expected to resume at a later stage for above 135.20/147.68 resistance zone.
GBP/USD Weekly Outlook
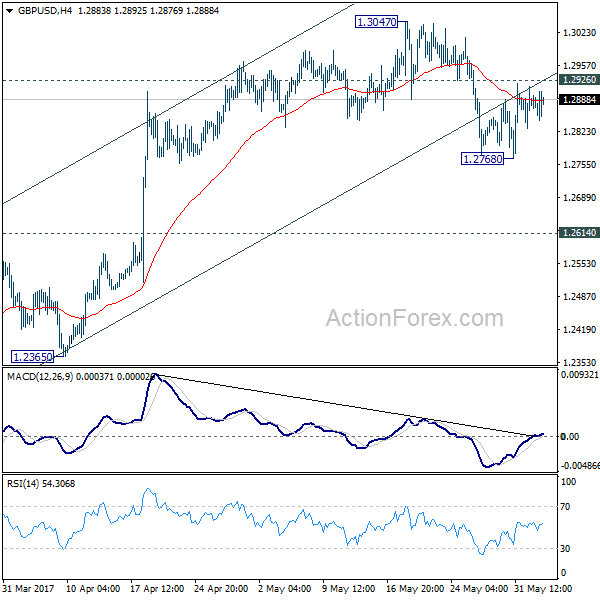
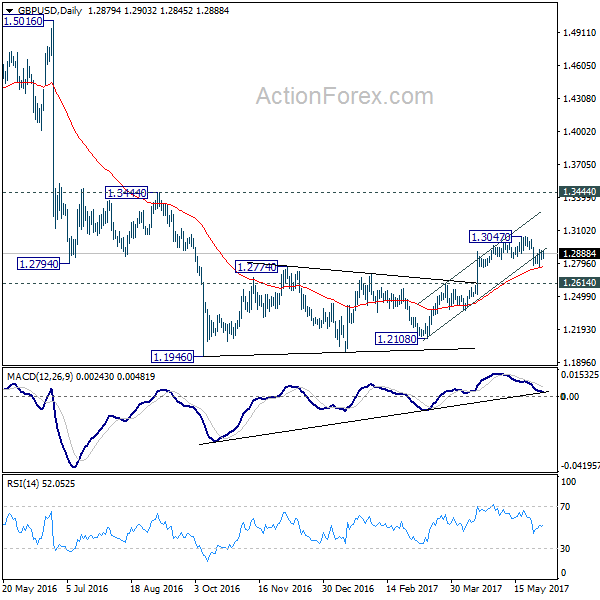
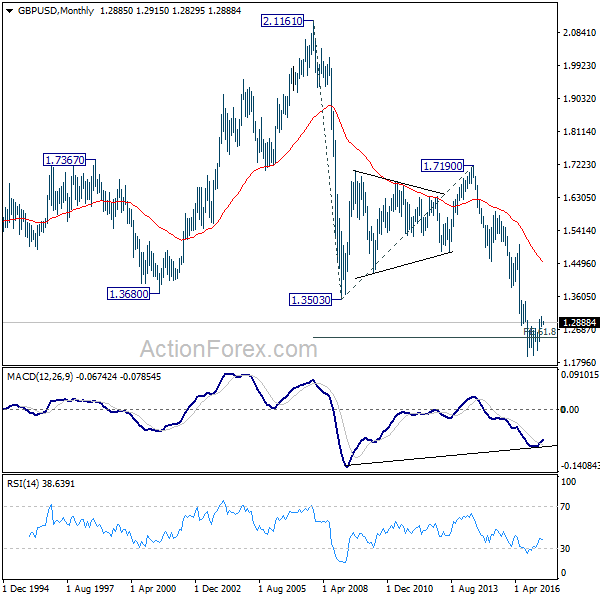
GBP/USD recovered after dipping to 1.2768 and turned into consolidation. With 1.2926 minor resistance intact, near term outlook stays cautiously bearish. Initial bias is neutral this week first. Below 1.2768 will turn bias to the downside for 1.2614 resistance turned support first. Break there should also indicate completion of whole consolidation pattern from 1.1946 and target a retest on this low. However, break of 1.2926 will turn focus back to 1.3047 instead.
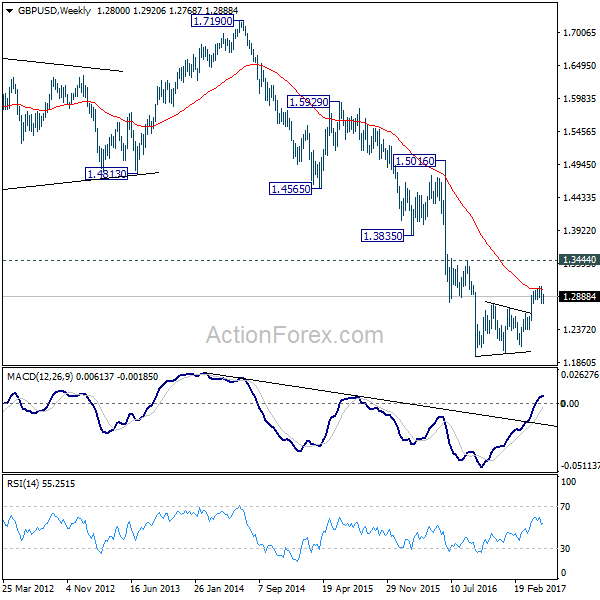
In the bigger picture, fall from 1.7190 is seen as part of the down trend from 2.1161. The rejection from 55 week EMA is maintaining bearishness in the pair. Also, at this point, as long as 1.3444 resistance holds, fall from 1.7190 is still expected to continue. Break of above mentioned 1.2614 support will affirm this bearish case.
In the longer term picture, no change in the view that down trend from 2.1161 is still in progress. On resumption, such decline would extend deeper to 100% projection of 2.1161 to 1.3503 from 1.7190 at 0.9532.
USD/CHF Weekly Outlook
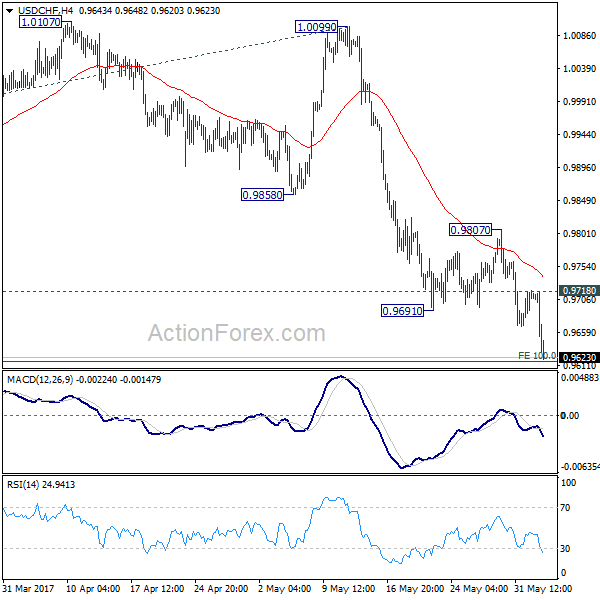
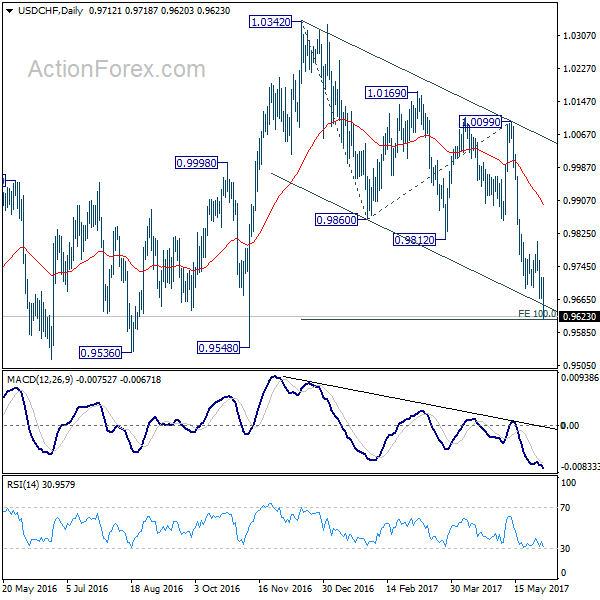
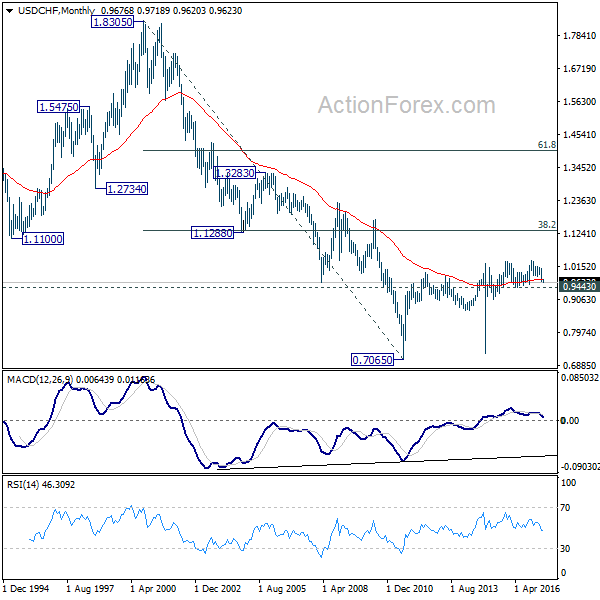
USD/CHF's fall accelerated to as low as 0.9620 last week, just inch above 100% projection of 1.0342 to 0.9860 from 1.0099 at 0.9617. Initial bias stays on the downside this week and deeper decline could be seen. But we'd start to look for bottoming signal again as it approaches 0.9443 key support level. On the upside, above 0.9718 minor resistance will turn intraday bias neutral first.
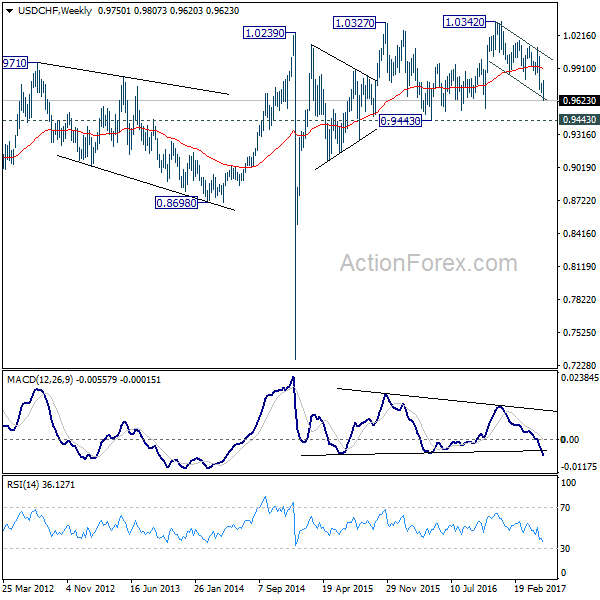
In the bigger picture, USD/CHF is still bounded in medium term range of 0.9443/1.0342 for the moment. Consolidative trading would likely continue and medium term outlook remains neutral. Break of 1.0342 key resistance is needed to confirm underlying bullish momentum in the pair. Meanwhile, downside attempts should be contained by 0.9443 key support level. However, sustained break of 0.9443 will carry larger bearish implication and target 0.9 handle.
AUD/USD Weekly Outlook
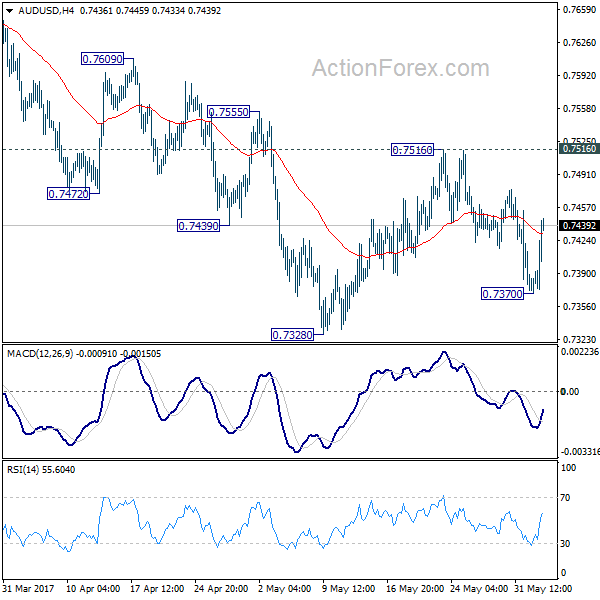
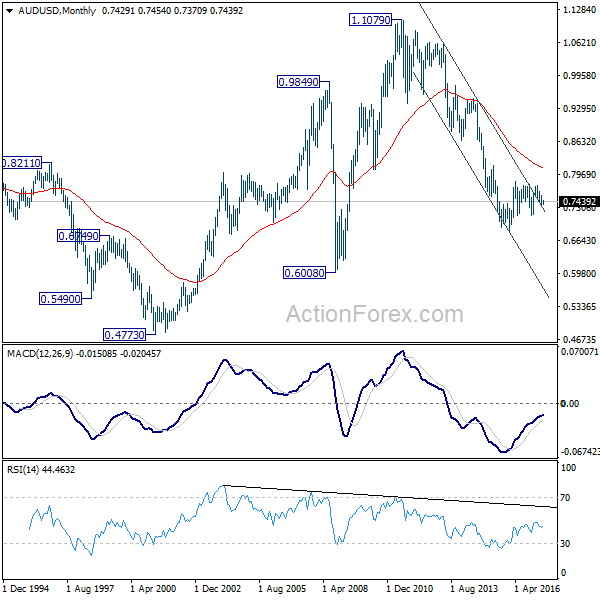
AUD/USD dipped to 0.7370 last week but quickly recovered. Initial bias is neutral this week first. As long as 0.7516 resistance holds, deeper fall is expected. Below 0.7328 will resume the decline from 0.7748 to 0.7144/7158 support zone. On the upside, break of 0.7516 resistance will indicate near term reversal and turn bias back to the upside.
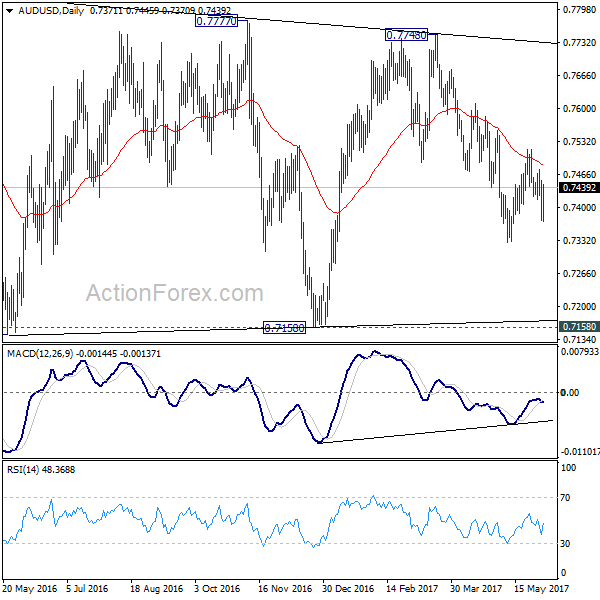
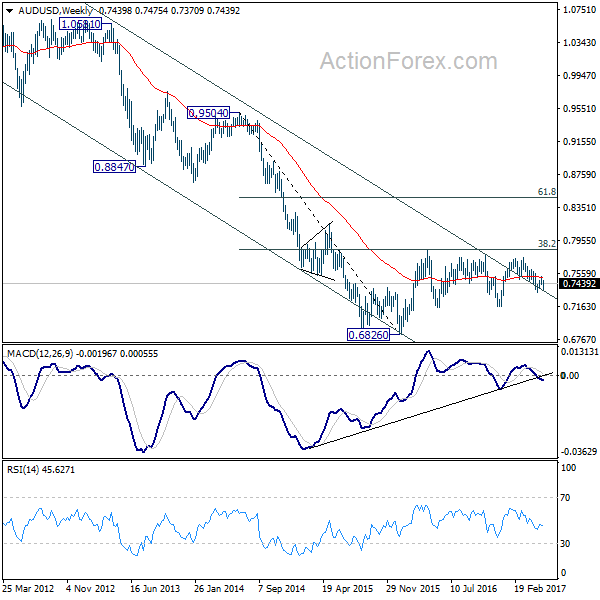
In the bigger picture, we're still treating price actions from 0.6826 low as a corrective pattern. And, as long as 38.2% retracement of 0.9504 to 0.6826 at 0.7849 holds, long term down trend from 1.1079 is expected to resume sooner or later. Break of 0.6826 low will target 0.6008 key support level. However, firm break of 0.7849 will indicate that rise from 0.6826 is developing into a medium term rebound, rather than a sideway pattern. In such case, stronger rise should be seen to 55 month EMA (now at 0.8091) and above.
In the longer term picture, while the down trend from 1.1079 might extend lower, we're not anticipating a break of 0.6008 (2008 low) yet. We'll look for bottoming above there to reverse the medium term trend.
USD/CAD Weekly Outlook
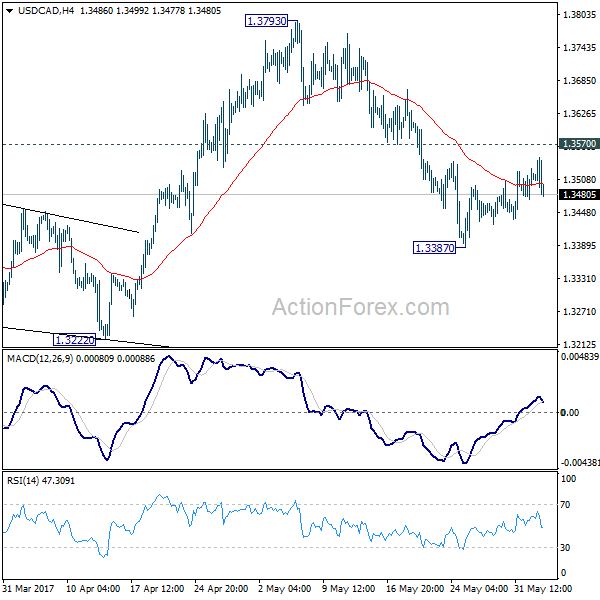
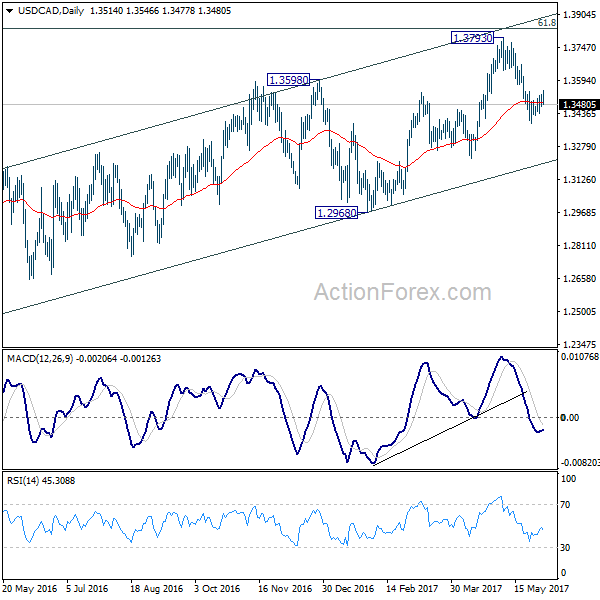
USD/CAD's consolidation pattern from 1.3387 extended last week and outlook is unchanged. Initial bias stays neutral this week first. In case of another recovery, upside should be limited by 1.3570 resistance and bring fall resumption. We're holding on to the view that rise from 1.2968 has completed. And the larger rise from 1.2460 could have finished too. Below 1.3387 will target 1.3222 support first. Break of 1.3222 will affirm our bearish view and target 1.2968 key support level for confirmation. However, break of 1.3570 will turn focus back to 1.3793 high instead.
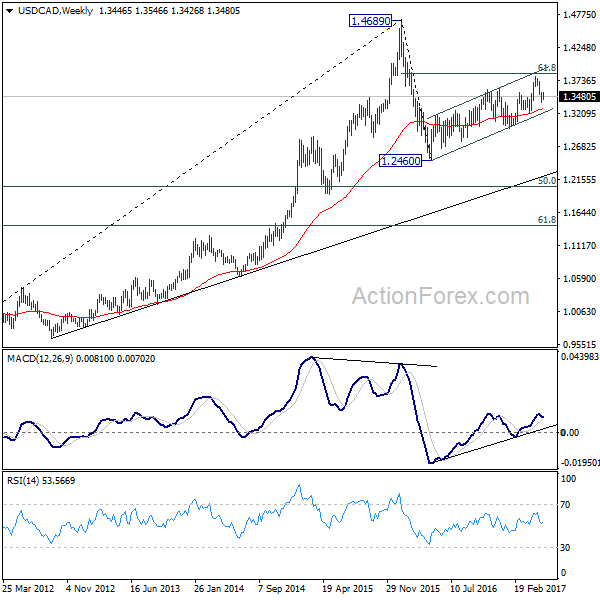
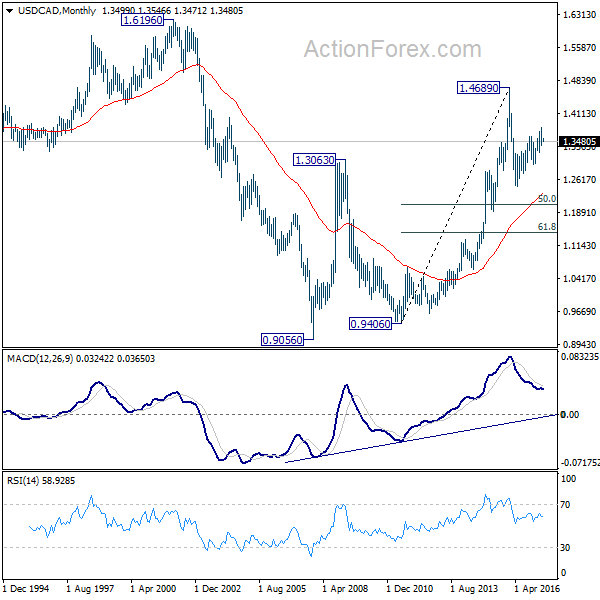
In the bigger picture, price actions from 1.4689 medium term top are seen as a correction pattern. The first leg has completed at 1.2460. Rise from 1.2460 is seen as the second leg and could have completed at 1.3793, ahead of 61.8% retracement of 1.4689 to 1.2460 at 1.3838. Break of 1.3222 should indicate the start of the third leg while further break of 1.2968 should confirm. Nonetheless, sustained trading above 1.3838 would pave the way to retest 1.4689 high.
In the longer term picture, rise from 0.9056 (2007 low) is viewed as a long term up trend. It's taking a breath after hitting 1.4689. But such rise expected to resume later to test 1.6196 down the road.
GBP/JPY Weekly Outlook
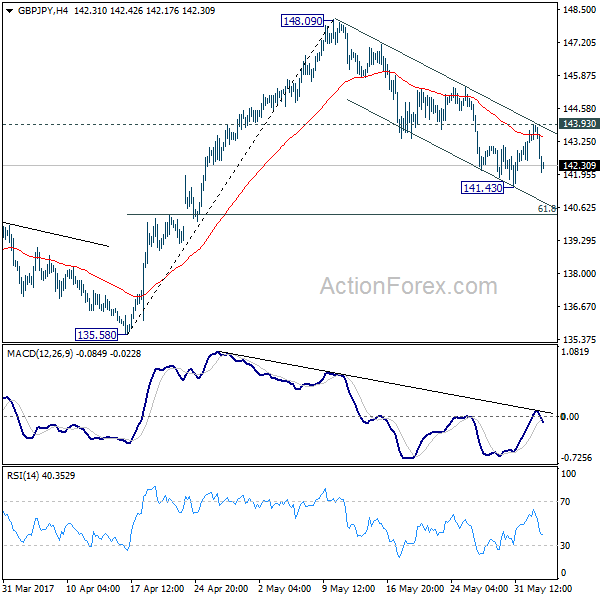
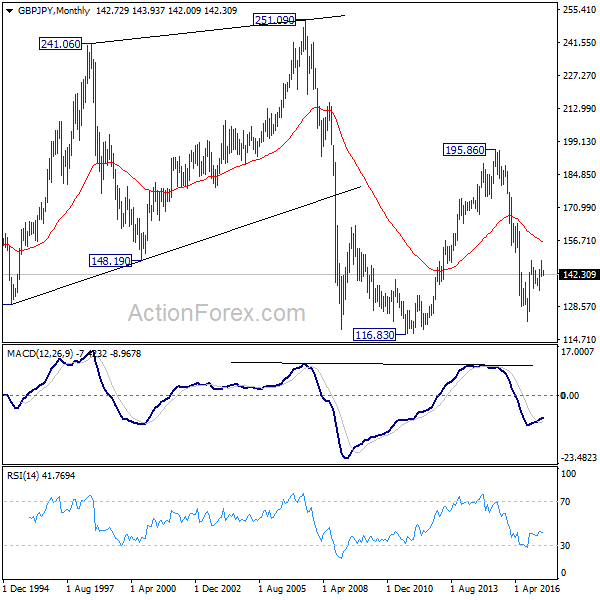
GBP/JPY recovered last week but failed to sustain 4 hour 55 EMA and weakened again. Initial bias is neutral this week first. Break of 141.43 will extend the decline from 148.09. In such case, intraday bias is turned to the downside for 61.8% retracement of 135.58 to 148.09 at 140.35. At this point, we'd still expect rebound from 122.36 to resume later. Hence, we'd look for strong support below 140.35 to contain downside and bring rebound. On the upside, break of 143.93 will turn bias back to the upside for 148.09 resistance.
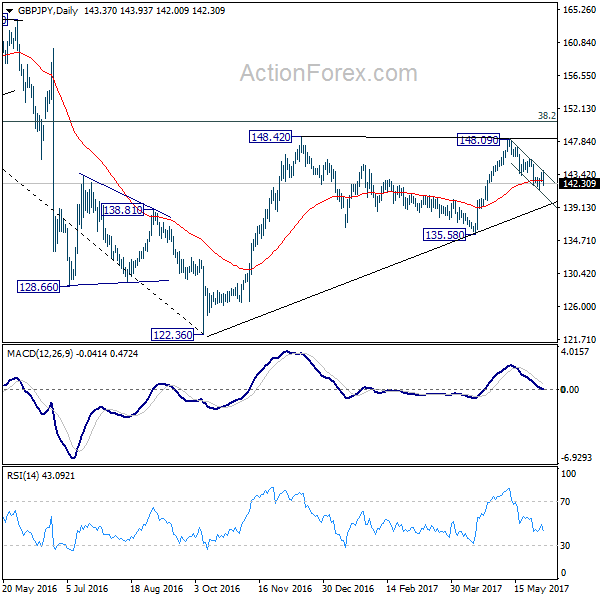
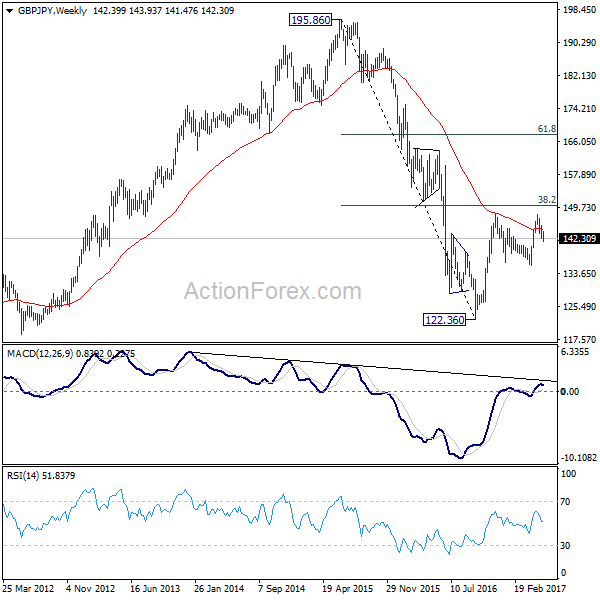
In the bigger picture, rise from 122.36 medium term bottom is still expected to extend to of 195.86 to 122.36 at 150.42. And decisive break there could pave the way to 61.8% retracement at 167.78. However, as the cross is starting to lose upside momentum, rejection below 150.42 and break of 135.58 support will indicate reversal and bring deeper fall back to retest 122.36 instead.
In the longer term picture, based on the impulsive structure of the decline from 195.86 to 122.36, such fall should not be completed yet. But we will now pay close attention to the structure of the rise from 122.36 to determine whether it's a corrective move, or an impulsive move. That would decide whether a break of 116.83 low would be seen.
EUR/JPY Weekly Outlook
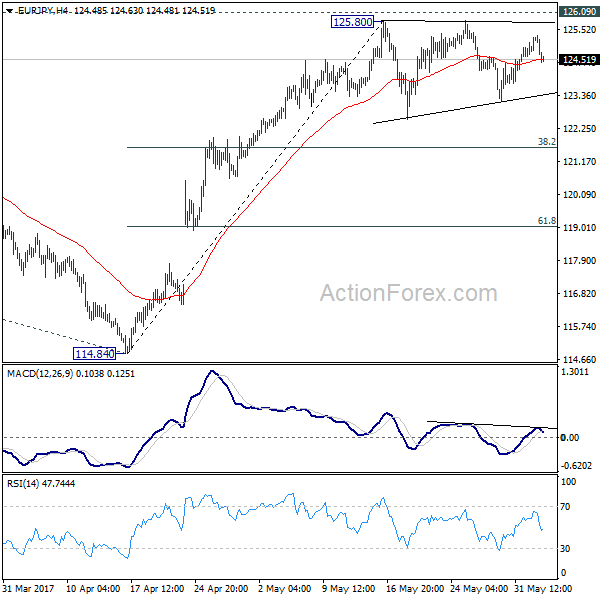
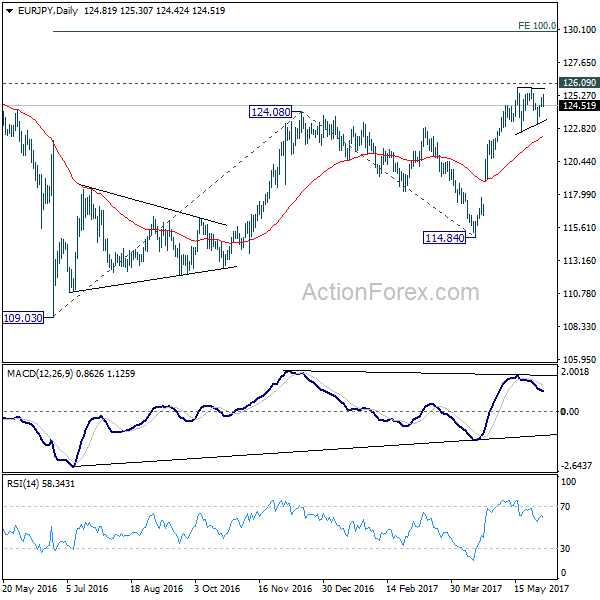
EUR/JPY's consolidation pattern from 125.80 extended last week and outlook is unchanged. Initial bias stays neutral this week first. In case of another fall, downside should be contained by 38.2% retracement of 114.84 to 125.80 at 121.61 to bring rise resumption. We're staying mildly bullish in the cross. And, break of 126.09 key resistance will extend the whole rebound from 109.03 to 100% projection of 109.03 to 124.08 from 114.84 at 129.89. Nonetheless, firm break of 121.61 will dampen our bullish view and bring deeper fall to 61.8% retracement at 119.02.
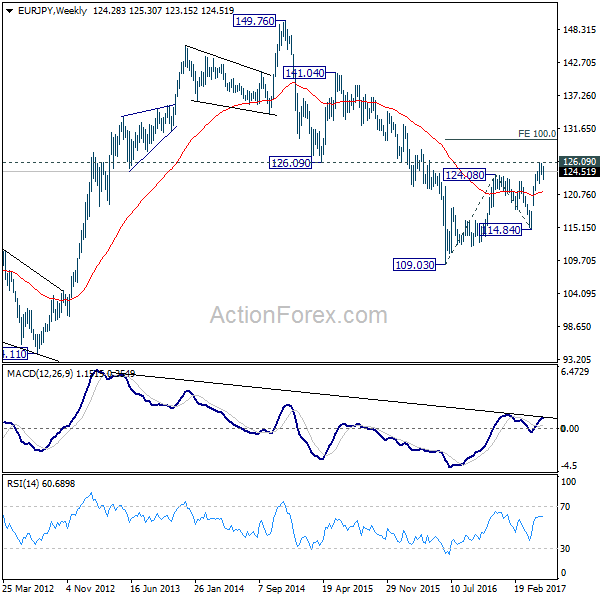
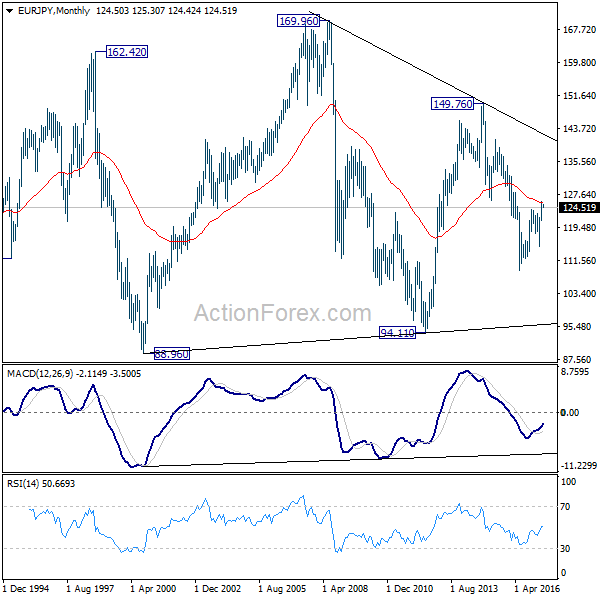
In the bigger picture, focus is staying on 126.09 support turned resistance. Decisive break there will confirm completion of the down trend from 149.76. And in such case, rise from 109.20 is at the same degree and should target 141.04 resistance and above. Meanwhile, rejection from 126.09 and break of 114.84 will extend the fall from 149.76 through 109.20 low.
In the long term picture, medium term decline from 149.76 is seen as part of a long term sideway pattern from 88.96. We're not seeing any sign of an established long term trend yet. Hence, we'll be cautious on strong support at 94.11 in case of another fall. Also, there could be strong resistance at 149.76 in case of a medium term rise.
EUR/GBP Weekly Outlook
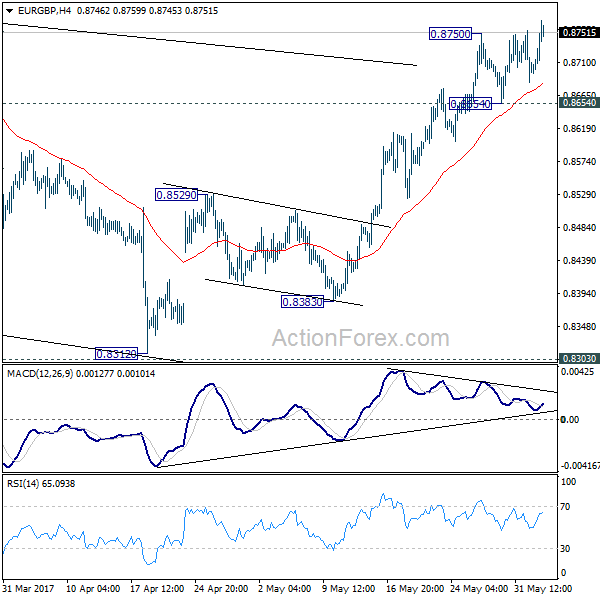
EUR/GBP's rally resumed last week with weak momentum. Initial bias is mildly on the upside this week first. Current rise would target 0.8786 resistance and then 0.8851. Decisive break of 0.8851 will pave the way to retest 0.9304 high. On the downside, break of 0.8654 support is needed to indicate short term topping. Otherwise, outlook will say mildly bullish in case of retreat.
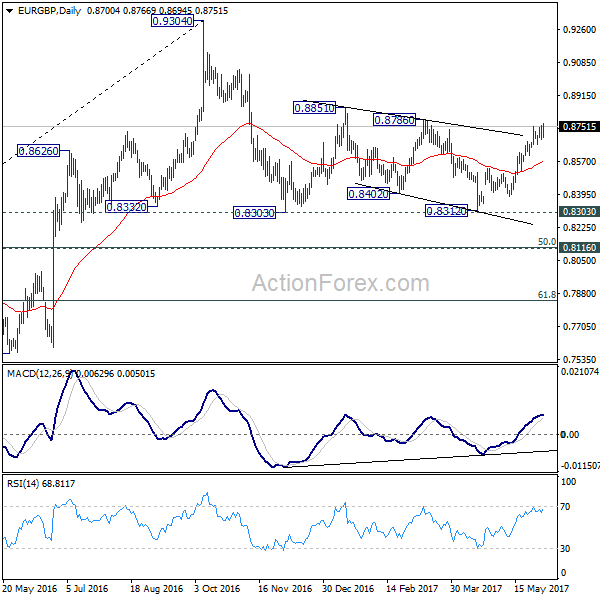
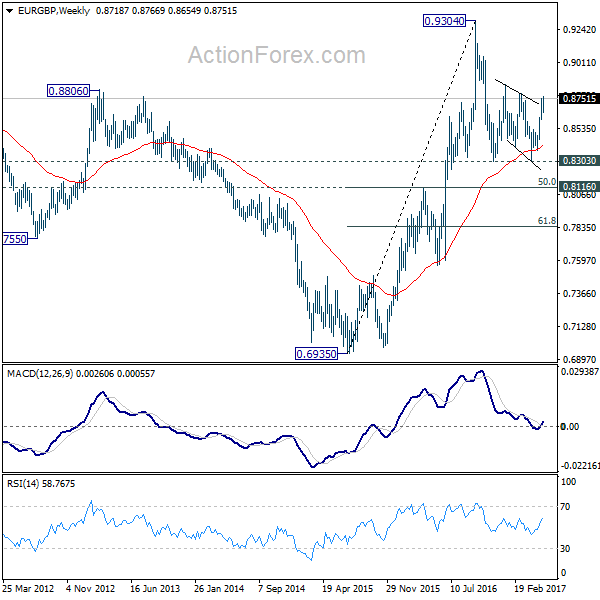
In the bigger picture, price actions from 0.9304 are viewed as a medium term corrective pattern. The leg from 0.9304 should have completed after testing 0.8332 structural support. But it's too early to say that larger rise from 0.6935 is resuming. Rejection from 0.9304 will extend the consolidation with another falling leg. Meanwhile, firm break of 0.9304 will target 0.9799 (2008 high). In case of another decline, we'd expect strong support from 0.8116 cluster support (50% retracement of 0.6935 to 0.9304 at 0.8120) to contain downside and bring rebound.
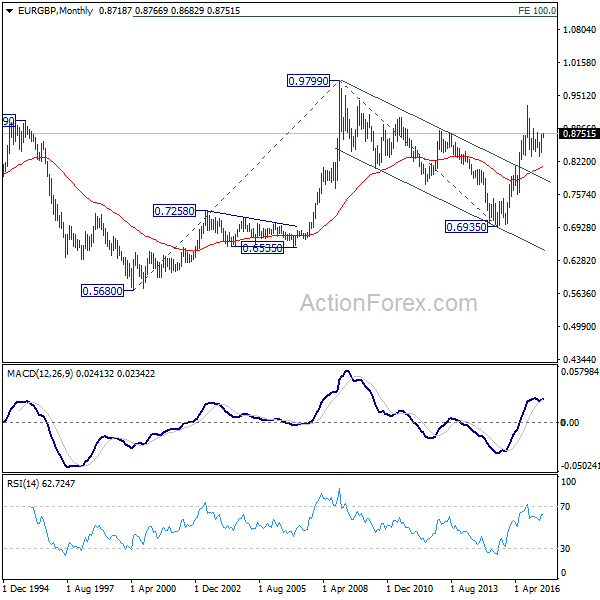
In the long term picture, firstly, price action from 0.9799 (2008 high) is seen as a long term corrective pattern and should have completed at 0.6935 (2015 low). Secondly, rise from 0.6935 is likely resuming up trend from 0.5680 (2000 low). Thirdly, this is supported by the impulsive structure of the rise from 0.6935 to 0.9304. Hence, after the correction from 0.9304 completes, we'd expect another medium term up trend to target 0.9799 high and above.