
Sample Category Title
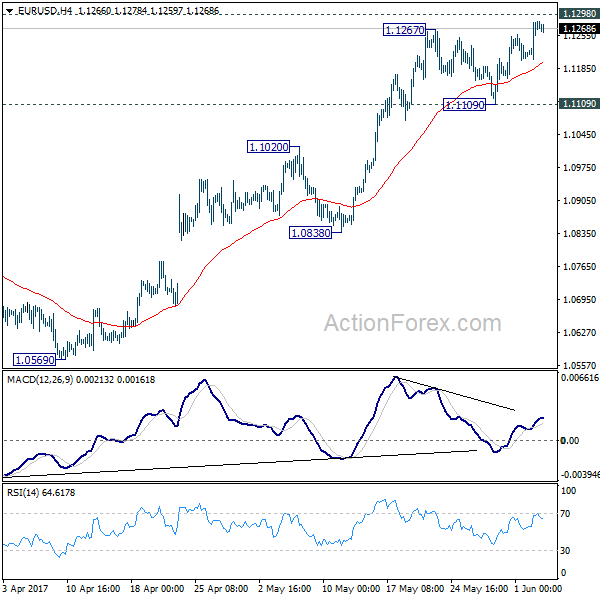
EUR/USD Daily Outlook
Daily Pivots: (S1) 1.1229; (P) 1.1256 (R1) 1.1308; More....
Intraday bias in EUR/USD remains on the upside for 1.1298 resistance. Decisive break there will carry larger bullish implication and target 1.1615 resistance next. Near term outlook will now remain bullish as long as 1.1109 support holds. Nonetheless, we'd stay cautious on rejection from 1.1245/98 (138.2% projection of 1.0339 to 1.0828 from 1.0569 at 1.1245) resistance zone. Break of 1.1109 will indicate short term topping and turn bias back to the downside.
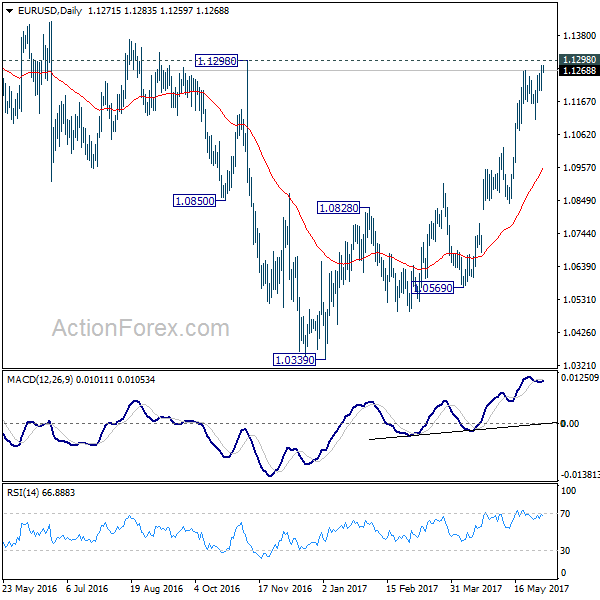
In the bigger picture, the case for medium term reversal continues to build up with EUR/USD staying far above 55 week EMA (now at 1.0888). Also, bullish convergence condition is seen in weekly MACD. Focus will now be on 1.1298 key resistance. Rejection from there will maintain medium term bearishness and would extend the whole down trend from 1.6039 (2008 high). However, firm break of 1.1298 will indicate reversal. In such case, further rally would be seen back to 1.2042 support turned resistance next.
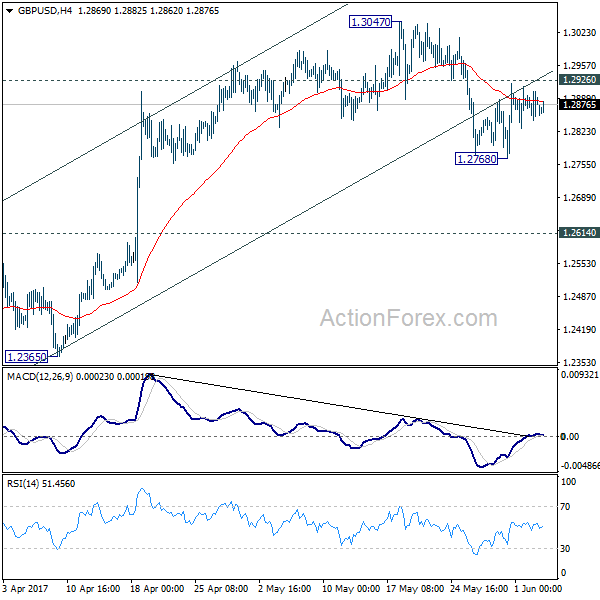
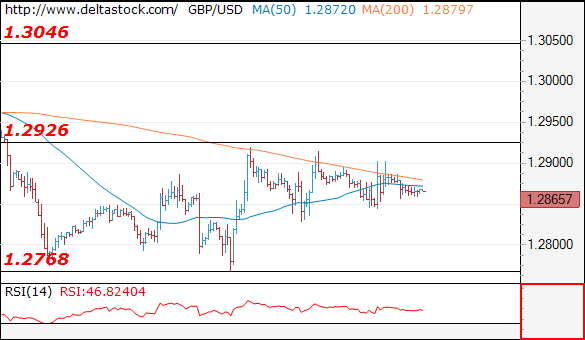
GBP/USD Daily Outlook
Daily Pivots: (S1) 1.2854; (P) 1.2879; (R1) 1.2913; More...
Intraday bias in GBP/USD remains neutral for the moment. With 1.2926 minor resistance intact, near term outlook stays cautiously bearish. below 1.2768 will turn bias to the downside for 1.2614 resistance turned support first. Break there should also indicate completion of whole consolidation pattern from 1.1946 and target a retest on this low. However, break of 1.2926 will turn focus back to 1.3047 instead.
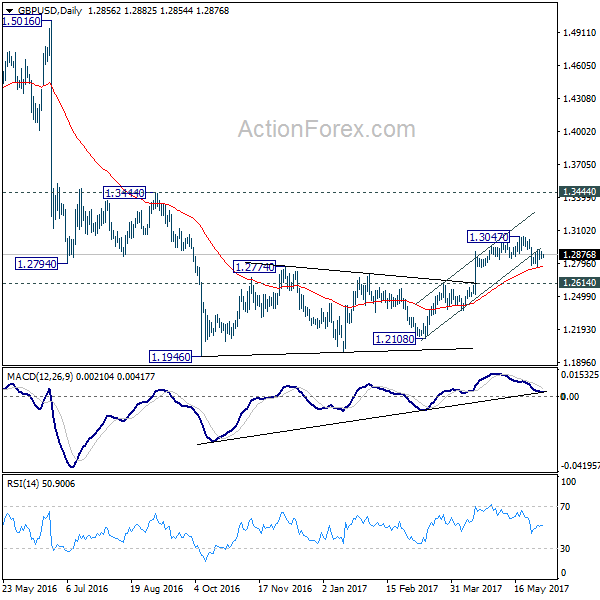
In the bigger picture, fall from 1.7190 is seen as part of the down trend from 2.1161. The rejection from 55 week EMA is maintaining bearishness in the pair. Also, at this point, as long as 1.3444 resistance holds, fall from 1.7190 is still expected to continue. Break of above mentioned 1.2614 support will affirm this bearish case.
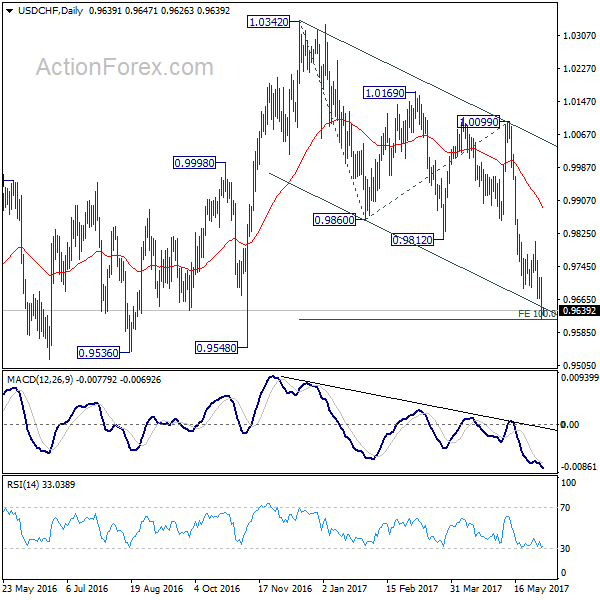
USD/CHF Daily Outlook
Daily Pivots: (S1) 0.9587; (P) 0.9652; (R1) 0.9686; More.....
Intraday bias in USD/CHF remains on the downside for the moment. Deeper decline could be seen through 100% projection of 1.0342 to 0.9860 from 1.0099 at 0.9617. But we'd start to look for bottoming signal again as it approaches 0.9443 key support level. On the upside, above 0.9718 minor resistance will turn intraday bias neutral first.
In the bigger picture, USD/CHF is still bounded in medium term range of 0.9443/1.0342 for the moment. Consolidative trading would likely continue and medium term outlook remains neutral. Break of 1.0342 key resistance is needed to confirm underlying bullish momentum in the pair. Meanwhile, downside attempts should be contained by 0.9443 key support level. However, sustained break of 0.9443 will carry larger bearish implication and target 0.9 handle.

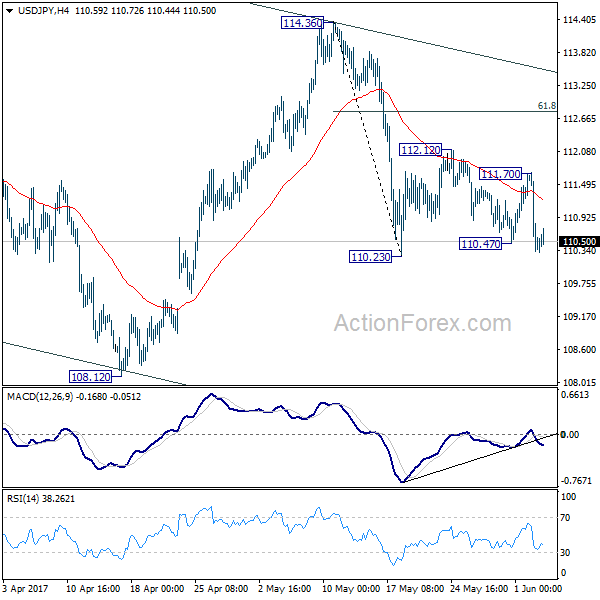
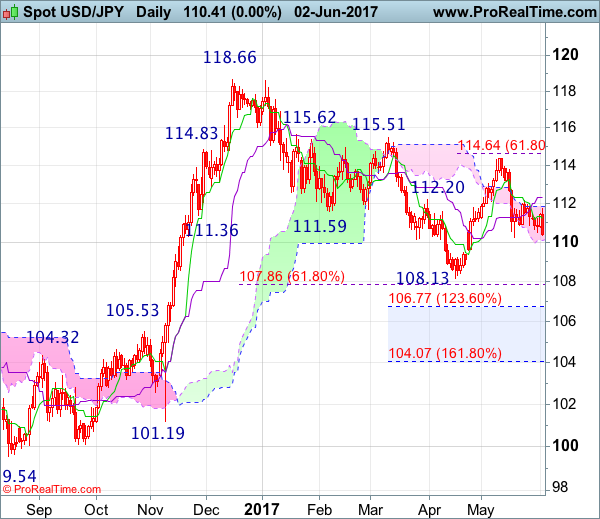
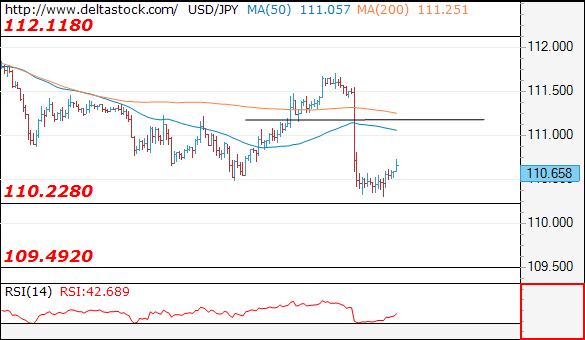
USD/JPY Daily Outlook
Daily Pivots: (S1) 109.93; (P) 110.81; (R1) 111.31; More...
Intraday bias in USD/JPY remains neutral cautiously on the downside with focus on 110.23. Break there will resume the fall from 114.36. In such case, deeper fall should be seen to 108.12 and below. Whole decline from 118.65 is seen as a correction and is still in progress. We'll look for bottoming signal at 61.8% retracement of 98.97 to 118.65 at 106.48 as the correction extends. Meanwhile, above 111.70 will turn intraday bias back to the upside. But we'd expect strong resistance from 61.8% retracement of 114.36 to 110.23 at 112.78 to limit upside and bring fall resumption.
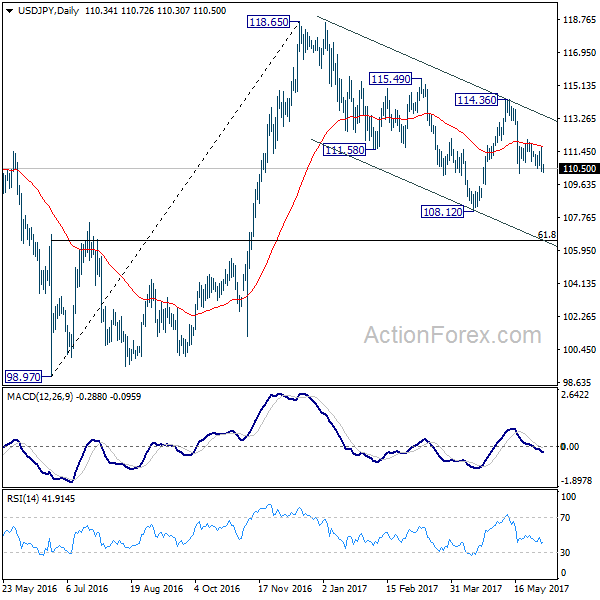
In the bigger picture, price actions from 125.85 high are seen as a corrective pattern. It's uncertain whether it's completed yet. But in case of another fall, downside should be contained by 61.8% retracement of 75.56 to 125.85 at 94.77 to bring rebound. Overall, rise from 75.56 is still expected to resume later after the correction from 125.85 completes.
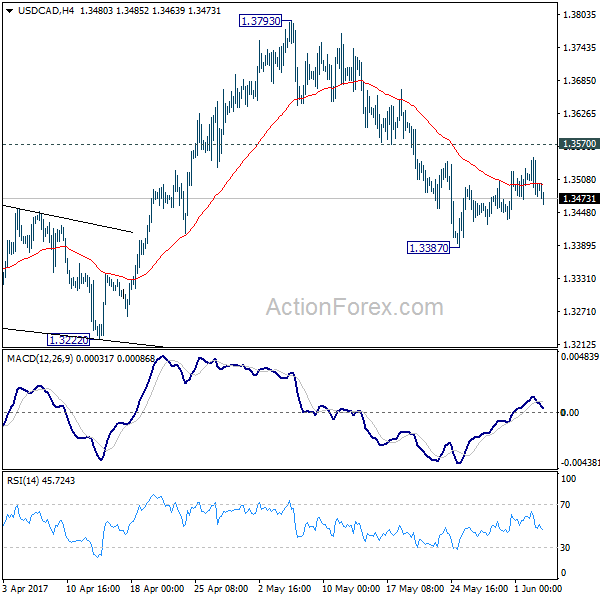
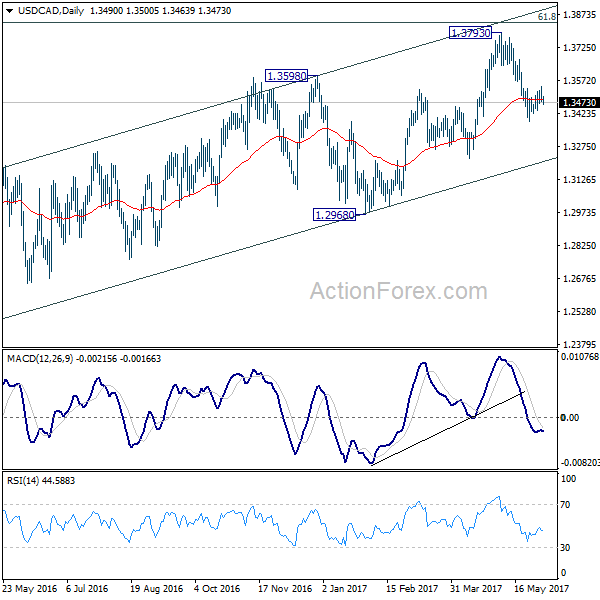
USD/CAD Daily Outlook
Daily Pivots: (S1) 1.3457; (P) 1.3501; (R1) 1.3524; More....
Intraday bias in USD/CAD remains neutral for the moment as consolidation from 1.3387 continues. In case of another recovery, upside should be limited by 1.3570 resistance and bring fall resumption. We're holding on to the view that rise from 1.2968 has completed. And the larger rise from 1.2460 could have finished too. Below 1.3387 will target 1.3222 support first. Break of 1.3222 will affirm our bearish view and target 1.2968 key support level for confirmation. However, break of 1.3570 will turn focus back to 1.3793 high instead.
In the bigger picture, price actions from 1.4689 medium term top are seen as a correction pattern. The first leg has completed at 1.2460. Rise from 1.2460 is seen as the second leg and could have completed at 1.3793, ahead of 61.8% retracement of 1.4689 to 1.2460 at 1.3838. Break of 1.3222 should indicate the start of the third leg while further break of 1.2968 should confirm. Nonetheless, sustained trading above 1.3838 would pave the way to retest 1.4689 high.
USD/JPY Candlesticks and Ichimoku Analysis
Weekly
• Last Candlesticks pattern: Marubozu
• Time of formation: 14 Nov 2016
• Trend bias: Down
Daily
• Last Candlesticks pattern: Shooting star
• Time of formation: 15 Feb 2017
• Trend bias: Down
USD/JPY – 110.47
Although dollar rebounded initially last week, renewed selling interest emerged at 111.71 and the greenback has dropped sharply on Friday after NFP data, suggesting the fall from 1114.37 is still in progress and retest of previous support at 110.24 is likely, however, a break below there is needed to retain bearishness and extend this fall to 110.00, then towards 109.59 support, having said that, loss of downward momentum should prevent sharp fall below minor support at 108.88 and price should stay well above recent low at 108.13, bring another rebound later.
On the upside, whilst recovery back to 110.90-00 cannot be ruled out, reckon the Tenkan-Sen (now at 111.22) would limit upside and bring another decline later. Only above said resistance at 111.71 (Friday’s high) would abort and prolong consolidation, bring test of resistance at 111.95, then 112.13 resistance, break there would bring a stronger rebound to 112.45-50 (61.8% Fibonacci retracement of 113.85-110.24) and possibly towards 113.10-15 but upside should be limited to 113.85 and price should falter well below indicated resistance at 114.37.
Recommendation : Sell at 111.00 for 109.00 with stop above 112.00.
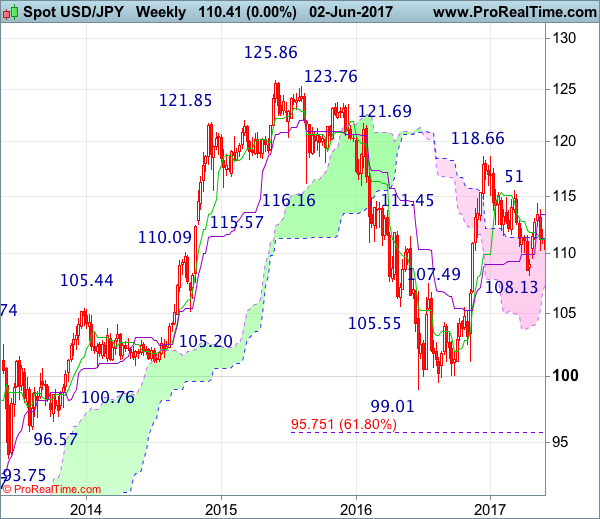
On the weekly chart, dollar ran into heavy offers at 111.71 and has slipped again, suggesting the retreat from 114.37 is still in progress and break of previous support at 110.24 would bring further decline to 109.59 support, however, a weekly close below there is needed to add credence to our view that the rebound from 108.13 has ended, bring subsequent weakness to 108.85-90 but said support at 108.13 should remain intact. In the event dollar drops below said support at 108.13, this would signal the fall from 118.66 top has resumed and extend weakness towards previous resistance at 107.49.
On the upside, expect recovery to be limited to 111.00 and resistance at 111.71 should hold, bring another decliner. Above said resistance at 111.71 would bring test of previous resistance at 112.13 but only break there would defer and risk a stronger rebound to 112.45-50, then 112.70-75, break there would suggest the retreat from 114.37 has ended instead, bring test of 113.10-15, then towards the Kijun-Sen (now at 113.40) but break of 113.85 is needed to signal another leg of rebound from 110.24 is underway for a retest of 114.37 later. Looking ahead, only break of said resistance at 114.37 would extend the rise from 108.13 to 114.60-65 (61.8% Fibonacci retracement of 118.66-108.13), then towards resistance at 115.51 which is likely to hold from here.
Forex Technical Analysis: EUR/USD, USD/JPY, GBP/USD
EUR/USD
Current level - 1.1265
The outlook remains positive, for a violation of 1.1300 area, towards 1.1430 hurdle. Crucial on the downside is 1.1205 low.
| Resistance | Support | ||
| intraday | intraweek | intraday | intraweek |
| 1.1300 | 1.1360 | 1.1205 | 1.1022 |
| 1.1430 | 1.1610 | 1.1165 | 1.0838 |
USD/JPY
Current level - 110.65
The recent slide through 111.15 shows a negative outlook, for a break through 110.20, towards 109.50 area.
| Resistance | Support | ||
| intraday | intraweek | intraday | intraweek |
| 111.15 | 114.30 | 110.20 | 109.40 |
| 112.10 | 115.60 | 109.50 | 108.12 |
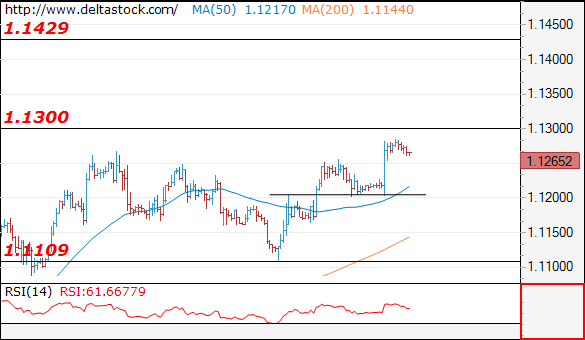
GBP/USD
Current level - 1.2865
The intraday bias is neutral and only a break through 1.2930 will signal, that an uptrend unfolds, toward 1.3050.
| Resistance | Support | ||
| intraday | intraweek | intraday | intraweek |
| 1.2930 | 1.3120 | 1.2770 | 1.2770 |
| 1.3050 | 1.3500 | 1.2705 | 1.2610 |
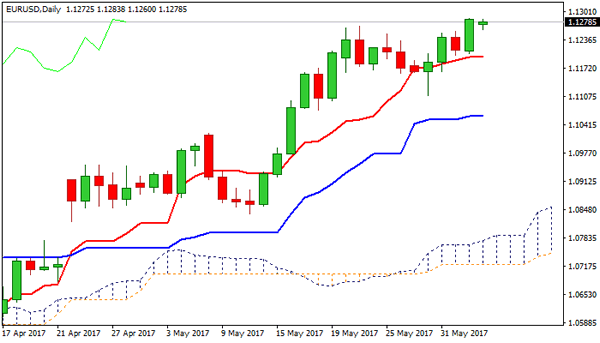
Technical Outlook: EURUSD Remains Biased Higher, Extended Consolidation Seen Likely Ahead Of ECB
The Euro is consolidating under Friday's fresh high at 1.1285 which was touched again in early Asian session on Monday. Overall structure is bullish and underpinned by Friday's long green candle and eventual break and close above previous high at 1.1268, posted on 23 May, after the Euro rallied on Friday, boosted by downbeat US jobs numbers.
Limited correction is seen preceding fresh upside action which eyes targets at 1.1300 (round-figure / length of current fifth wave of five-wave cycle from 1.0820) and 1.1313 (Fibo 76.4% of 1.1614/1.0340 descend).
Solid supports lay at 1.1254 and 1.1236 (Fibo 38.2% and 61.8% of Friday's post US NFP rally respectively) with extended dips expected to find ground at 1.1213/1.1197 support zone, formed by 10SMA / Daily Tenkan-sen.
The pair is likely to extend consolidative phase until ECB policy meeting (08 June). Hawkish ECB (last week's speculation of reducing QE, forward guidance change and possible early rate hike) would spark stronger rise and expose targets at 1.1366/1.1428.
Conversely, loss of 1.1200 handle would soften near-term structure.
Res: 1.1285, 1.1313, 1.1366, 1.1400
Sup: 1.1254, 1.1236, 1.1213, 1.1197
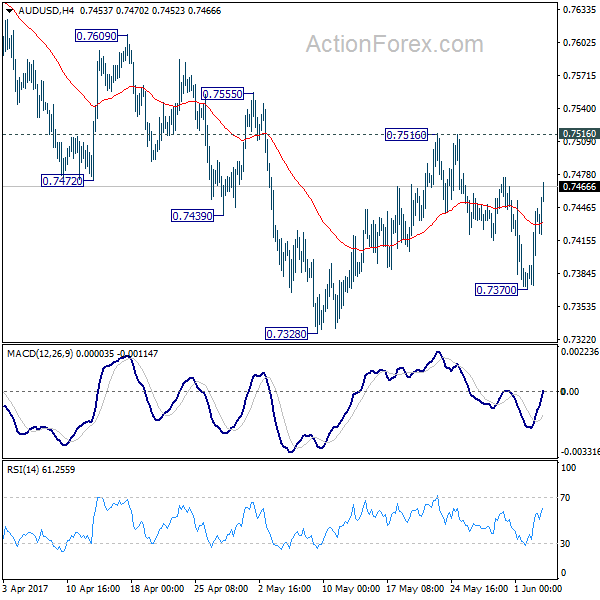
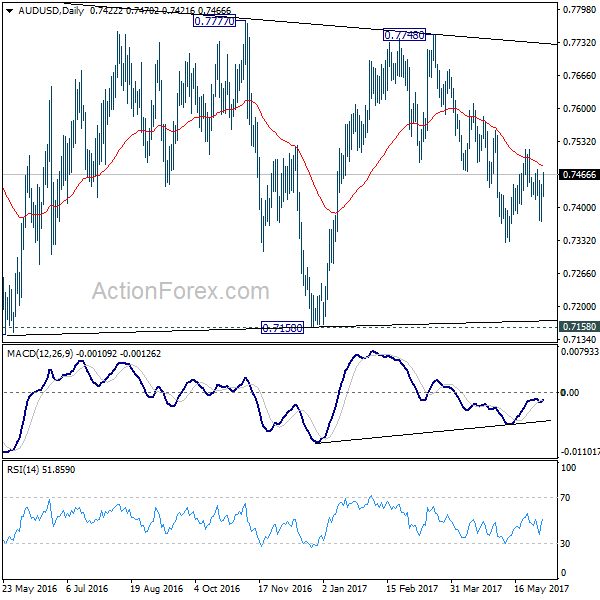
AUD/USD Daily Outlook
Daily Pivots: (S1) 0.7393; (P) 0.7419; (R1) 0.7467; More...
AUD/USD's recovery's from 0.7370 extends higher today but it's staying in range of 0.7370/7516. Intraday bias remains neutral for the moment. As long as 0.7516 resistance holds, deeper fall is expected. Below 0.7328 will resume the decline from 0.7748 to 0.7144/7158 support zone. On the upside, break of 0.7516 resistance will indicate near term reversal and turn bias back to the upside.
In the bigger picture, we're still treating price actions from 0.6826 low as a corrective pattern. And, as long as 38.2% retracement of 0.9504 to 0.6826 at 0.7849 holds, long term down trend from 1.1079 is expected to resume sooner or later. Break of 0.6826 low will target 0.6008 key support level. However, firm break of 0.7849 will indicate that rise from 0.6826 is developing into a medium term rebound, rather than a sideway pattern. In such case, stronger rise should be seen to 55 month EMA (now at 0.8091) and above.
Forex Trading Subdued in Holiday Markets, AUD Lifted by Chinese Data
The forex markets are generally quite quiet today with many European countries on holiday. Nonetheless, Aussie is trading broadly higher as boosted by Chinese services data. Canadian Dollar also strengthens as oil price is lifted mildly by geopolitical news in Middle East. The greenback tried to recovery against Europeans and Yen but lost momentum in early European session. Meanwhile, Sterling showed little reaction to the terrorist attack in London as markets are holding their breath ahead of UK election. Services data are the main focus for today but markets will look through them to key events on Thursday.
UK election race tightens up
The race continued to tighten up ahead of UK General Election on Thursday. According to a poll by Survation for The Mail on Sunday, support for Conservative dropped further to 40%, while that for Labour rose to 39%. That is, the Tories are only have a 1-point lead over Labour. On other hand other, a ComRes poll showed that support for Conservatives rose one to 47% and that for Labour also rose one 35%. In that case, Tories still maintained a 12-point lead. In the middle, Opinium poll for the Observer found that support for Conservatives was down 2 points to 43%, and that for Labour was up 2 to 37%. That was a 6-point lead.
While the Conservatives are still leading, the trend is certainly worrying for them. But one should also take into consideration that the support for Labour leader Jeremy Corbyn is still far off Prime Minister Theresa May. And that could be the determining factor for the election. Nonetheless, a hung parliament is a realistic possibility and a Labour win can certainly not be ruled out. And without a landslide Conservative win, it would be a disgrace to PM May as her rationale to call for the snap election in the first place was to consolidate support for the Conservative Party, and more importantly for herself, in the Brexit negoation with the EU.
Meanwhile, despite suggestions to delay the election, senior Cabinet minister David Davis indicated that there is no way to legally suspend or delay the general election following Saturday's terrorist attack at London Bridge. Prime Minister May affirmed on Sunday morning that the election "will go ahead as planned".
Euro firm ahead of ECB
Euro stays firm as markets await ECB rate decision later in the week. Recent strong confidence data and hard data have raised speculations that the ECB would change to a less dovish tone in the upcoming meeting on June 8. Hopes are rising that the policymakers would take a more benign view of the economy. They might even drop some of the commitments to increase stimulus, if needed. Tapering announcement is unlikely in June. However, a more upbeat ECB might pave the way for a tapering announcement at the September 7 meeting.
Saudi Arabia, Egypt, Bahrain, and the UAE cut ties with Qatar
Saudi Arabia, Egypt, Bahrain, and the United Arab Emirates cut the diplomatic ties with Qatar, for the latter on its tie to terrorism. In particular, Saudi Arabia's state news agency accused Qatar of embracing "multiple terrorist and sectarian groups aimed at disturbing stability in the region, including the Muslim Brotherhood, ISIS (Islamic State) and al-Qaeda". The Emirates news agency staid that Qatar "support, funding and embrace of terrorist, extremist and sectarian organizations." WTI crude oil trades mildly up today as markets are starting to reprice-in some geopolitical risks. But it's struggling to gain any momentum back to 50 handle.
On the data front...
Australia TD securities inflation rose 0.0% mom in May. China Caixin PMI services rose to 52.8 in May. UK PMI services will be the main feature in European session. Eurozone will also release PMI services final. US will release ISM non-manufacturing, factory orders, labor market conditions index and non-farm productivity.
AUD/USD Daily Outlook
Daily Pivots: (S1) 0.7393; (P) 0.7419; (R1) 0.7467; More...
AUD/USD's recovery's from 0.7370 extends higher today but it's staying in range of 0.7370/7516. Intraday bias remains neutral for the moment. As long as 0.7516 resistance holds, deeper fall is expected. Below 0.7328 will resume the decline from 0.7748 to 0.7144/7158 support zone. On the upside, break of 0.7516 resistance will indicate near term reversal and turn bias back to the upside.
In the bigger picture, we're still treating price actions from 0.6826 low as a corrective pattern. And, as long as 38.2% retracement of 0.9504 to 0.6826 at 0.7849 holds, long term down trend from 1.1079 is expected to resume sooner or later. Break of 0.6826 low will target 0.6008 key support level. However, firm break of 0.7849 will indicate that rise from 0.6826 is developing into a medium term rebound, rather than a sideway pattern. In such case, stronger rise should be seen to 55 month EMA (now at 0.8091) and above.
Economic Indicators Update
| GMT | Ccy | Events | Actual | Forecast | Previous | Revised |
|---|---|---|---|---|---|---|
| 1:00 | AUD | TD Securities Inflation M/M May | 0.00% | 0.50% | ||
| 1:00 | AUD | TD Securities Inflation Y/Y May | 2.80% | 2.60% | ||
| 1:45 | CNY | Caixin PMI Services May | 52.8 | 51.4 | 51.5 | |
| 7:45 | EUR | Italy Services PMI May | 55.3 | 56.2 | ||
| 7:50 | EUR | France Services PMI May F | 58 | 58 | ||
| 7:55 | EUR | Germany Services PMI May F | 55.2 | 55.2 | ||
| 8:00 | EUR | Eurozone Services PMI May F | 56.2 | 56.2 | ||
| 8:30 | GBP | Services PMI May | 55 | 55.8 | ||
| 12:30 | USD | Non-Farm Productivity Q1 F | -0.20% | -0.60% | ||
| 12:30 | USD | Unit Labor Costs Q1 F | 2.40% | 3.00% | ||
| 14:00 | USD | ISM Non-Manufacturing Composite May | 57.1 | 57.5 | ||
| 14:00 | USD | Labor Market Conditions Index Change May | 3 | 3.5 | ||
| 14:00 | USD | Factory Orders Apr | -0.20% | 0.20% |