Sample Category Title
Swiss Franc Trading Lower In The Asian Session
For the 24 hours to 23:00 GMT, the USD declined 0.89% against the CHF and closed at 0.9624 on Friday.
In the Asian session, at GMT0300, the pair is trading at 0.9636, with the USD trading 0.12% higher from Friday’s close.
The pair is expected to find support at 0.9600, and a fall through could take it to the next support level of 0.9563. The pair is expected to find its first resistance at 0.9696, and a rise through could take it to the next resistance level of 0.9755.
The currency pair is trading below its 20 Hr and 50 Hr moving averages.

Canadian International Merchandise Trade Deficit Slid In April
For the 24 hours to 23:00 GMT, the USD declined 0.13% against the CAD and closed at 1.3493 on Friday.
On Friday, data revealed that Canada's international merchandise trade deficit fell to C$0.37 billion in April, compared to a revised international merchandise trade deficit of C$0.94 billion in the previous month. Markets were expecting the nation to post a trade deficit of C$0.02 billion.
Additionally, the nation's labour productivity registered a rise of 1.4% on a quarterly basis in 1Q 2017, higher than market expectations for an advance of 1.2%. In the previous quarter, labour productivity had climbed 0.4%.
In the Asian session, at GMT0300, the pair is trading at 1.3489, with the USD trading a tad lower from Friday's close.
The pair is expected to find support at 1.3464, and a fall through could take it to the next support level of 1.344. The pair is expected to find its first resistance at 1.353, and a rise through could take it to the next resistance level of 1.3572.
Amid a lack of economic data in Canada today, market participants will look forward to global economic releases for further direction in the currency pair.
The currency pair is trading below its 20 Hr and 50 Hr moving averages.

Weekly Technical Outlook And Review: EUR/USD, GBP/USD, AUD/USD, USD/JPY, USD/CAD, USD/CHF, DOW 30, GOLD
A note on lower timeframe confirming price action...
Waiting for lower timeframe confirmation is our main tool to confirm strength within higher timeframe zones, and has really been the key to our trading success. It takes a little time to understand the subtle nuances, however, as each trade is never the same, but once you master the rhythm so to speak, you will be saved from countless unnecessary losing trades. The following is a list of what we look for:
- A break/retest of supply or demand dependent on which way you're trading.
- A trendline break/retest.
- Buying/selling tails ... essentially we look for a cluster of very obvious spikes off of lower timeframe support and resistance levels within the higher timeframe zone.
- Candlestick patterns. We tend to only stick with pin bars and engulfing bars as these have proven to be the most effective.
We typically search for lower-timeframe confirmation between the M15 and H1 timeframes, since most of our higher-timeframe areas begin with the H4. Stops are usually placed 1-3 pips beyond confirming structures.
EUR/USD
Weekly gain/loss: + 102 pips
Weekly closing price: 1.1280
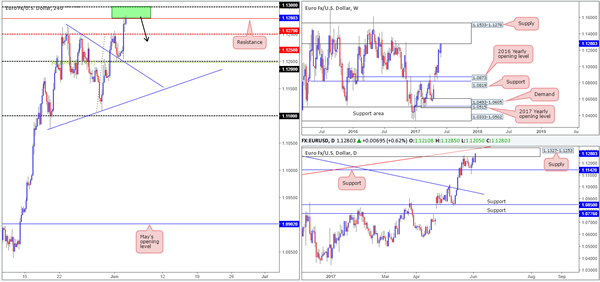
Thanks to last week's push to the upside (which for all you candle enthusiasts out there, formed a bullish engulfing candle) weekly supply at 1.1533-1.1278 is now in play. The zone has also managed to cap upside since May 2015, so it's not a base one should overlook!
Glued to the underside of the said weekly supply area is a daily supply zone visible at 1.1327-1.1253, which happens to intersect with a daily trendline resistance etched from the low 1.0711. Although Friday's candle pushed higher into this zone, shaped by a near-full-bodied bullish candle, it deserves respect since it has held the unit lower since mid-September 2016.
Friday's disappointing US employment report saw the EUR/USD increase in value as the US dollar took a hit, clocking a low of 96.72. Payroll numbers revealed the US economy added 138k jobs in May, missing market consensus at 185k. The unemployment rate came in slightly above expectations at 4.3%, while average hourly earnings came in as expected at 0.2%.
While we agree the bulls do look in fine form on the H4 chart, following the recent bounce off the trendline support etched from the high 1.1267 (shadowed closely by the 1.12 handle), there may trouble lurking ahead. Thanks to Friday's advance, we are now seeing price test resistance coming in at 1.1279, which is followed closely by the large psychological band 1.30. Combined, these two levels are of interest to our desk.
Our suggestions: Due to the said H4 zone marked in green forming within the above noted higher-timeframe supplies, we're keen to short from this area. However though, we would need to see a reasonably sized H4 bearish candle form here, preferably a full-bodied candle, before pulling the sell trigger. This is mainly because we feel price may look to challenge 1.30 and possibly whipsaw above it before serious sellers step in. Should this trade come to fruition, our first take-profit zone will be the mid-level support pegged at 1.1250.
Data points to consider: US ISM Non-manufacturing PMI at 3pm GMT+1.
Levels to watch/live orders:
- Buys: Flat (stop loss: N/A).
- Sells: 1.13/1.1279 ([waiting for a reasonably sized H4 bear candle – preferably a full-bodied candle – to form before pulling the trigger is advised] stop loss: ideally beyond the candle's wick).
GBP/USD:
Weekly gain/loss: + 84 pips
Weekly closing price: 1.2889
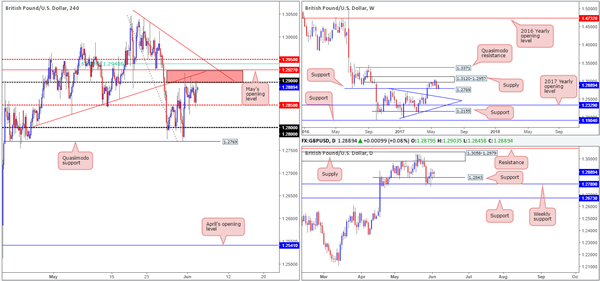
Despite the strong bearish move from weekly supply at 1.3120-1.2957 two weeks back, weekly sellers could not muster enough strength to breach weekly support at 1.2789 last week. This could lead to price forming a tight consolidation between these two structures in the weeks to come.
The bounce from weekly support forced the daily candles to break above 1.2843, which, as you can see, provided support for the remainder of the week. Supposing the level continues to hold, it's likely we'll see supply at 1.3058-1.2979 come into action (positioned within the limits of the said weekly supply).
The aftermath of Friday's US job's report saw the H4 bulls bounce from mid-level support at 1.2850 and touch gloves with the 1.29 handle, consequently forming a range between the two levels. The top edge of this range, however, is bolstered by May's opening level at 1.2927 and a H4 trendline resistance taken from the low 1.2804 (red zone).
Our suggestions: At this moment in time, we would still not consider becoming a seller in this market, despite the H4 (red) zone housing confluence. The reason for why is due to the lower edge of the said weekly supply being positioned a tad above this sell zone at 1.2957. So therefore, a sell from the H4 mid-level resistance 1.2950 (merges with a H4 trendline resistance taken from the high 1.3042 and a H4 61.8% Fib resistance at 1.2941 extended from the high 1.3047) may be the more logical approach, in our humble opinion.
However, we must stress that there is also a strong possibility of a fakeout being seen around 1.2950. This is because the lower edge of daily supply does not come into view until 1.2979. With that, we feel waiting for a lower-timeframe confirming setup to form (see the top of this report) around 1.2950 might be the better/safer route to take here before pulling the trigger.
Data points to consider: UK Services PMI at 9.30am. US ISM Non-manufacturing PMI at 3pm GMT+1.
Levels to watch/live orders:
- Buys: Flat (stop loss: N/A).
- Sells: 1.2950 region ([waiting for a lower-timeframe sell signal to print is advisable] stop loss: dependent on where one confirms this line).
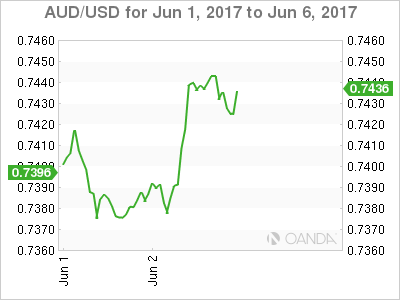
AUD/USD:
Weekly gain/loss: – 3 pips
Weekly closing price: 0.7442
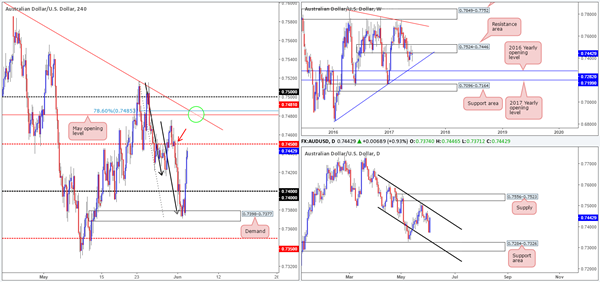
AUD/USD prices are effectively unchanged this week, despite ranging over 100 pips. Regardless of this though, weekly price remains loitering beneath the weekly supply coming in at 0.7849-0.7752 and therefore could eventually push the couple down to a trendline support etched from the low 0.6827.
Bouncing down to the daily timeframe, it's relatively clear to see the candles have been trading within a descending channel since April. Judging by Friday's advancing candle, it looks as though we may be in for a test of the upper edge of this said channel sometime this week.
A closer look at price action on the H4 chart shows demand at 0.7398-0.7377, which happened to hold a H4 AB=CD bullish completion point (see black arrows) within, hold firm on Friday. The move, however, was further bolstered by a disappointing US employment report that helped clear offers from the 0.74 handle. Friday's rally continued throughout the US segment and ended the day closing just ahead of the H4 mid-level resistance marked at 0.7450.
Our suggestions: We have little interest in trying to short 0.7450 since it appears that most of the orders here may have already been tagged by the H4 wick seen marked with a red arrow at 0.7454. This leaves May's opening level at 0.7481 (blends nicely with both the upper edge of the daily descending channel mentioned above and a 78.6% retracement taken from the high 0.7517) on the radar.
With there being a possibility of price whipsawing through 0.7481 up to the 0.75 handle, we would, if you consider 0.7481 to be an adequate sell zone, advise waiting for a lower-timeframe sell signal to take shape before committing to a position (see the top of this report).
Data points to consider: US ISM Non-manufacturing PMI at 3pm GMT+1.
Levels to watch/live orders:
- Buys: Flat (stop loss: N/A).
- Sells: 0.7481 region ([waiting for a lower-timeframe sell signal to print is advisable] stop loss: dependent on where one confirms this line).
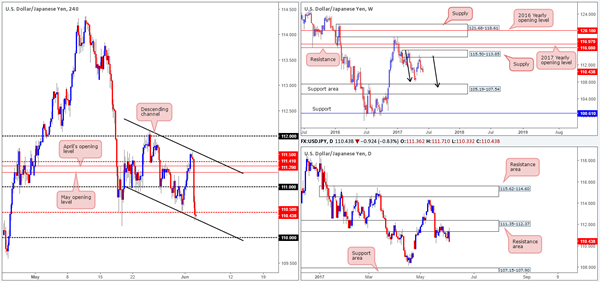
USD/JPY:
Weekly gain/loss: – 87 pips
Weekly closing price: 110.43
Weekly bears remain in a relatively strong position after pushing aggressively lower from supply registered at 115.50-113.85. We know there's a lot of ground to cover here, but this move could possibly result in further downside taking shape in the form of a weekly AB=CD correction (see black arrows) that terminates within a weekly support area marked at 105.19-107.54 (stretches all the way back to early 2014).
In conjunction with weekly flow, daily price continues to defend the resistance area penciled in at 111.35-112.37. Also noteworthy is Friday's action printed a strong-looking bearish engulfing candle from this zone, which could see price drive lower in the coming week to 107.15-107.90: a support zone that's glued to the top edge of the said weekly support area.
Looking over to the H4 candles, price failed to sustain gains beyond the mid-level number 111.50 on Friday and plummeted lower. The move was initiated by a weak US employment report that saw price conclude trade closing below the mid-level number 110.50. With both weekly and daily charts indicating that further downside may be on the cards, we feel it's unlikely that the channel support taken from the low 110.92 will hold firm.
Our suggestions: With the above notes in mind, our desk will be assessing how the lower-timeframe price action behaves beneath 110.50. Should we happen to come across a lower-timeframe signal (see the top of this report for signals that we use), we would, dependent on the time of day, look to sell this market and target the 110 handle as an initial take-profit zone.
Data points to consider: US ISM Non-manufacturing PMI at 3pm GMT+1.
Levels to watch/live orders:
- Buys: Flat (stop loss: N/A).
- Sells: 110.50 region ([waiting for a lower-timeframe sell signal to print is advisable] stop loss: dependent on where one confirms this line).
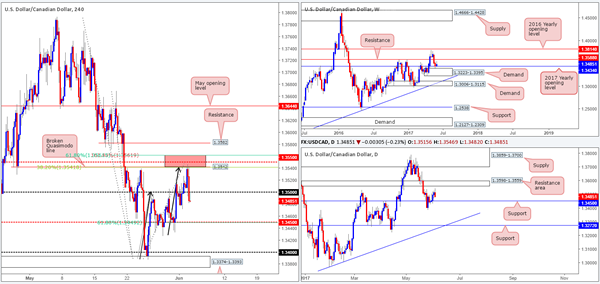
USD/CAD:
Weekly gain/loss: + 39 pips
Weekly closing price: 1.3485
Despite last week's end-of-week correction, the pair remains bolstered by the 2017 yearly opening level pegged at 1.3434. Sitting directly beneath this line is a weekly demand penciled in at 1.3223-1.3395, while to the upside we have a weekly resistance line drawn from 1.3588.
Moving down a notch to the daily timeframe, the couple is currently seen trading between a resistance area at 1.3598-1.3559 and a support base chalked in at 1.3450. With this support level consumed, there'd be little stopping the unit from challenging support at 1.3272, which happens to tie in beautifully with a trendline support (1.2968). A break beyond the current resistance area on the other hand would likely draw price back up to supply visible at 1.3859-1.3700, which holds the 2016 yearly opening level within at 1.3814.
For those who read Friday's report you may recall our desk highlighting the 1.3561/1.3541 H4 zone marked in red as a potential place to short from. As you can see, with the help of lower-than-expected US employment figures, the pair sold off beautifully from this zone. Well done to any of our readers who managed to jump aboard this one, as price closed the week out below the 1.35 handle!
Our suggestions: Looking to short beyond 1.35 is, of course, an option here. Nevertheless, selling this market knowing that weekly price is trading from support (the 2017 yearly opening level) as well as daily price lurking just ahead of support mentioned above at 1.3450, is not really our cup of tea! It poses too much of a risk, in our opinion.
Instead, what we're now looking at is longs from the H4 mid-level support 1.3450 (also denotes a daily support as highlighted above). This – coupled with 1.3450 being joined by a 61.8% H4 Fib support line taken from the low 1.3387 and also the current weekly support, it is likely going to produce a bounce higher. To be on the safe side here though, we'd recommend waiting for the lower timeframes to prove buyer interest exists here (see the top of this report). This will help avoid an unnecessary loss.
Data points to consider: US ISM Non-manufacturing PMI at 3pm GMT+1.
Levels to watch/live orders:
- Buys: 1.3450 region ([waiting for a lower-timeframe buy signal to print is advisable] stop loss: dependent on where one confirms this line).
- Sells: Flat (Stop loss: N/A).
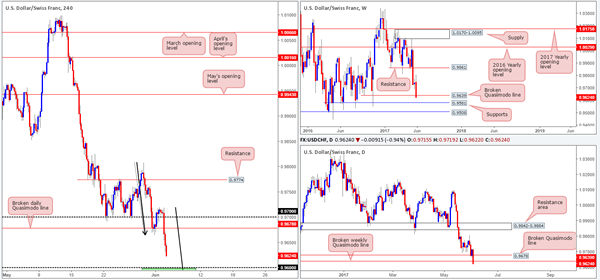
USD/CHF
Weekly gain/loss: – 119 pips
Weekly closing price: 0.9624
(Trade update: suffered a small loss on the long taken from 0.9708).
Following a brief pause, the USD/CHF resumed its decline south last week and consequently closed below the weekly Quasimodo support line at 0.9639 in the shape of a full-bodied bearish candle. The next downside target beyond this line is seen around a support level drawn from 0.9581.
Friday's close below the aforementioned weekly Quasimodo line has, as far as we can see, cleared the runway south all the way down to 0.9546: a daily triple-bottom formation. Should price reach this line, however, we'd be wary of taking a long from here since a daily Quasimodo support level is seen lurking just below at 0.9488.
The aftermath of Friday's disappointing US non-farm payrolls data saw the Swissy aggressively run through the 0.97 handle. The pair continued to selloff during the US segment, and resulted in the market closing just ahead of the 0.96 handle.
Now, 0.96 deserves attention! Not only is it positioned nearby the weekly support mentioned above at 0.9581, it also sits close to a H4 AB=CD (see black arrows) 161.8% bullish completion point at 0.9572. In addition to this, we have correlation confluence here as well. The EUR/USD is considered oversold and will likely selloff from 1.13/1.1279 (see our EUR/USD report).
Our suggestions: Wait for H4 price to attack 0.9572/0.96 and watch to see if the H4 candles can print a reasonably sized H4 bull candle, preferably a full-bodied candle, before pushing the buy button. This, of course, will by no means guarantee a winning trade, but it will help determine buyer interest and help avoid an unnecessary loss! The first take-profit target from this base will be set around the broken daily Quasimodo line at 0.9678.
Data points to consider: US ISM Non-manufacturing PMI at 3pm GMT+1.
Levels to watch/live orders:
- Buys: 0.9572/0.96 ([waiting for a reasonably sized H4 bull candle – preferably a full-bodied candle – to form before pulling the trigger is advised] stop loss: ideally beyond the candle's tail).
- Sells: Flat (stop loss: N/A).
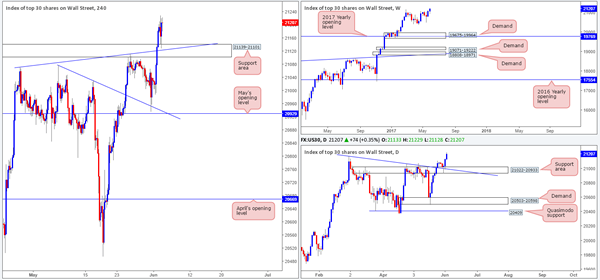
DOW 30
Weekly gain/loss: + 125 points
Weekly closing price: 21207
Over the course of last week's trading, US equities punched to fresh record highs at 21229. The move came after a three-month consolidation, which achieved an ultimate low of 20371 back in mid-April.
The story on the daily chart shows that the unit extended Wednesday's bounce further on Friday from the support area pegged at 21022-20933, which, as we already know, achieved fresh all-time highs.
For those who read Friday's report you may remember we mentioned to keep an eye on the H4 support area at 21139-21101 (intersects with a H4 trendline support etched from the high 21072) for a potential bounce north. As you can see, this played out perfectly! Well done to any of our readers who managed to jump in long on this one!
With the market showing little resistance up ahead, we believe the DOW will likely continue to push higher in the coming week.
Our suggestions: Based on recent trading, the only thing of interest remains to be a long from the said H4 support area. However, for this happen, we'd need to see price retest the support area for a second time and hold firm. It would be absolutely fantastic to see a bullish H4 candle present itself from here in the shape of a full-bodied candle, as we'd have little hesitation in jumping in long from here!
Data points to consider: US ISM Non-manufacturing PMI at 3pm GMT+1.
Levels to watch/live orders:
- Buys: 21139-21101 ([waiting for a reasonably sized H4 bull candle to form – preferably a full-bodied candle – is advised] stop loss: ideally beyond the candle's tail).
- Sells: Flat (stop loss: N/A).
GOLD:
Weekly gain/loss: +$12.2
Weekly closing price: 1279.1
The yellow metal rallied for a third consecutive week after bouncing beautifully from weekly demand coming in at 1194.8-1229.1. This move could encourage further buying into the market and pull the unit back up to the two weekly Fibonacci extensions 161.8/127.2% at 1313.7/1285.2 taken from the low 1188.1 (green zone).
Looking down to the daily timeframe, nonetheless, we can see that the supply area at 1288.1-1278.3 was brought into the action on Friday. What's interesting about this zone is that it's glued to the underside of the above noted weekly green zone. So, the bears could very well make an appearance from here this week. Another important point worth mentioning is the possibility of further buying. Should this occur (as there's room on the weekly to push slightly higher), the potential AB=CD daily bearish pattern (see black arrows) that terminates a tad beyond the Quasimodo resistance at 1307.8 (positioned within the upper limits of the weekly green zone) may complete.
Friday's US non-farm payrolls report echoed a disappointed tone in the market, consequently sending the US dollar lower and the yellow metal higher. The move, as you can see, broke through May's opening level at 1270.5, and has opened up the path north to the H4 supply registered at 1288.1-1284.2. This area has certainly caught our eye since it is located within the upper limits of the daily supply and also positioned within the lower limits of the green weekly zone. Therefore, we believe it will, at the very least, bounce price lower.
Our suggestions: We will, dependent on the time of day, look to short the above said H4 supply at market, with stops placed at 1288.9.
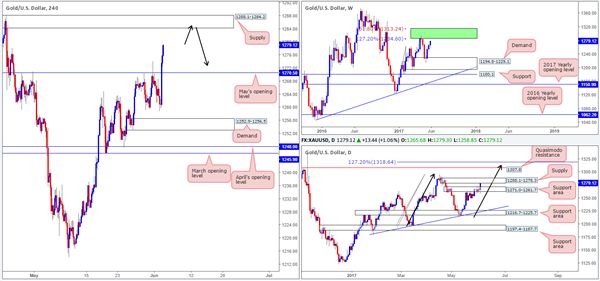
Levels to watch/live orders:
- Buys: Flat (stop loss: N/A).
- Sells: 1284.2 (stop loss: 1288.9).
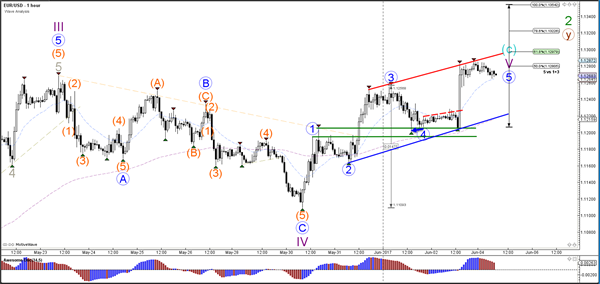
Daily Technical Analysis: EUR/USD Builds Higher High Which Challenges 1.13 Resistance
Currency pair EUR/USD
The EUR/USD bounced at the support levels (green/blue) and showed one more bullish rally. The new higher high is challenging the 100% Fib level at 1.13 of wave 2 (green), which is a break or bounce zone.
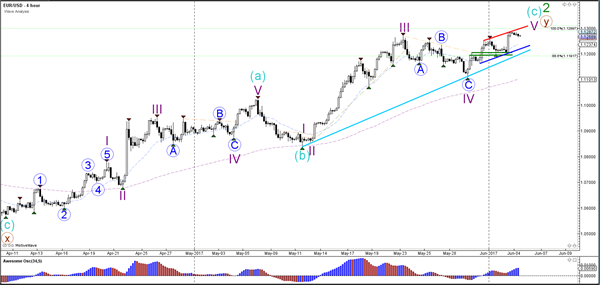
The EUR/USD is in a bullish trend channel (red/blue lines). The breakout direction above or below the channel will indicate what the next trend direction could be.
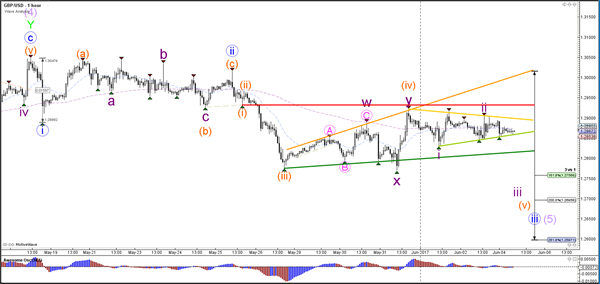
Currency pair GBP/USD
The UK will hold general parliamentary elections on Thursday 8 June 2017. Find out everything you need to know to trade through the UK general election 2017 on the event page.
The GBP/USD is building a corrective pattern which is indicated by the trend lines. A break above it invalidates the wave 3 (blue) whereas a break below support (green) could confirm it.
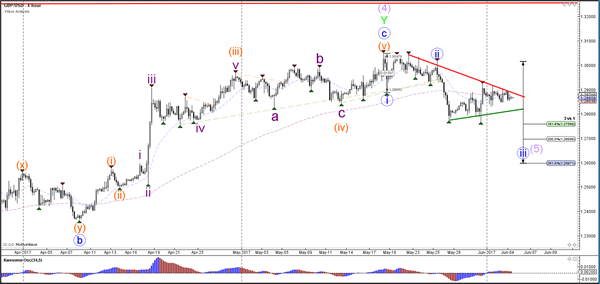
The GBP/USD is building a smaller triangle (yellow/green) within a larger triangle (red/dark green).
Currency pair USD/JPY
The USD/JPY failed to break above the next resistance trend line (red) and turned strongly bearish during the NFP (Non-Farm Payroll) news event. The new lower low indicates that the wave 5 (orange) is still open.
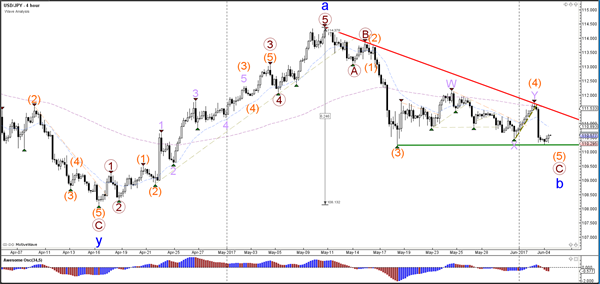
The USD/JPY needs to break below support (green) to complete wave 5 (orange). A break above the 61.8% Fibonacci level of wave 4 (purple) makes the wave 4 unlikely. In that case the wave 5 could have been completed at the recent low.
European Open Briefing: The US Dollar Regained Some Strength
Global Markets:
- Asian stock markets: Nikkei down 0.05 %, Shanghai Composite fell 0.50 %, Hang Seng declined 0.25 %, ASX 200 lost 0.80 %
- Commodities: Gold at $1283 (+0.30 %), Silver at $17.57 (+0.25 %), WTI Oil at $48.35 (+1.50 %), Brent Oil at $50.70 (+1.45 %)
- Rates: US 10-year yield at 2.16, UK 10-year yield at 1.04, German 10-year yield at 0.27
News & Data
- Australia AIG Services Index 51.5 vs 53.0 previous
- Australia Business Inventories m/m 1.2 % vs 0.5 % expected
- Australia Company Gross Operating Profits 6.0 % vs 4.5 % expected
- China Caixin Services PMI 52.8 vs 51.4 expected
- Hong Kong Manufacturing PMI 50.5 vs 51.1 previous
- World Bank says trade, manufacturing to boost 2017 global growth – RTRS
- China services sector expands at fastest pace in four months in May: Caixin PMI – RTRS
CFTC Positioning Data:
- EUR long 73K vs 65K long last week. Longs increased 8K.
- GBP short 30K vs 24K short last week. Shorts increased by 6K
- JPY short 52K vs 52K short last week. Unchanged.
- CHF short 19K vs 20K short last week. Shorts trimmed by 1K
- CAD short 98K vs 99K short. Shorts trimmed by 1K.
- AUD long 3K vs 3K long. No change.
- NZD short 5K vs 9K short last week. Shorts trimmed 4K.
Markets Update:
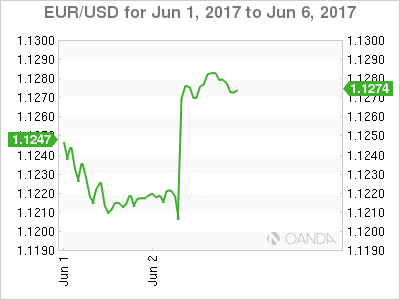
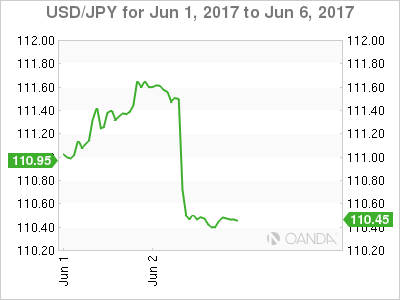
The US Dollar regained some strength following Friday's losses due to the weak employment numbers. EUR/USD opened around 1.1280 in Asia and fell to a low of 1.1265, while GBP/USD declined from 1.2875 to 1.2855. Meanwhile, USD/JPY rose from 110.30 to 110.60 driven by the broad USD strength.
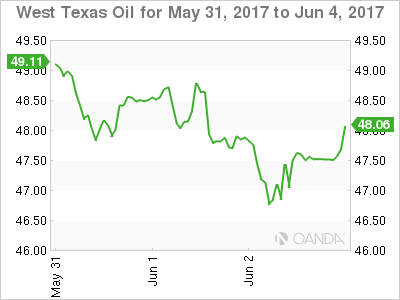
Oil prices rallied following news that several Gulf states have cut their diplomatic relations with Qatar. WTI rose from $47.65 to $48.40 overnight. Resistance is now seen at $49. Should it break above that level, a rally towards $50.50 seems likely.
Upcoming Events:
- 08:45 BST – Italian Services PMI
- 08:50 BST – French Services PMI
- 08:55 BST – German Services PMI
- 09:00 BST – Euro Zone Services PMI
- 09:30 BST – UK Services PMI
- 09:30 BST – Euro Zone Sentix Investor Confidence
- 14:45 BST – US Services PMI
- 15:00 BST – US Factory Orders
- 15:00 BST – US ISM Non-Manufacturing PMI
The Week Ahead:
Tuesday, June 4th
- 05:30 BST – RBA Rate Decision
- 10:00 BST – Euro Zone Retail Sales
- 15:00 BST – US JOLTs Job Openings
- 15:00 BST – Canadian Ivey PMI
Wednesday, June 5th
- 02:30 BST – Australian GDP
- 07:00 BST – German Factory Orders
- 08:30 BST – UK Halifax House Price Index
- 09:00 BST – Italian Retail Sales
- 10:00 BST – Euro Zone GDP
- 15:30 BTS – US Crude Oil Inventories
Thursday, June 6th
- 00:50 BST – Japanese Current Account
- 00:50 BST – Japanese GDP
- 02:30 BST – Australian Trade Balance
- 02:30 BST – Australian Exports
- 02:30 BST – Australian Imports
- 03:45 BST – Chinese Trade Balance
- 03:45 BST – Chinese Exports
- 03:45 BST – Chinese Imports
- 06:45 BST – Swiss Unemployment Rate
- 07:00 BST – German Industrial Production
- 07:15 BST – Swiss CPI
- 12:45 BST – ECB Rate Decision
- 13:30 BST – US Initial Jobless Claims
Friday, June 9th
- 02:30 BST – Australian Home Loans
- 02:30 BST – Chinese CPI
- 07:00 BST – German Trade Balance
- 07:45 BST – French Industrial Production
- 09:30 BST – UK Manufacturing Production
- 09:30 BST – UK Industrial Production
- 13:30 BST – Canadian Employment Change
- 13:30 BST – Canadian Unemployment Rate
Non-Farm Payrolls Send Oil And Gold Higher
The Non-Farm Payrolls did oil and gold a favour on Friday, with event risk this week likely to keep gold perky.
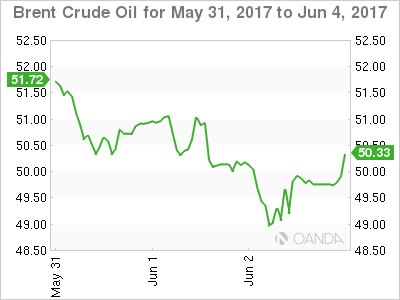
Oil
Oil went on a roller coaster ride Friday, with both Brent and WTI dropping by nearly 3 % at one stage before staging a comeback from behind any sports team would be proud of to finish almost unchanged from Thursday.
The initial price action looked suspiciously stop loss driven with Brent falling through 50.00 and then 49.00 and WTI going directly to jail, trading in a straight line through 47.00 and down to 46.50. After the wash-out of the long positioning had been completed, the much lower Non-Farm Payrolls did oil a huge favour as U.S. Dollar weakened across the board.
Both contracts open unchanged from the New York close this morning with several potentially supportive factors out over the weekend. Firstly a Reuters report suggests that the United States is considering sanctions against Venezuela, its 3rd largest supplier of oil. Then the Saudi Energy Minister said that OPEC might consider further cuts in July after an assessment of the market situation. Thirdly, the National Oceanic and Atmosphere Administration (NOAA) are forecasting a much higher than average likelihood of a severe hurricane season in the Gulf of Mexican, potentially disrupting production seriously.
Brent spot rises to 50.00 this morning with support at the overnight low of 48.70 and resistance at 50.30.
WTI spot increases to 47.50 with support at its overnight low of 47.50 and resistance at 48.00 initially.
Gold
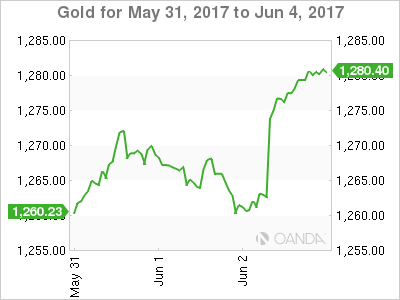
Gold surged over one percent on Friday as the U.S. Dollar weakened following a weak Non-Farm Payrolls report. Unemployment fell, but this was not supportive of the Dollar either it was driven by a lower participation rate.
The latest London terror attacks and Thursday's U.K election will likely provide more support for gold this morning, at least initially, but the overall direction of the yellow metal will be more likely driven by how well the U.S. Dollar comes back, or not, from the poor Friday data. Gold has opened slightly higher from its New York close at 1280.50 today.
From a technical perspective, the trend line support at 1263.60 was briefly broken intra-day on Friday, but gold then recovered handsomely to finish at its highs near 1279. That support line comes in at 1265.20 this morning. Ahead of this gold has interim support at 1270.50.
On the topside, there is no resistance now between gold's present level at 1280.50 and the April high of 1295.70.
Market Morning Briefing: Just As Expected, Dollar Index Has Been Hurt By The US NFP Data
STOCKS
Dow (21206.29, +0.29%) has closed just above the interim horizontal resistance near 21200. Only if the rise sustains can we expect a further rise towards 21500 else a fall back from current levels could take it back to 20800. Our preference is for a rally upwards.
Dax (12822.94, +1.25%) could move up towards 13000-13200 levels in the coming sessions. Near term looks bullish.
Shanghai (3097.11, -0.27%) is likely to trade below 3120 for at least the next few sessions. Downside could extend to 3050.
Nikkei (20205.65, +0.14%) is testing immediate resistance on the daily charts and if that holds, could come off just now towards 19900. But on the longer term charts, these is still scope for a rise towards 20500-21000 levels.
Nifty (9653.50, +0.39%) rose in line with our expectation on Friday and closed just above 9650. Trade within 9630-9670 is possible for the next 2-sessions and the index may remain stable just now. Overall rise towards 9700-9800 is on the cards in the medium term.
COMMODITIES
Gold (1281) closed at the high of the day and may test the resistance zone of 1292-1300 this week if the bullish momentum remains intact, though the chances of downside can’t be negated due to the overbought condition. In case a break below 1270 takes place in the coming sessions, we may have to consider lower levels of 1247 and 1230 respectively. But till the sub 1270 fall really materializes, we prefer to stay cautious.
On the other hand, Silver (17.52) is sustaining the higher levels comfortably irrespective of the overbought condition. Thus we recommend caution at the higher levels for Silver longs.
Copper (2.56) is hovering around its pivot at 2.55 of the trading range of 2.44-2.66. Only above 2.66, higher resistances of 2.72-80 can come into consideration. In the medium term 2.44 are going to be a strong support now but a close below that could open up 2.40-35 levels as well, which could be an ideal level for accumulating.
Brent (50.05) is recovering after making a low at 49, very close to our target of 49.50, dated 30th May, 2017 and now may rise to 51.90-53.30 due to near term oversold condition. 49-50 remains the immediate support zone. WTI (47.78) is also oversold in near term time frame and now it may recover to 49.50-51.20 levels if Brent recuperates to 51.90-53.30. Thus caution must be exercised at the lower levels of both Brent and WTI which may attract buyers near supports. Till now, the bears remain in the driving seat firmly but the possibility of a turnaround (very short term) in the coming days must be kept in mind. In the medium term time frame, we would be bearish on the energy pack while Brent and WTI are trading below 54.60 and 51.50 respectively.
FOREX
Just as expected, Dollar Index (96.77) has been hurt by the US NFP data missing expectations as the labour market shows signs of losing momentum despite the unemployment rate at a 16-year low. It remains to be seen if the major support of 96.50-25 is able to arrest the decline or else 95 or even lower levels may come into consideration.
Euro (1.1272) keeps rising in line with our expectations and our target of 1.1300 is close. It must be noted that Euro is now entering a huge resistance cluster in the band of 1.1300-1.1450 and a sudden selling from anywhere within this band is a distinct possibility. Caution warranted.
The resistance of 112.00 for Dollar Yen (110.57) held and pushed it down as expected and now the support of 110.00 shows initial signs of standing firm. In that case, we may expect the pair to trade sideways without any directional clues for a few sessions more.
Pound (1.2863) remains absolutely indifferent to the terror attack in London yesterday as it waits for the election to be held on Thursday, 8th June. The range of 1.2750-1.3000 is expected to remain intact till the election. If the result threatens the current ruling party, then a decline towards 1.2650-00 can be expected but we prefer to wait for the actual result to take a firm stance.
Aussie (0.7447), contrary to expectations, firmed up above 0.7400 on the back of a weak Dollar and a rebound in Iron ore. It may oscillate in the range of 0.7360-0.7500 for a few days before triggering a trending move if the RBA rate decision due tomorrow fails to introduce any fresh volatility.
Dollar Rupee (64.44) may remain stable between 64.30-70. We will have to assess the chances of a intra-week dip towards 64.20 after the RBI decision Wednesday, 7th June.
INTEREST RATES
The US yields have come down further from levels seen last week. But we could now expect a bounce back from current levels in the near term. the 10YR (2.17%) could move up towards 2.20% and higher while the 30Yr (2.81%) may start bouncing towards 2.90%.
The US 10-5Yr differential (0.44%) has come down as expected and could possibly bounce back in the next couple of sessions. This could indicate that the 10Yr could move higher compared to the 5Yr yield.
The German-US 10YR (-1.89%) has bounced back from immediate support as expected taking the Euro higher with itself. -1.85% is an important resistance for the yield spread and if that holds, the yields spread could come off towards -1.95%. In that case Euro could test 1.130-1.135 in the near term before coming off.
The UK-US (-1.13%) could test immediate channel resistance near -1.08% from where a small dip is possible in the coming sessions.
Japanese yields are moving up and are eventually inching up to higher levels. The 10YR and 30YR are trading at 0.06% and 0.81% respectively as compared to 0.039% and 0.08% seen a week ago. The Japan-US 10Yr yield spread (2.11%) has broken below the near term support and while it moves lower, Dollar-Yen could also come down.
Sombre Start To A Huge Week For Markets
Another clamourous weekend in the United Kingdom as London bore witness to yet another terrorist atrocity. The markets impact has been mute as dealers are becoming desensitised to the shocks knowing that whatever market impact occurs it diminishes quickly.
While campaigning suspended briefly, the UK election will go on as planned. Election polls have been narrowing significantly, with weekend Survation poll showing Mays lead cut to just one point over Labour. But there is a growing sense amongst traders that this could be UK election 2015 'deja vu all over again .'Despite the narrowing in the polls, Labour continues to perform poorly outside of big centres like Manchester and London, which suggest May can still achieve a generous majority despite the polls. The pound is only trading 25-30 pips lower than Friday's close despite the stormy weekend headlines.
In addition to this week's UK election focus will be squarely on ECB meeting.The market is pricing in a chance the ECB will remove their easing bias as we near the critical 1.1300 levels ( Nov high) And while catching this policy turn is too juicy for the market to ignore, it could also produce a setup for near-term disappointment on a buy the rumour sell the fact type scenario.
Ugly best describes Friday's US employment report as the headline miss was compounded by revisions lower to the previous two months data which sent the dollar reeling. Despite the unemployment rate falling and while AHE was in line in a month on month basis, wage growth missed the one-year consensus leaving dealers mulling the lack of inflationary pressure despite low unemployment. And while June hike expectations remain on track, continuance through 2017 remains a question mark as the lack of inflation should dismiss any thought of a paradigm shift in the US monetary system.
Without the support from an active sequencing in US interest rates through the remainder of 2017, the USD will remain vulnerable without its interest rate buffer, even more so as the prospects of US tax reform in 2017 grows dimmer by the day.
EURO
Big week for the EURO that continues to trade in an extremely resilient fashion offering few if any buy on dip opportunities. Even last week's blockbuster ADP report produced little more than a ten pips drop to 1.1200 before buyers snapped up the bargain. But let's face it positioning for a central bank event is never a walk in the park and as we near the 1.1300 level the risk rewards look less appealing on the assumption that the market has all but priced in a less dovish ECB message. While the market favours long EURUSD, traders will likely lighten inventory ahead of the ECB meeting and UK elections.
Japanese Yen
USDJPY had the sharpest reaction to Fridays appalling NFP as the pair was 'bulled' up after Thursday's blockbuster ADP report and the healthy risk appetite that ensued. While the softer Fed scenario should be risk supportive, I suspect the USDJPY will be highly sensitive to US yields this week. Initial support sits at 110.00 but if US yields fail to find some grip we could be viewing a return to the 108 handle.
Australian Dollar
The Australian dollar bounced to .7445 post NFP as weak near-term stops triggered above .7415 on the print. But the June US rate hike is still on as employment growing at an average of ~150K is not necessarily bad for an economy running at near full employment. Given this means interest rate differential are paper thin, that interplay for supporting the Aussie is far less significant than in the past and even more so given the RBA anticipated on hold and neutral policy guidance.
I suspect external drivers will remain dominant as in addition to the ECB and UK election highlights; regional focus should fall back on China this week as China's May trade and export data on Wednesday and its consumer price index release on Friday both of which have the potential to move markets big time
Also, does the weaker US dollar see further CNH appreciation? While I would view a stronger Yuan providing greater purchasing power and supporting trade, but the notion of tighter financial conditions and PMI's in the dreaded contraction zone suggests a struggle on the horizon for the Aussie dollar bulls.
USDCHF – Follows Through Lower On Bearishness.
USDCHF - With the pair extending its weakness the past week, more decline is envisaged in the new week. On the downside, support lies at the 0.9600 level. A turn below here will open the door for more weakness towards the 0.9550 level and then the 0.9500 level. On the upside, resistance resides at the 0.9700 level where a break will clear the way for more strength to occur towards the 0.9750 level. Further out, resistance comes in at the 0.9800 level. All in all, USDCHF faces further bearishness in the new week.
EURUSD – Broader Bias Remains Higher On Bullishness
EURUSD - With the pair closing higher the past week, risk of more strength is likely. Resistance comes in at 1.1300 level with a cut through here opening the door for more upside towards the 1.1350 level. Further up, resistance lies at the 1.1400 level where a break will expose the 1.1450 level. Its daily RSI is bullish and pointing higher suggesting further upside pressure. Conversely, support lies at the 1.1200 level where a violation will aim at the 1.1150 level. A break of here will aim at the 1.1100 level. All in all, EURUSD faces further recovery threats in the new week.