Sample Category Title
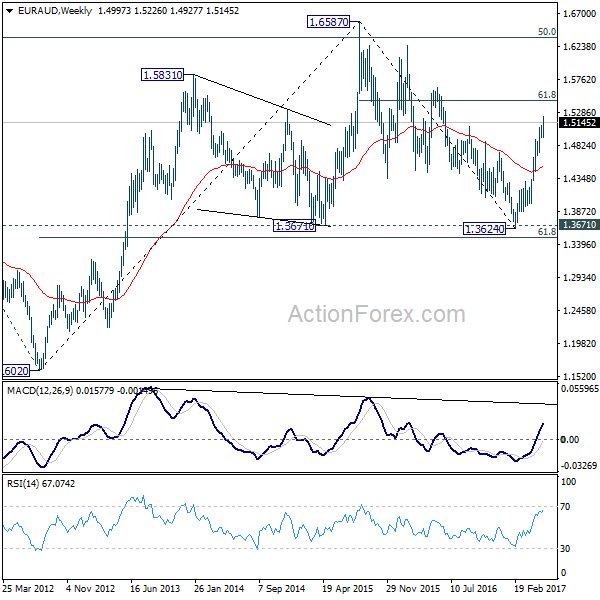
EUR/AUD Weekly Outlook
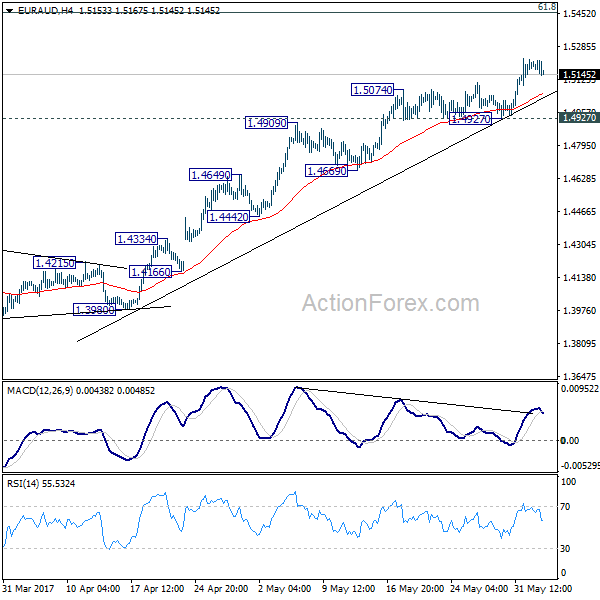
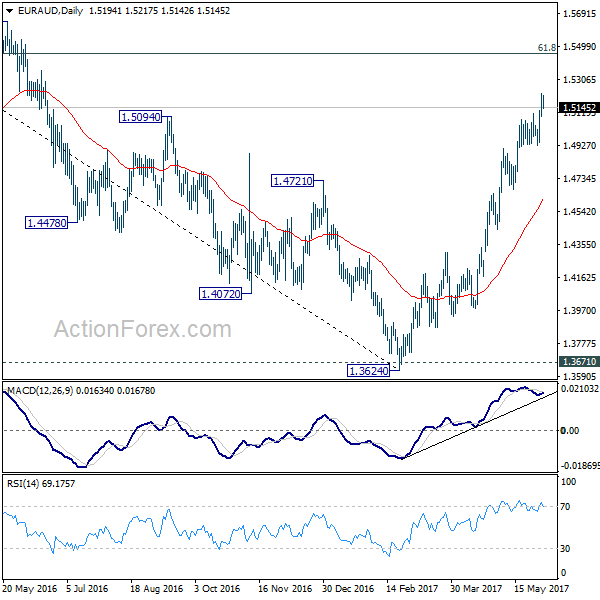
EUR/AUD's rally resumed last week and took out 1.5094 resistance. Initial bias remains on the upside this week. Current rise from 1.3624 should target next medium term fibonacci level at 1.5455. On the downside, break of 1.4927 is needed to signal short term topping. Otherwise, outlook will remain bullish in case of retreat.
In the bigger picture, price actions from 1.6587 medium term top are viewed as a corrective pattern. Such correction should be completed at 1.3624 after defending 1.3671 key support. Rise from 1.3642 is now expected to target 61.8% retracement of 1.6587 to 1.3624 at 1.5455. Sustained break there will pave the way to retest 1.6587. In any case, outlook will now stay cautiously bullish as long as 1.4669 support holds.
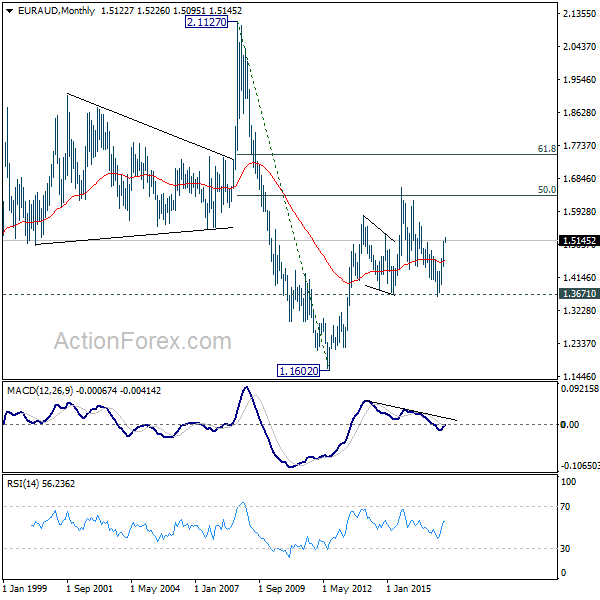
In the longer term picture, the rise from 1.1602 long term bottom isn't over yet. We'll keep monitoring the development but there is prospect of extending the rise to 61.8% retracement of 2.1127 to 1.1602 at 1.7488 and above. However, sustained trading below 1.3671 should confirm trend reversal and target 1.1602 long term bottom again.
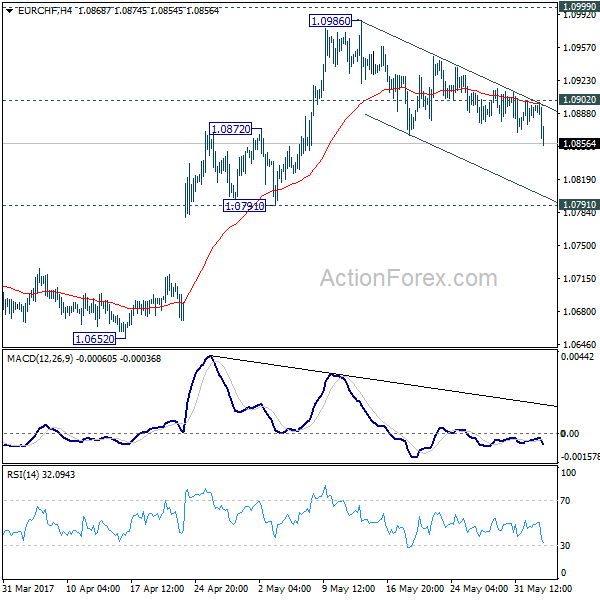
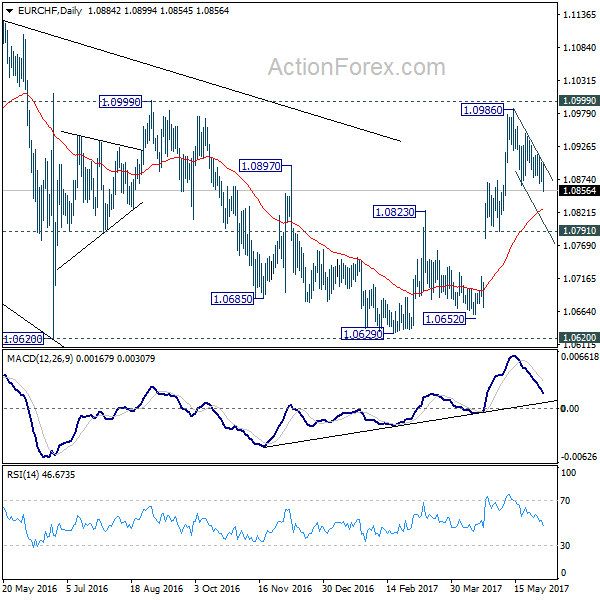
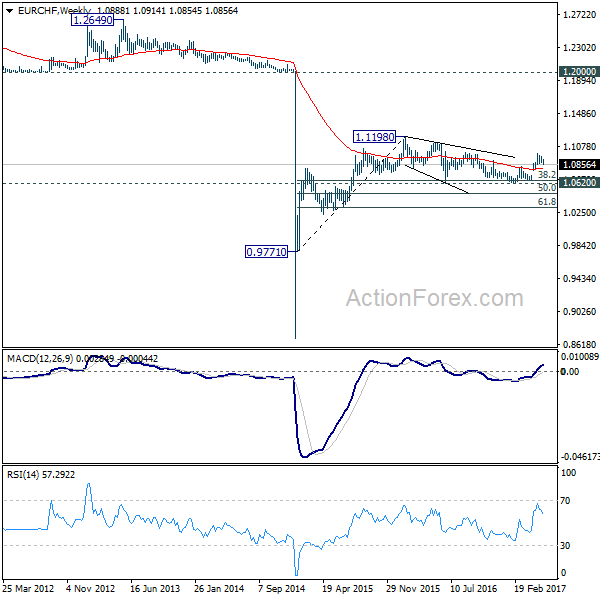
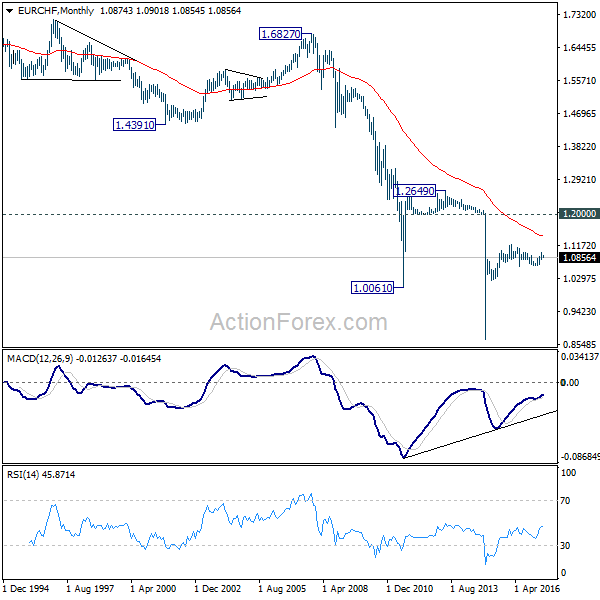
EUR/CHF Weekly Outlook
EUR/CHF's fall from 1.0986 extended lower last week and reached as low as 1.0854. No change in the view that it's a correction. Hence, while deeper decline could be seen this week, downside should be contained by 1.0791/0872 support zone, probably around 55 day EMA (now at 1.0825). Rise from 1.0629 is expected to resume later. Above 1.0902 minor resistance will turn bias back to the upside for 1.0986/0999.
In the bigger picture, the price actions from 1.1198 are seen as a corrective move. Such correction could have completed after defending 38.2% retracement of 0.9771 to 1.1198 at 1.0653. Decisive break of 1.0999 resistance will target a test on 1.1198 high. For now, this will be the preferred case as long as 1.0791 support holds.
All Eyes on Thursday – UK Election, ECB and Comey
Risk appetite in the global financial markets was pretty strong last week. DOW, S&P 500 and NASDAQ shrugged off the much weaker than expected non-farm payroll report from US and all closed at record highs. Strength was also seen in other markets with FTSE 100 in UK and DAX in Germany hitting records too. In Japan, Nikkei also closed above 20000 handle for the first time since 2015. The sharp fall in US yields following NFP argues that markets could be starting to bet on a relatively slower tightening path by Fed and that could be a reason for the strength in US stocks. Eurozone sentiments, on the other hand, was lifted by optimism on easing political risks and improving economic outlook. Meanwhile, UK stocks are riding on the weakening Pound, in particular against Euro.
In the currency markets, Canadian Dollar ended as the weakest major currency as dragged down by the weakness in oil prices. Aussie followed as the second weakest. But both have regained much ground against the greenback after NFP release. Dollar ended as the third weakest one as markets starting question the momentum in US economy and whether it could really withstand a total of three rate hikes this year. Sterling ended as the fourth weakest as traders were getting more cautious ahead of UK election. Swiss Franc and Euro were the strongest ones and the Franc could be additional boosted by safe haven flow from Sterling. Euro were supported firmly by expectations on ECB.
Heavy weight Thursday with UK election...
All eyes will now be on the super heavy weight events on Thursday this week, on June 8. UK election has now turned into an open race as support for Prime Minister Theresa May and Conservative tumbled in recent weeks. Meanwhile, support for Labour and leader Jeremy Crobyn surged. A hung parliament after the election is now a realistic possibility. While the chance is still slim, it's not totally unimaginable even for Crobyn to snap a win. The picture of Brexit negotiation with EU, which is scheduled to start on June 19, is highly uncertain, including the stance, the strategy, the personnel.
And ECB meeting....
One the same day, ECB is widely expected to keep monetary policies unchanged. The new staff projections on growth and inflation will be the first things to watch. Also, there are expectations that ECB could tweak its language a bit to the hawkish side. For example, the central could close the door for further stimulus. There could also be acknowledgement that risks to outlook are now more balanced. And note that the current EUR 60 a month asset purchase program is going to end by the end of the year. It will be reasonable for ECB to start telling the markets what it will do thereafter in the September meeting. And President Mario Draghi could start to pave the way for that announcement in September at this week's press conference.
And James Comey testimony
In US, former FBI Director James Comey, fired by US President Donald Trump last month, will testify before Senate Intelligence Committee this Thursday too. It's certain that Comey will be asked questions regarding Trump's pressure on him to drop investigation into former national security adviser Michael Flynn on his tie to Russia. The markets are generally much more interested to know the details of Trump's tax reforms and policies. But Trump will have to survive this test first.
Dollar index heading to 96.46 fibonacci level
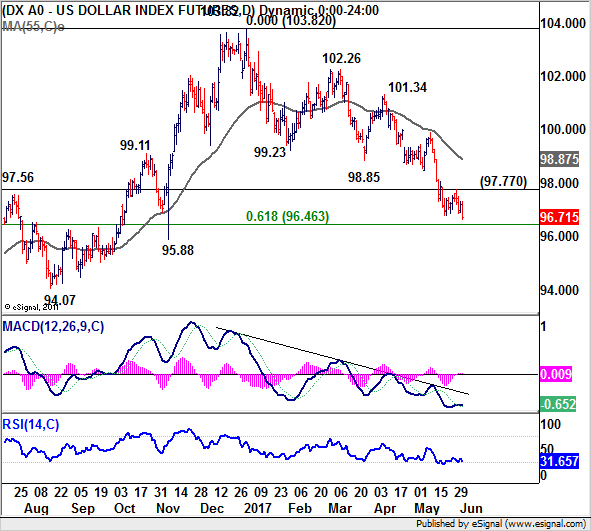
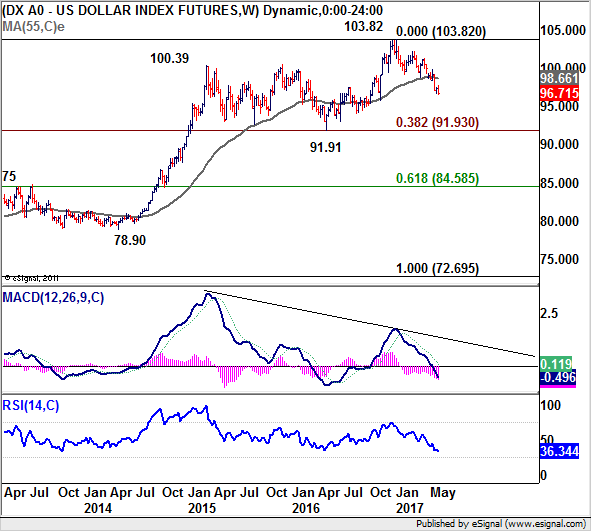
Technically, dollar index resumed recent fall from 103.82 and hit as low as 96.65 last week. Further decline is expected this week for 61.8% retracement of 91.91 to 103.82 at 96.46 this week. This will correspond to EUR/USD's test on 1.1298 resistance. As mentioned before, 103.82 is possibly a medium term top considering bearish divergence condition in weekly MACD and the firm break of 55 week EMA. Fall from 103.82 could turn out to be a medium term correction. Sustained break of 96.46 would pave the way to long term cluster level at 91.91, 38.2% retracement of 72.96 to 103.82 at 91.93, before having enough support for a sustainable rebound. In any case, break of 97.77 resistance is needed to indicate short term bottoming. Otherwise, near term outlook will stay bearish.
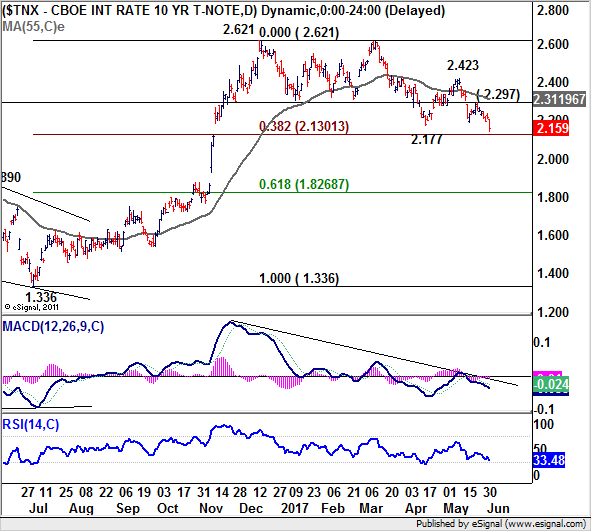
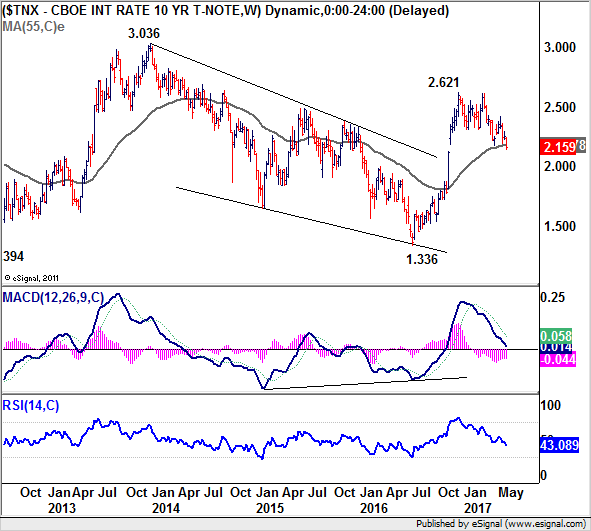
TNX could head to 1.826
10 year yield also dropped sharply last week and finally took out 2.177 support to close at 2.159. Based on the current momentum, TNX would likely fall through 38.2% retracement of 1.336 to 2.621 at 2.130. There will likely be additional selling pressure below 55 week EMA. And a break of 2.130 could then push TNX to 61.8% retracement at 1.826 before completing the correction from 2.621. And for now, near term outlook will stay bearish as long as 2.297 resistance holds.
Strategy: Hold USD/CAD short, sell USD/JPY
Regarding trading strategy, we closed the EUR/AUD long at open last week, at 1.4990 (entered at 1.4790), with 200 pips profit. There was no deep pull back in the cross as we worried. Instead, the cross went on to as high as 1.5226 before closing at 1.5145. We're holding on to USD/CAD short (sold at 1.3510). The cross recovered to as high as 1.3546 last week but was held just inch below our stop at 1.3550. We'll keep the position first with stop at 1.3550. We're still expecting fall from 1.3793 to extend to 1.3222 as our first target, and deeper in medium term.
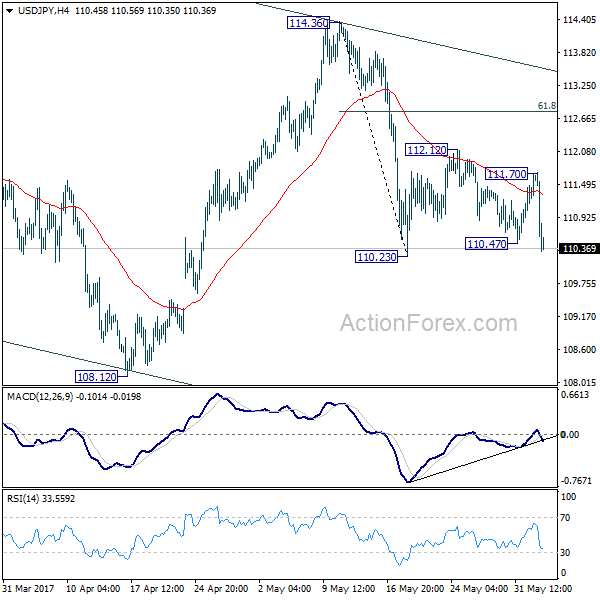
There are many key happenings ahead that could turn the markets around, like ECB's failure to deliver, an unexpected outcome of UK election. But one thing that's more certain is that markets would continue to question Fed's rate path after the weak employment data. Yields will likely stay pressured and head lower even if stocks might extend the record run. That's likely to drag USD/JPY down. Indeed, USD/JPY's break of 110.47 minor support on Friday is seen as an early sign that it's resuming the fall from 114.36. Hence, we'll sell USD/JPY on recovery to 110.80 this week, with stop at 111.70. Break of 110.23 support will send the pair to 108.12 as our first target and 106.48 fibonacci level as second target.
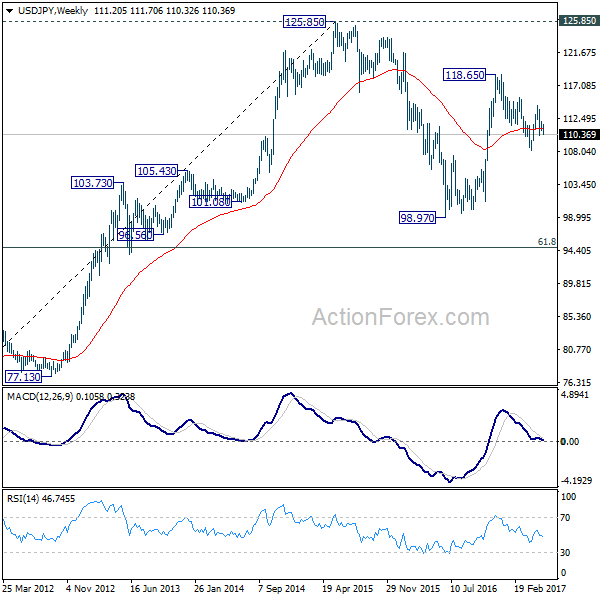
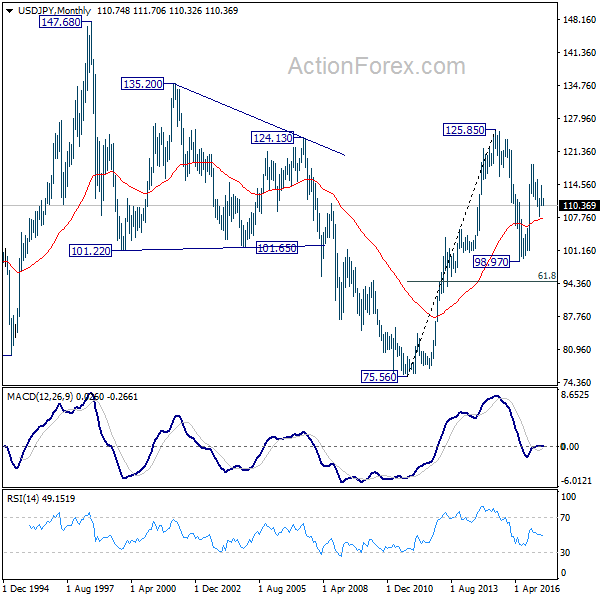
USD/JPY Weekly Outlook
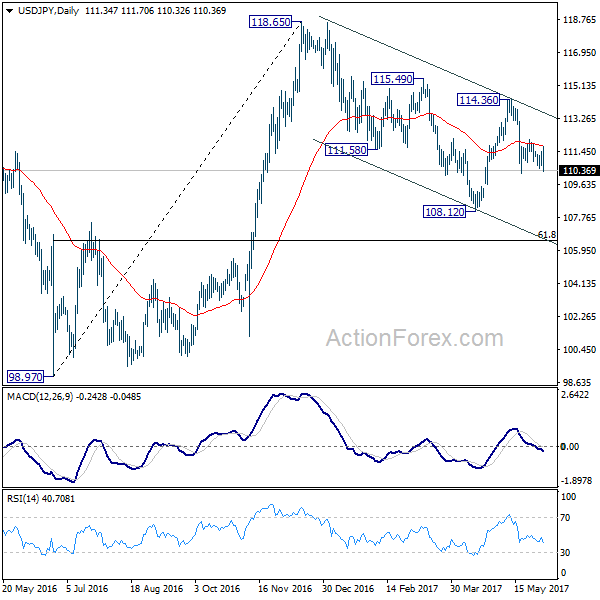
USD/JPY recovered ahead of 110.23 last week as consolidation from there extended. But it was rejected by 55 day EMA and dropped sharply to close at 110.36. Initial bias is cautiously on the downside this week. Break of 110.23 will resume the fall from 114.36. In such case, intraday bias will be turned back to the downside for 108.12 and below. Whole decline from 118.65 is seen as a correction and is still in progress. We'll look for bottoming signal at 61.8% retracement of 98.97 to 118.65 at 106.48 as the correction extends. Meanwhile, above 111.70 will turn intraday bias back to the upside. But we'd expect strong resistance from 61.8% retracement of 114.36 to 110.23 at 112.78 to limit upside and bring fall resumption.
In the bigger picture, price actions from 125.85 high are seen as a corrective pattern. It's uncertain whether it's completed yet. But in case of another fall, downside should be contained by 61.8% retracement of 75.56 to 125.85 at 94.77 to bring rebound. Overall, rise from 75.56 is still expected to resume later after the correction from 125.85 completes.
In the long term picture, the rise from 75.56 long term bottom to 125.85 medium term top is viewed as an impulsive move. Price actions from 125.85 are seen as a corrective move which could still extend. But, up trend from 75.56 is expected to resume at a later stage for above 135.20/147.68 resistance zone.
Summary 6/5 – 6/9
Monday, Jun 5, 2017
[php_everywhere] [/php_everywhere]
Tuesday, Jun 6, 2017
[php_everywhere] [/php_everywhere]
Wednesday, Jun 7, 2017
[php_everywhere] [/php_everywhere]
Thursday, Jun 8, 2017
[php_everywhere] [/php_everywhere]
Friday, Jun 9, 2017
[php_everywhere] [/php_everywhere].
Weekly Economic and Financial Commentary
U.S. Review
Economic Data Point Toward a Stronger Q2
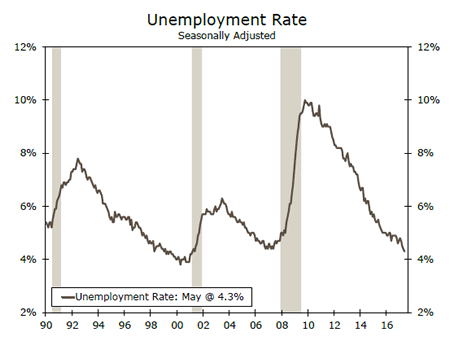
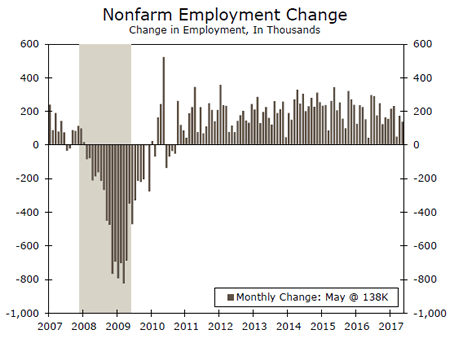
- The May nonfarm payroll report showed an additional 138,000 jobs added to the U.S. labor market with the unemployment rate declining to 4.3 percent.
- Personal income and spending data for April showed consumer spending to be off to a much better start in Q2.
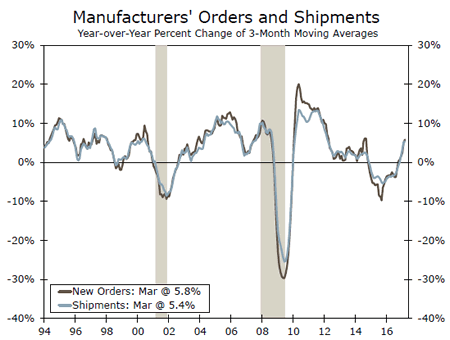
- ISM's manufacturing index remained roughly unchanged in May at 54.9 from April's 54.8 reading. The more forward-looking new orders component climbed higher.
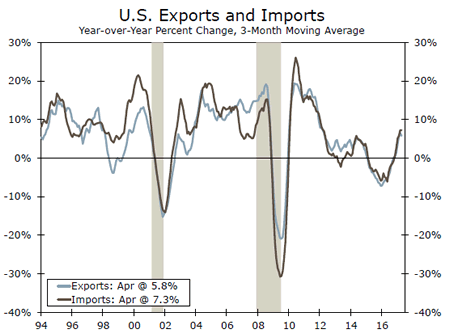
- The trade deficit widened in April to $47.6 billion from March's $45.3 billion deficit.
Economic Data Point Toward a Stronger Q2
Economic data this week continued to support the case for a stronger pace of GDP growth in the second quarter. Real consumer spending rose 0.2 percent in April as income gains continued. May was another decent month for job gains, with the labor market adding 138,000 jobs and the unemployment rate falling to 4.3 percent. The Institute for Supply Management's (ISM) manufacturing index remained roughly unchanged from its May reading but is up relative to the same time last year. A wider trade deficit to start Q2 indicated that trade is likely to subtract from Q2 GDP growth, after adding 0.1 percentage points in Q1.
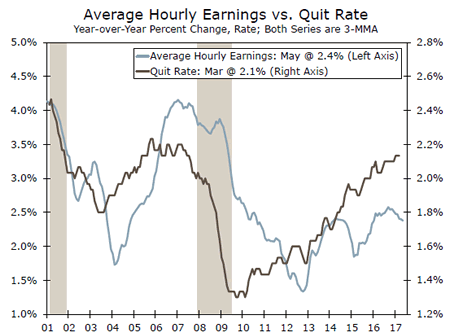
May's nonfarm payroll report showed that 138,000 jobs were added for the month, while the unemployment rate remained low at 4.3 percent. Among the industries adding the most jobs for the month were, professional services, education & health and leisure & hospitality. The unemployment rate dipped to 4.3 percent as the labor force participation rate fell to 62.7 percent, nearly unchanged from the 62.6 percent reading one year ago. Average hourly earnings rose 0.2 percent, resulting in a 2.5 percent gain on a year-over-year basis. In our view, the continued gain in average hourly earnings supports our forecast for two more rate hikes this year (June and September) and the announcement of balance sheet normalization in December.
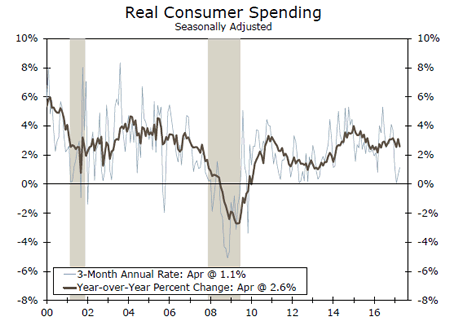
Other consumer sector indicators also continued to support the case for stronger consumer spending in the second quarter. Nominal personal income rose 0.4 percent, while nominal spending rose 0.4 percent in April. In assessing the purchasing power of consumers we tend to focus 0n real disposable income, which controls for inflation and taxes, and which rose 0.2 percent. Real consumer spending in April rose 0.2 percent, taking the three-month moving average to 1.1 percent compared to just 0.6 percent in March. Consumer confidence dipped slightly in May, but, on trend, continues to edge higher. The continued improvement in income, employment and to a lesser extent consumer confidence suggests that there is more momentum behind consumer spending in the second quarter.
On the manufacturing front, the ISM's manufacturing survey indicated that sentiment remained positive within the sector but with little change in the index in May. The new orders component and employment component were up on the month. We continue to expect the manufacturing sector to slowly improve this year as somewhat stronger global demand and an expected increase in domestic business investment should help to support greater manufacturing growth.
The trade deficit widened in April to $47.6 billion from March's $45.3 billion deficit. Exports fell 0.3 percent while imports rose 0.8 percent for the month. We expect the wider trade deficit to subtract from overall GDP growth in the second quarter as domestic demand will continue to boost import growth, while only modest global demand will slow the pace of export growth.
U.S. Outlook
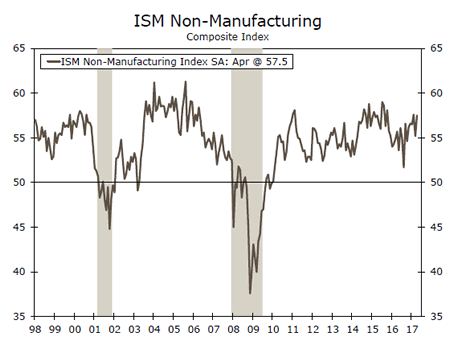
ISM Non-Manufacturing • Monday
The ISM non-manufacturing index bounced back in April, mostly recouping March's 2.4-point decline. At a level of 57.5, the index indicates that economic activity outside of the manufacturing sector is expanding at a decent clip. Both production and new orders leaped higher in April, which reinforces our expectation for economic growth to rebound in the second quarter. Notably, the new orders index rose a solid 4.3 points to 63.2, marking a fresh cycle high. Input price pressures also showed renewed strength in April, rising 4.1 points to 57.6.
Employment was the only major component that did not improve in April, slipping 0.2 points to 51.4. The employment index still signals expansion, but at a slower pace. This is consistent with our forecast for a more modest pace of job growth in the second half of 2017 as the labor market continues to tighten.
Previous: 57.5 Wells Fargo: 56.7
Consensus: 57.0
Factory Orders • Monday
Reports from the factory sector have been mixed. Manufacturing payrolls reported a healthy gain in April, adding 11,000 jobs on the month, and the ISM manufacturing index continues to signal expansion. However, the advanced durable goods orders estimate showed a 0.7 percent decline in April. Shipments of nondefense capital goods orders, ex-aircraft, or core capital goods, slipped 0.1 percent in April and the initially reported gain for March was revised to a scant increase of just 0.2 percent. The March factory orders report showed a 0.5 percent increase in core capital goods orders, but the advanced durable goods report revised away that gain. Core capital goods orders have now flat-lined for two months in a row. This is somewhat disconcerting and may suggest that the long overdue rebound in the factory sector is delayed, yet again. Given the weaker durable goods report, we look for factory orders to decline a modest 0.1 percent in April.
Previous: 0.2% Wells Fargo: -0.1%
Consensus: -0.2% (Month-over-Month)
JOLTS • Tuesday
Job openings rose slightly in March, ending the month at 5.7 million openings. At the industry level, professional & business services openings saw a solid increase of 126,000, while mining & logging shed 8,000 following some recent gains. Involuntary separations continue to remain low as employers appear to be making a solid effort to hold onto their workers in an increasingly tight labor market.
The quit rate held steady at 2.1 percent in March, which is in line with its average over the past year. While this marks a meaningful pickup from earlier in the cycle, the pace of improvement in the quit rate has slowed. A rise in quits would bode well for an increase in wage growth later this year. Average hourly earnings have disappointingly failed to accelerate, despite the low level of unemployment and survey reports of labor shortages.
Previous: 5.7 million
Global Review
Strong Real GDP Growth in Canada and Brazil in Q1
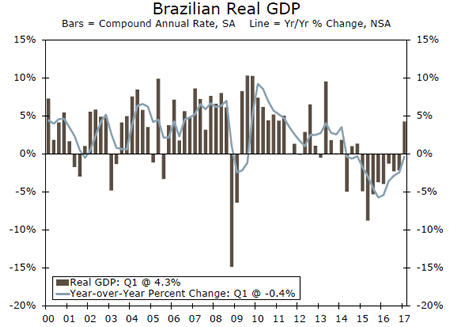
- Real GDP in Canada grew at an annualized rate of 3.7 percent in the first quarter due to robust growth in domestic demand. Real GDP growth in Brazil turned positive for the first time in more than two years, leading to optimism that Latin America's largest economy may finally be exiting its deep downturn.
- The Japanese economy grew at a solid clip in the first quarter, and more recent data indicate that momentum is still positive thus far in Q2. However, inflation in Japan remains uncomfortably low.
Canadian Economy Grew Strongly in Q1
Data released this week showed that real GDP in Canada grew at an annualized rate of 3.7 percent in the first quarter (see chart on front page). Despite the impressive headline figure, the outturn was actually a bit weaker than the consensus forecast. That said, there was very little that was actually "weak" about the data. Real consumer spending jumped 4.3 percent, while investment spending jumped 10.0 percent. The overall rate of GDP growth was held back by the 13.7 percent surge in real imports.
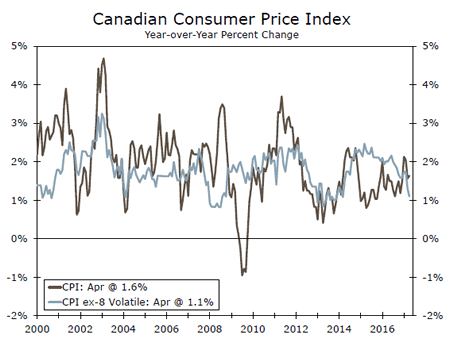
At its policy meeting last week, the Bank of Canada (BoC) did not seem to be in any hurry to follow the Fed by hiking rates. The BoC noted that the adjustment of the Canadian economy to lower oil prices is "largely complete," a claim that seems to be validated by the recent acceleration in economic activity. However, policymakers also believe there is still excess capacity in the economy because wage growth is "still subdued" and measures of consumer price inflation are benign (top chart). Accordingly, we believe the BoC will refrain from hiking rates in 2017.
Is Brazil Finally Exiting Recession?
Brazil also posted a strong growth rate in the first quarter as real GDP grew 4.3 percent at an annualized rate relative to the previous quarter (middle chart). The outturn was notable because it was the first time that real GDP growth has been positive on a sequential basis in more than two years. Despite the positive results in the first quarter, the Brazilian economy remains very weak. Real GDP remains nearly 8 percent below its peak in early 2014, and growth in Q1 was driven entirely by exports. (Consumer, business and government spending all contracted in the first quarter.) That said, recoveries often start in the external sector, and the contractions in domestic spending are generally becoming less deep. In our view, real GDP in Brazil will continue to expand in coming quarters, although the recent political uncertainty that has been introduced by the scandal surrounding President Temer represents a downside risk to our near-term forecast. In general, a return to the supercharged economic growth rates in Brazil that went hand-in-hand with the era of elevated commodity prices, which have subsequently collapsed, is not in the cards anytime soon.
Japanese Economy Starts Q2 on a Strong Note
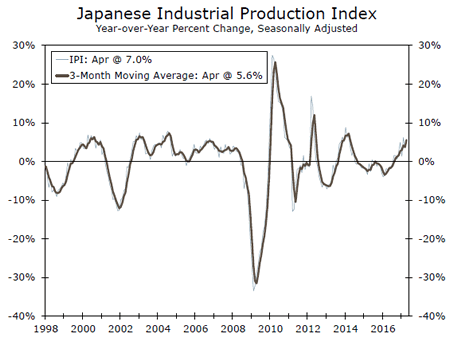
Data released last month showed that real GDP in Japan grew at an annualized rate of 2.2 percent on a sequential basis in the first quarter, and more recent data indicate that economic momentum remains positive thus far in the second quarter. For example, industrial production (IP) in Japan jumped 4.0 percent in April relative to the previous month, more than reversing the 1.9 percent contraction that occurred in March. Retail sales rose 1.4 percent in April to bring the year-over-year growth rate in retail spending to 3.2 percent, the strongest rate in nearly two years. However, inflationary pressures remain benign with the overall rate of CPI inflation clocking in at only 0.4 percent in April. Consequently, the Bank of Japan likely will maintain its Quantitative and Qualitative Easing (QQE) program for the foreseeable future.
Global Outlook
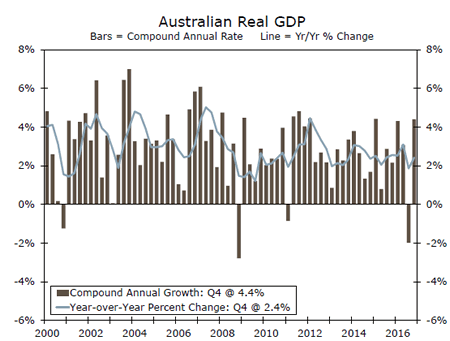
Australian GDP • Tuesday
On Tuesday of next week, Australia will release data for Q1 GDP. In Q4 2016, Australian GDP growth bounced back, expanding at an annualized pace of 4.4 percent. Both consumer and business spending contributed to the increase with a smaller boost from net exports. The consensus forecast looks for positive growth to continue in Q1, albeit at not quite the same pace.
After firming in the second half of 2016, the Reserve Bank of Australia's commodity index has turned down more recently falling 3.4 percent between February and April. We are, however, encouraged by the improvement in job prospects for Australia and after back-to-back monthly declines in retail sales earlier this year, the better jobs figures could provide a needed lift to consumer spending. Business spending has been a drag on growth nine out of the past 11 quarters in Australia, but as business confidence climbs, this trend may turn.
Previous: 1.1%
Consensus: 0.5% (Quarter-over-Quarter)
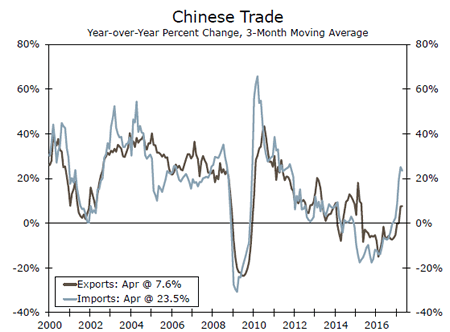
China Trade • Wednesday
China is set to release trade figures for the month of May this upcoming Wednesday. Both imports and exports have surged recently, rising 11.9 percent and 8.0 percent in April from a year-ago, respectively. The recent resurgence of trade values has reversed the slowing growth trend that has characterized Chinese trade since 2010. The recent revival in imports and exports is perhaps a signal that global demand is firming—a notion that is confirmed by global export figures as well.
Chinese GDP grew 6.9 percent in Q1 2017 with notable growth in the secondary industry, which includes mining/quarrying, manufacturing, construction and utilities production. Much of these sectors are integral to the export industry. China's manufacturing PMI remains in expansionary territory, another signal that Chinese exports may have room to run.
Previous: Imports: 11.9%; Exports: 8.0% (Year-over-Year)
Consensus: Imports: 9.0%; Exports: 7.0%
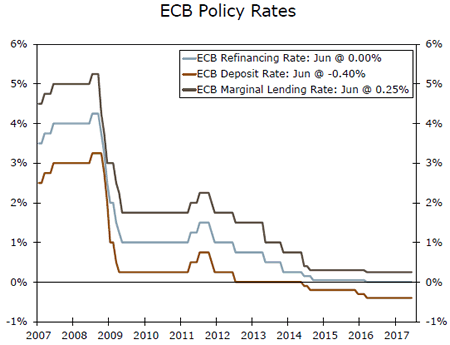
ECB Meeting • Thursday
The European Central Bank (ECB) holds a regularly scheduled policy meeting on Thursday, and it is unlikely that the Governing Council will change its three main policy rates.
In our view, the ECB will continue to buy €60 billion worth of bonds each month for the next few months. However, our expectation is that at some point this summer, the Governing Council could announce plans to "taper" its bond purchases further if the economic outlooks remains upbeat and/or inflation continues to trend higher. Against the backdrop of the Federal Reserve, which is expected to hike rates two more times this year, and the ECB, which is likely to remain on hold, our currency strategy team looks for the euro to depreciate modestly against the dollar in coming months.
Previous: 0.00% Wells Fargo: 0.00%
Consensus: 0.00% (Refi Rate)
Point of View
Interest Rate Watch
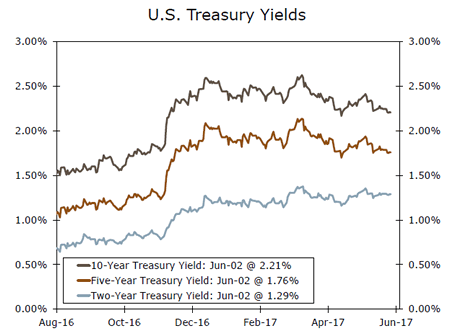
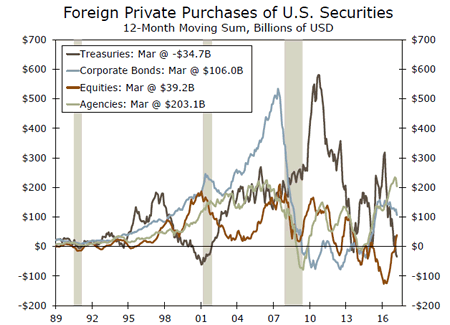
Politics, The Fed and Foreign Capital
No one factor drives Treasury yields, as has been amply demonstrated in recent months (top graph) by the influence of expectations for the economy, politics, the Fed and foreign investors.
Politics and the Fed
During Q4 2016, Treasury yields rose as expectations for expansionary economic policy increased, as did the anticipation of a FOMC increase in the funds rate in December. Yet, after the initial jump, rates have moved sideways, although they remain above the levels that existed before the election. The premium attached to economic policy appears to have drifted out of the Treasury market while expectations for further FOMC policy actions remain.
Foreign Interests
Meanwhile, the extent of foreign interest in U.S. fixed income and equity assets has shown some interesting patterns. Since the start of 2015, foreign private purchases of corporate and agency debt have risen and remain higher than their pace of purchases during the 2014 and early 2015 period.
In contrast, the strong interest in U.S. Treasury debt evidenced in early 2015 has diminished dramatically over the past year. One twist is the recovery and now net increase in equity purchases since early 2015. These gains, along with the drop in Treasury purchases, intimate that foreign investors have a little more confidence in U.S. economic growth as well as at least a small residual expectation for stimulative fiscal policy and deregulation.
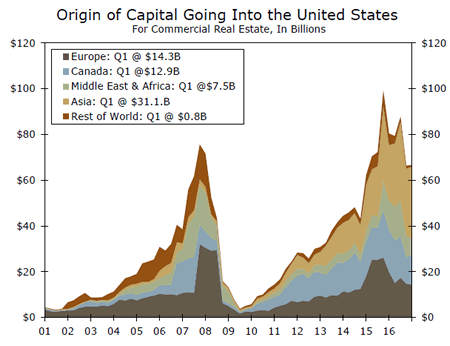
Commercial Real Estate Recovery
As for real investment, the recovery since early 2015 in foreign interest in real tangible property is significant (bottom graph).
In addition, the distribution of the investments highlights the rising contributions from Canada and China. In both cases, the rise in real estate investment tracks the increase in trade of goods and services over the same period. In addition, the spike in investment at the end of 2015 and continued inflows in 2016 would be consistent with some level of expectations of better economic growth.
Credit Market Insights
Auto Credit Tight as Demand Wanes
Recently released data from the Federal Reserve provide insight into current trends in auto lending. The auto industry is likely coming down from a post-crisis high that peaked in 2016, and lenders are reacting accordingly. According to the Senior Loan Officer Opinion Survey (SLOOS) conducted by the Federal Reserve, more lenders were tightening auto lending standards in April than were easing. At the same time, fewer reported stronger demand for auto loans for the second consecutive quarter. Loan officers had been tightening standards since last July. From the perspective of loan officers, it appears both demand and credit for car loans are drying up.
The Federal Reserve Bank of New York's Quarterly Report on Household Debt and Credit for Q1 2017 shows a slowing trend in auto lending debt growth, but it remains the fastest-growing category. Much of the slowdown can be attributed to declining auto loan origination for consumers with a credit rating lower than 660. Using data provided by Equifax, NY Fed data show an accelerating trend in auto loan origination for consumers with better credit scores.
These data also detail existing auto loan performance. The 90+ day delinquency rate for auto loans has trended up slightly over the past year, increasing 0.3 points to 3.8 percent in Q1 2017. The trend has been very gradual, however, and the rate is quite low relative to student loans (11 percent) and credit cards (7.5 percent).
Topic of the Week
Cell Signal Clouds Inflation Outlook
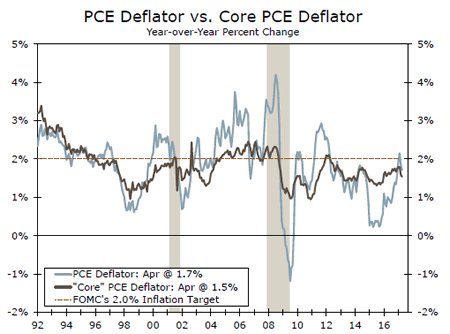
Inflation has stumbled in recent months after making steady progress over the past year toward the Fed's 2 percent inflation target (top chart). What does this mean for the economic and interest rate outlook?
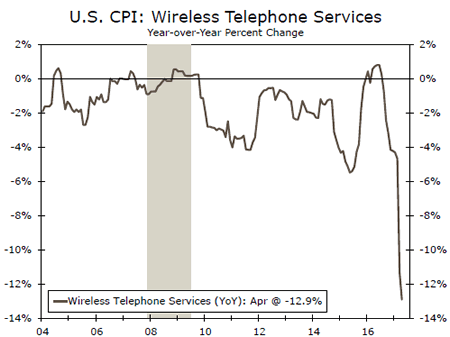
In some ways, the pause in inflation is due to transitory factors. Key among them was the sharp drop in wireless telephone service prices as a result of cutthroat competition among the major service providers (bottom chart). Prices for used autos have also slumped amid the slowdown in new auto sales that has occurred to start this year. Furthermore, the base effects from low energy prices have begun to wane, limiting the boost to headline inflation from the recovery in oil prices.
Beyond these factors, however, other sectors have also seen a deceleration in prices, suggesting a more broad-based moderation in core inflation. Medical care and shelter inflation, two big components of core inflation and key drivers of overall price increases, have both eased recently. In addition, market-based measures of inflation expectations have continued to slip from their post-election peak, while survey-based measures are languishing at historically low levels.
From a monetary policy perspective, the Fed still seems committed to raising the fed funds rate at its June meeting. The minutes from the May meeting signaled that participants believed the Q1 slowdown in economic growth "reflected transitory factors" while the risks to inflation were "roughly balanced."
In our view, faster economic growth and continued tightening in the labor market should spur a gradual increase in core inflation. This should be enough to support rate hikes in June and September and the beginning of balance sheet normalization come year-end. Still, in the wake of the election, some market participants thought the Fed might shed its slow approach to tightening policy. Thus far, it seems 2017 will be more of the same: two percent growth, gradually rising inflation and a cautious Fed.