Sample Category Title
EUR/USD Mid-Day Outlook
Daily Pivots: (S1) 1.1185; (P) 1.1218 (R1) 1.1242; More....
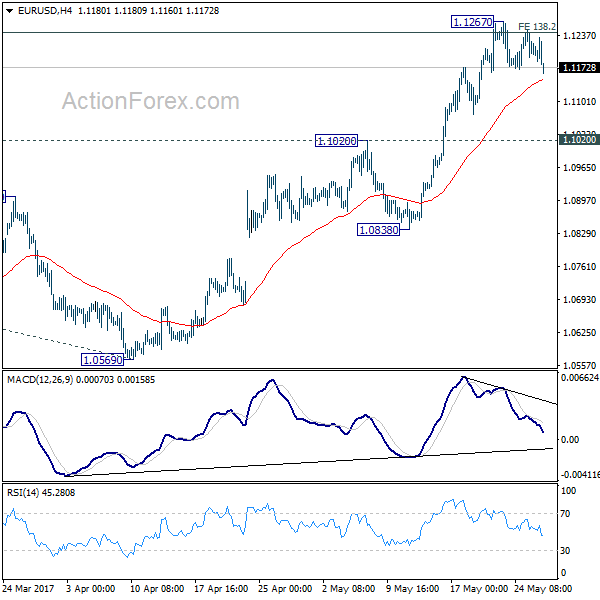
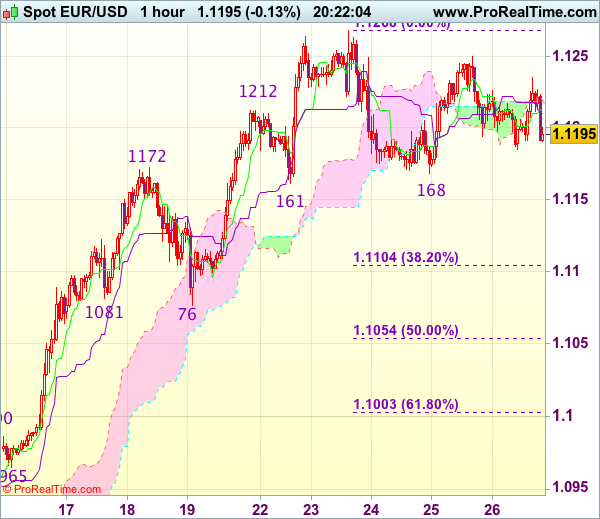
EUR/USD dips again today but it's so far seen as staying in consolidation pattern from 1.1267. Intraday bias remains neutral at this point. We'd stay cautious on strong resistance from 1.1245/98 (138.2% projection of 1.0339 to 1.0828 from 1.0569 at 1.1245) resistance zone to limit upside and bring reversal. But decisive break of 1.1298 will carry larger bullish implication and target 1.1615 resistance next. On the downside, though, break of 1.1020 resistance turned support will indicate rejection from 1.1245/98 and turn bias to the downside for 1.0838 support first.
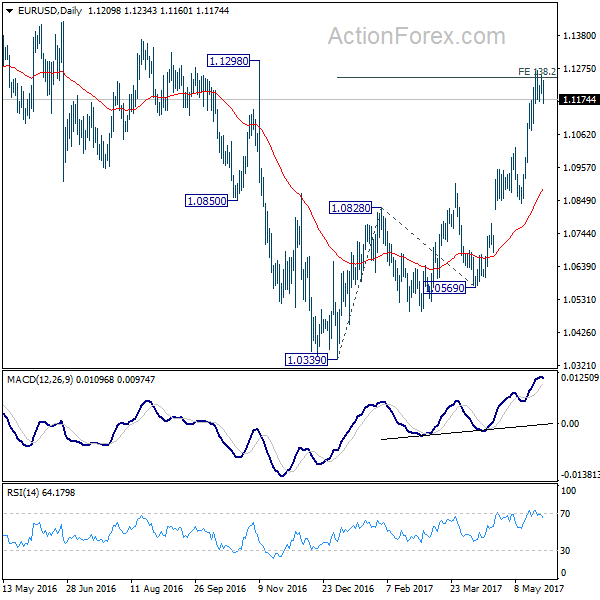
In the bigger picture, the case for medium term reversal continues to build up with EUR/USD now far above 55 week EMA. Also, bullish convergence condition is seen in weekly MACD. Focus will now be on 1.1298 key resistance. Rejection from there will maintain medium term bearishness and would extend the whole down trend from 1.6039 (2008 high). However, firm break of 1.1298 will indicate reversal. In such case, further rally would be seen back to 1.2042 support turned resistance next.
GBP/USD Mid-Day Outlook
Daily Pivots: (S1) 1.2934; (P) 1.2967; (R1) 1.3007; More...
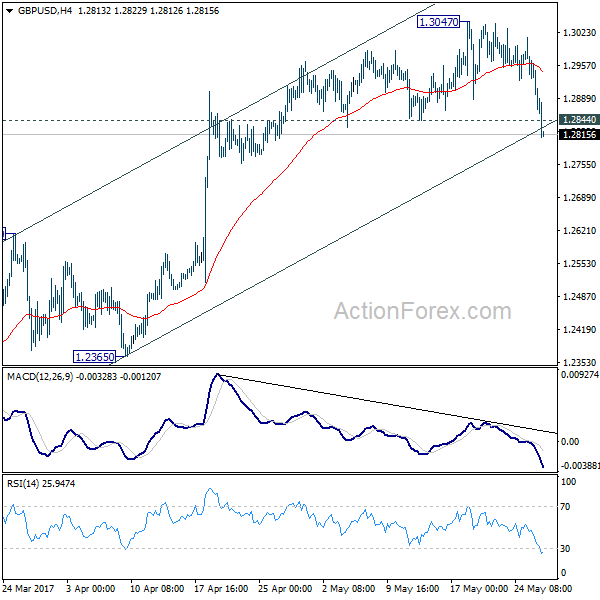
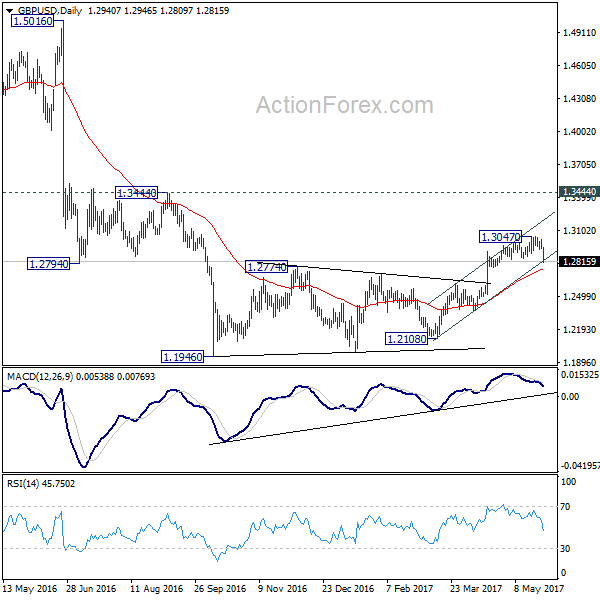
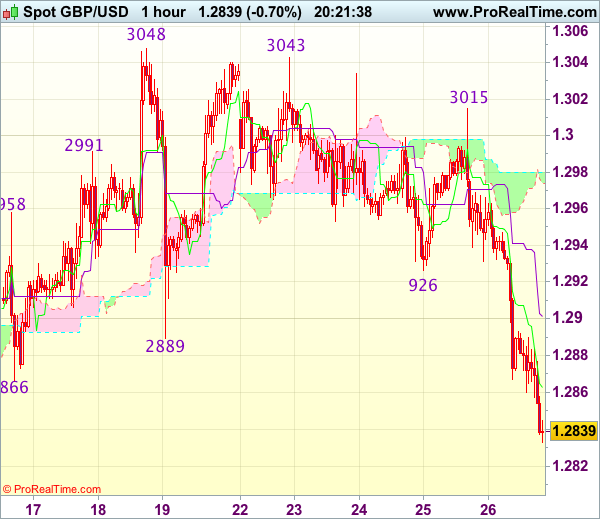
GBP/USD's fall from 1.3047 accelerates to as low as 1.2809 and broke 1.2844 support. The development, and the break of near term channel support, suggest reversal in the pair. That is, the rise from 1.2108 could be finished at 1.3047 already. Intraday bias is turned back to the downside for 1.2614 resistance turned support. Also, noted again that we are still viewing price actions from 1.1946 as a corrective move. Break of 1.2614 will indicate that such correction is finished too and the larger downtrend is is resuming for new low below 1.1946. This will be the mildly preferred case now as long as 1.3047 resistance holds.
In the bigger picture, fall from 1.7190 is seen as part of the down trend from 2.1161. There are signs of reversal, like breaking of 55 week EMA, weekly MACD turned positive, and monthly MACD crossed above signal line. But still, break of 1.3444 resistance is need to confirm medium term bottoming. Otherwise, outlook will remains bearish for extend the down trend through 1.1946 low.
Pound in Free Fall on Election Jitters
The free fall in the Pound is seen as a result of heightened uncertainty over the election in June. Latest YouGov poll published late on Thursday showed that 43% voters plan to vote for Prime Minister Theresa May's Conservative Party. That compares to the support for Labour Party at 38%. That is, just a mere 5% lead. Back in April when May announced the snap election, it's believed that the Conservative would have a landslide victory due to the over 20 point lead. A less than strong victory will weaken May's stance in Brexit negotiation with EU.
Trump agrees that Brexit is an incident, not a trend
European Council president Donald Tusk said that he has convinced US President Donald Trump that Brexit is a very important and dramatic "incident" but "not a trend". And hailed that as a "very positive momentum in our discussion. European Commission president Jean-Claude Juncker said regarding conversion on Brexit with Trump that "this in our eyes is a real tragedy, that it is not in the interest of either of the British nor the continental and Irish Europeans." Meanwhile, it's reported, quoting unnamed source, that Trump has expressed his concerns to EU leaders that Americans may lose job due to Brexit.
Dollar mixed after mixed data
Dollar trades mixed in early US session after mixed economic data. Q1 GDP growth was revised up to 1.2% annualized, beating expectation of 0.9% and was much better than first estimate of 0.7%. GDP price index was revised lower to 2.2%. Headline durable goods orders dropped -0.7% in April, better than expectation of -1.5%. However, ex-transport orders dropped -0.4%, much worse than consensus of 0.4%.
Technically, EUR/USD dips mildly and is set to extend the consolidation from 1.1267 with another fall. We'll stay cautious on rejection from 1.1298 key resistance but there is no firm sign of near term reversal yet. GBP/USD, however, breaks through 1.2844 near term support today, on broad based weakness in Sterling. This is seen as a sign of near term trend reversal.
Meanwhile, USD/JPY recovers mildly ahead of 110.85 support but stays vulnerable to another fall. AUD/USD also recovery mildly ahead of 0.7405 resistance. USD/CAD continues to gyrate in tight range above 1.3387. The direction in the greenback is not clear.
GBP/USD Mid-Day Outlook
Daily Pivots: (S1) 1.2934; (P) 1.2967; (R1) 1.3007; More...
GBP/USD's fall from 1.3047 accelerates to as low as 1.2809 and broke 1.2844 support. The development, and the break of near term channel support, suggest reversal in the pair. That is, the rise from 1.2108 could be finished at 1.3047 already. Intraday bias is turned back to the downside for 1.2614 resistance turned support. Also, noted again that we are still viewing price actions from 1.1946 as a corrective move. Break of 1.2614 will indicate that such correction is finished too and the larger downtrend is is resuming for new low below 1.1946. This will be the mildly preferred case now as long as 1.3047 resistance holds.
In the bigger picture, fall from 1.7190 is seen as part of the down trend from 2.1161. There are signs of reversal, like breaking of 55 week EMA, weekly MACD turned positive, and monthly MACD crossed above signal line. But still, break of 1.3444 resistance is need to confirm medium term bottoming. Otherwise, outlook will remains bearish for extend the down trend through 1.1946 low.
Economic Indicators Update
| GMT | Ccy | Events | Actual | Forecast | Previous | Revised |
|---|---|---|---|---|---|---|
| 23:30 | JPY | National CPI Core Y/Y Apr | 0.30% | 0.40% | 0.20% | |
| 23:30 | JPY | Tokyo CPI Core Y/Y May | 0.10% | 0.00% | -0.10% | |
| 23:50 | JPY | Corporate Service Price Y/Y Apr | 0.70% | 0.90% | 0.80% | |
| 12:30 | USD | GDP (Annualized) Q1 S | 1.20% | 0.90% | 0.70% | |
| 12:30 | USD | GDP Price Index Q1 S | 2.20% | 2.30% | 2.30% | |
| 12:30 | USD | Durable Goods Orders Apr P | -0.70% | -1.50% | 0.90% | |
| 12:30 | USD | Durables Ex Transportation Apr P | -0.40% | 0.40% | 0.00% | |
| 14:00 | USD | U. of Michigan Confidence May F | 97.5 | 97.7 |
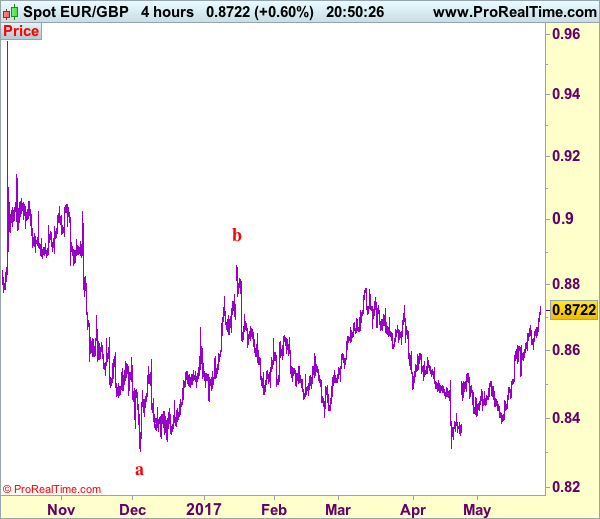
Trade Idea: EUR/GBP – Buy at 0.8620
EUR/GBP - 0.8725
Recent wave: Major double three (A)-(B)-(C)-(X)-(A)-(B)-(C) is unfolding and 2nd (A) has possibly ended at 0.6936.
Trend: Near term up
Original strategy :
Buy at 0.8575, Target: 0.8675, Stop: 0.8535
Position : -
Target : -
Stop : -
New strategy :
Buy at 0.8620, Target: 0.8750, Stop: 0.8580
Position : -
Target : -
Stop : -
As the single currency has surged again after brief pullback, adding credence to our bullish view that the rise from 0.8312 low is still in progress and above resistance at 0.8735 would encourage for further gain to 0.8765-70 but near term overbought condition should limit upside today and price should falter below resistance at 0.8788, risk from there is seen for a retreat later.
In view of this, would not chase this rise here and would be prudent to buy euro again on pullback as 0.8615-20 should limit downside. A firm break below support at 0.8603 would abort and suggest a temporary top is formed instead, risk correction to 0.8575-80 and possibly towards 0.8550 but support at 0.8524 should remain intact.
Our preferred count is that, after forming a major top at 0.9805 (wave V), (A)-(B)-(C) correction is unfolding with (A) leg ended at 0.8400 (A: 0.8637, B: 0.9491 and 5-waver C ended at 0.8400. Wave (B) has ended at 0.9413 and impulsive wave (C) has either ended at 0.8067 or may extend one more fall to 0.8000 before prospect of another rally. Current breach of indicated resistance at 0.9043 confirms our view that the (C) leg has ended and bring stronger rebound towards 0.9150/54, then towards 0.9240/50.
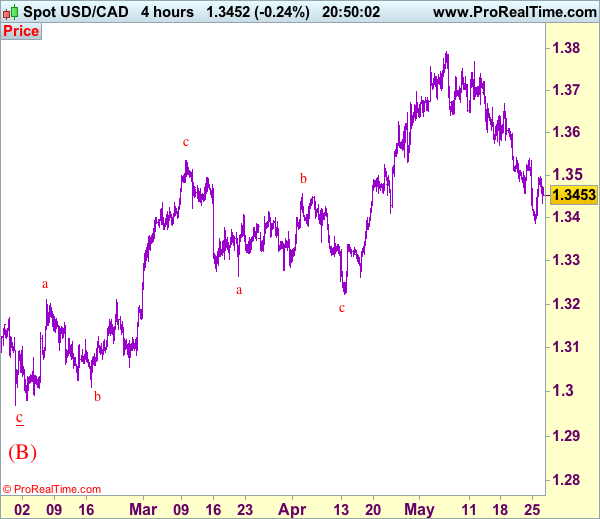
Trade Idea: USD/CAD – Sell at 1.3540
USD/CAD - 1.3454
Recent wave: Only wave v of c has ended at 0.9407 and wave C of major A-B-C correction is underway for headway to 1.4700
Trend: Near term up
Original strategy :
Sell at 1.3540, Target: 1.3340, Stop: 1.3600
Position: -
Target: -
Stop: -
New strategy :
Sell at 1.3540, Target: 1.3340, Stop: 1.3600
Position: -
Target: -
Stop:-
As the greenback has rebounded after falling to 1.3387, suggesting consolidation above this level would be seen and corrective bounce to 1.3500 cannot be ruled out, however, reckon upside would be limited to resistance at 1.3540 and bring another decline, below said support at 1.3387 would extend the fall from 1.3794 top for further weakness to 1.3350, then towards 1.3300 but loss of near term downward momentum should prevent sharp fall below 1.3250-60, risk from there has increased for a rebound to take place later.
In view of this, would not chase this fall here and we are looking to sell on recovery as 1.3540 resistance should limit upside, bring another decline. Above 1.3571-79 (previous support and 50% Fibonacci retracement of 1.3770-1.3387) would defer and suggest a temporary low is formed instead, risk a stronger rebound to 1.3600 but still reckon resistance at 1.3670 would remain intact.
To recap, wave B from 1.3066 is unfolding as an a-b-c and is sub-divided as a: 1.2192, b: 1.2716 and wave c is a 5-waver with i: 1.1983, ii: 1.2506, extended wave iii with minor iii at 1.0206, wave iv ended at 1.0781 and wave v as well as wave iii has ended at 0.9931, hence the subsequent choppy trading is the wave iv which is unfolding as (a)-(b)-(c) with (a) leg of iv ended at 1.0854, followed by (b) leg at 1.0108 and (c) leg as well as the wave iv ended at 1.0674. The wave v is sub-divided by minor wave (i): 0.9980, (ii): 1.0374, (iii): 0.9446, (iv): 0.9913 and (v) as well as v has possibly ended at 0.9407, therefore, consolidation with upside bias is seen for major correction, indicated target at 1.3700 and 1.4000 had been met and further gain to 1.4700 would be seen later.
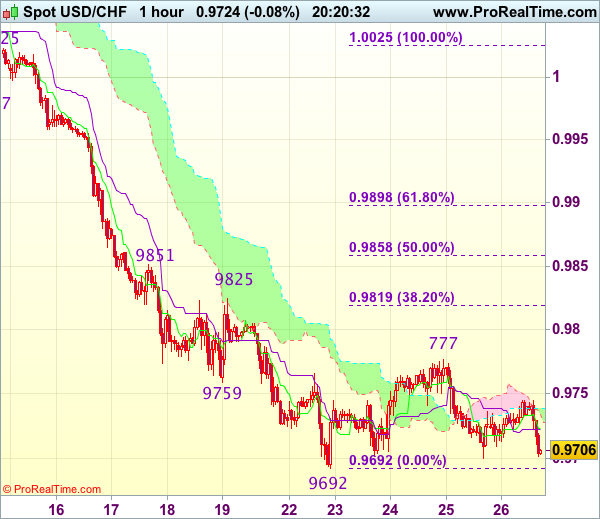
Trade Idea Update: USD/CHF – Hold long entered at 0.9700
USD/CHF - 0.9705
Original strategy :
Bought at 0.9700, Target: 0.9800, Stop: 0.9700
Position : - Long at 0.9700
Target : - 0.9800
Stop : - 0.9700
New strategy :
Hold long entered at 0.9700, Target: 0.9800, Stop: 0.9690
Position : - Long at 0.9700
Target : - 0.9800
Stop : - 0.9690
The greenback met resistance at 0.9777 and has retreated, suggesting caution on our long position entered at 0.9700 but as long as support at 0.9692 holds, further consolidation would be seen with mild upside bias for another rebound, above said resistance at 0.9777 would add credence to our view that temporary low is formed, bring retracement of recent decline to 0.9800, then 0.9819-25 (38.2% Fibonacci retracement of 1.0025-0.9692 and previous resistance) but price should falter below resistance at 0.9851 (also just below 50% Fibonacci retracement at 0.9858), bring another decline later.
In view of this, we are holding on to our long position entered at 0.9700. Below said support at 0.9692 would signal recent decline has resumed and extend weakness to 0.9670-75 but reckon downside would be limited to 0.9650 and 0.9620-25 should hold, bring another rebound later.
Trade Idea : GBP/USD – Sell at 1.2910
GBP/USD - 1.2845
New strategy :
Sell at 1.2910, Target: 1.2810, Stop: 1.2945
Position : -
Target : -
Stop : -
Sterling ran into heavy selling pressure at 1.3015 yesterday and has dropped sharply, price just broke below 1.2866 support earlier today, suggesting top has indeed been formed at 1.3048 earlier and downside bias is seen for this the erratic decline from there to extend weakness to previous support at 1.2831, then 1.2805 however, near term oversold condition should prevent sharp fall below 1.2780-85 (50% Fibonacci retracement of 1.2515-1.3048) and reckon previous support at 1.2757 would hold from here.
In view of this, would not chase this fall here and would be prudent to sell cable on recovery as previous support at 1.2926 should turn into resistance and cap upside. Above this level would defer and suggest an intra-day low is formed instead, bring a stronger rebound to 1.2950 but upside should be limited to 1.2990-00.
Trade Idea Update: EUR/USD – Stand aside
EUR/USD - 1.1191
New strategy :
Stand aside
Position : -
Target : -
Stop : -
Although the single currency retreated after meeting resistance at 1.1250 yesterday, as euro found support at 1.1185 and has rebounded, suggesting consolidation with mild upside bias would be seen today, however, a break of said resistance is needed to retain bullishness and signal pullback from 1.1268 has ended, bring retest of this level, once this resistance is penetrated, this would signal recent upmove has resumed and extend gain to 1.1280-85 (61.8% projection of 1.0839-1.1172 measuring from 1.1076) and possibly towards 1.1300-10.
On the downside, below 1.1180 would bring another corrective fall to 1.1161-68 support but break there is needed to signal top has been formed at 1.1268, bring retracement of recent upmove to 1.1130 but reckon downside would be limited to 1.1100-05 (38.2% Fibonacci retracement of 1.0839-1.1268) and price should stay well above support at 1.1076, bring rebound later.
Trade Idea Update: USD/JPY – Stand aside
USD/JPY - 111.10
Original strategy :
Bought at 111.50, stopped at 111.15
Position : - Long at 111.50
Target : -
Stop : - 111.15
New strategy :
Stand aside
Position : -
Target : -
Stop : -
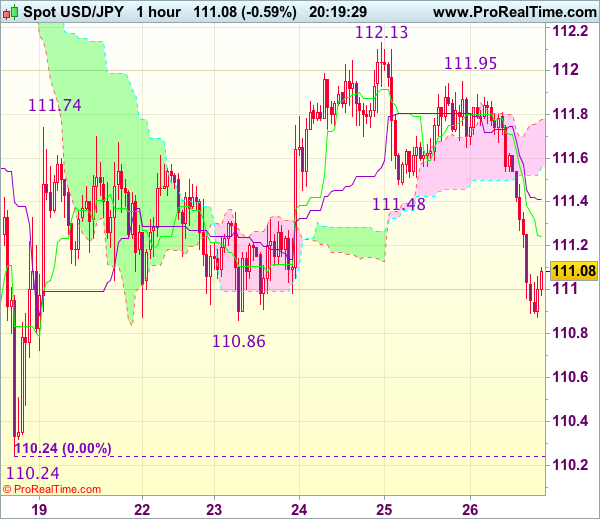
Dollar’s selloff after meeting renewed selling interest at 111.95 (yesterday’s high) suggests top has been formed at 112.13 and bearishness remains for test of 110.86 support, however, a sustained breach below this level is needed to signal the rebound from 110.24 has ended at 112.13, bring further fall to 110.50-55, then retest of 110.24 probably next week.
In view of this, would not chase this fall here and would be prudent to stand aside in the meantime. Above the Tenkan-Sen (now at 111.25) would bring test of the Kijun-Sen (now at 111.41) but reckon upside would be limited to 111.75-80 and said resistance at 111.95 should remain intact.
USDJPY: Sells Off On Bear Pressure
USDJPY: The pair remains vulnerable to the downside on correction as it sold off during Friday trading today. On the downside, support comes in at the 110.50 level where a break if seen will aim at the 110.00 level. A cut through here will turn focus to the 109.50 level and possibly lower towards the 109.00 level. On the upside, resistance resides at the 111.50 level. Further out, we envisage a possible move towards the 112.00 level. Further out, resistance resides at the 112.50 level with a turn above here aiming at the 113.00 level. On the whole, USDJPY looks vulnerable on more weakness.