Sample Category Title
USD/CAD Mid-Day Outlook
Daily Pivots: (S1) 1.3469; (P) 1.3497; (R1) 1.3538; More....
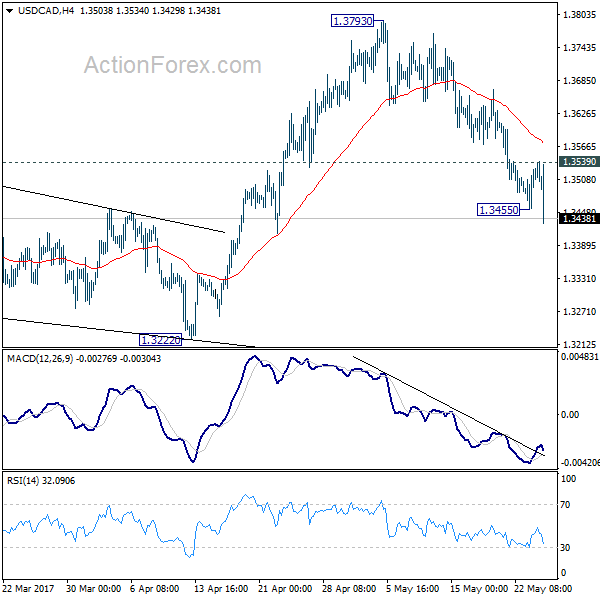
USD/CAD's break of 1.3455 indicates resumption of decline from 1.3793. Intraday bias is turned back to the downside for 1.3222 support next. As noted before, corrective rally from 1.2460 could have finished ahead of 1.3838 fibonacci level. Break of 1.3222 will affirm this case and target 1.2968 key support level for confirmation On the upside, above 1.3539 minor resistance will turn bias neutral and bring another recovery first.
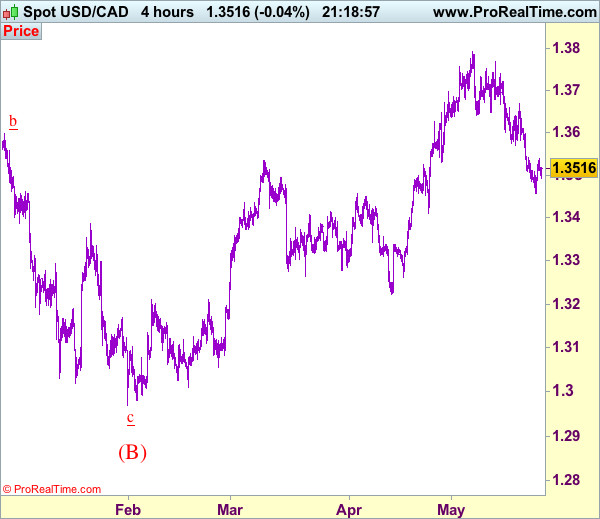
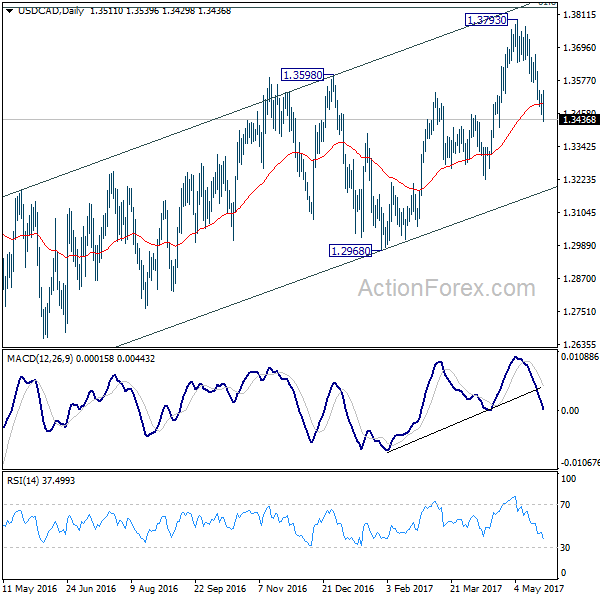
In the bigger picture, price actions from 1.4689 medium term top are seen as a correction pattern. The first leg has completed at 1.2460. Rise from 1.2460 is seen as the second leg and would end at around 61.8% retracement of 1.4689 to 1.2460 at 1.3838. Break of 1.3222 should indicate the start of the third leg while further break of 1.2968 should confirm. Nonetheless, sustained trading above 1.3838 would pave the way to retest 1.4689 high.
Trade Idea Wrap-up: USD/CHF – Hold long entered at 0.9700
USD/CHF - 0.9757
Most recent candlesticks pattern : N/A
Trend : Near term down
Tenkan-Sen level : 0.9756
Kijun-Sen level : 0.9740
Ichimoku cloud top : 0.9740
Ichimoku cloud bottom : 0.9721
Original strategy :
Bought at 0.9700, Target: 0.9800, Stop: 0.9700
Position : - Long at 0.9700
Target : - 0.9800
Stop : - 0.9700
New strategy :
Hold long entered at 0.9700, Target: 0.9800, Stop: 0.9700
Position : - Long at 0.9700
Target : - 0.9800
Stop : - 0.9700
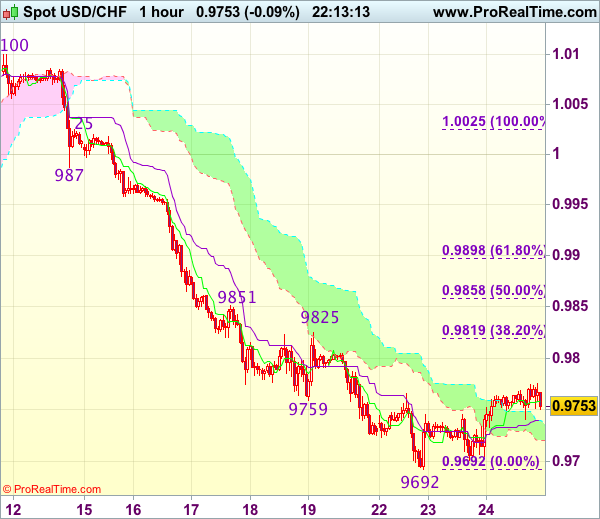
As the greenback has rebounded after holding above this week’s low at 0.9692, retaining our view that further consolidation above this level would be seen and mild upside bias remains for another rebound to 0.9790-00, however, break of resistance at 0.9825 is needed to low is formed, bring retracement of recent decline to previous resistance at 0.9851 which is likely to hold from here.
In view of this, we are holding on to our long position entered at 0.9700. Below said support at 0.9692 would signal recent decline has resumed and extend weakness to 0.9670-75 but reckon downside would be limited to 0.9650 and 0.9620-25 should hold, bring another rebound later.
Trade Idea Wrap-up: GBP/USD – Stand aside
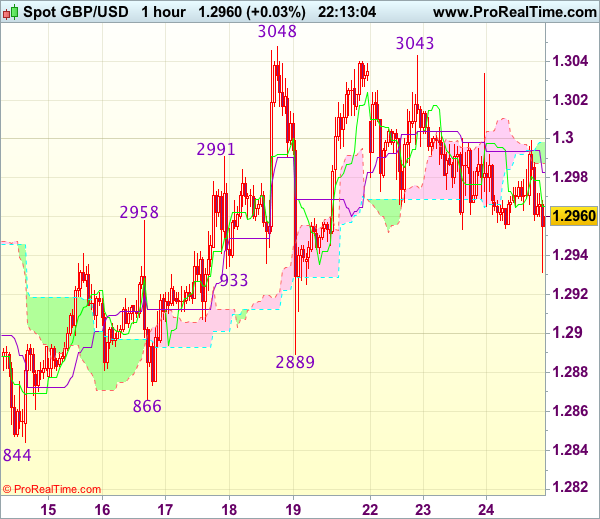
GBP/USD - 1.2957
Most recent candlesticks pattern : N/A
Trend : Near term up
Tenkan-Sen level : 1.2965
Kijun-Sen level : 1.2983
Ichimoku cloud top : 1.2998
Ichimoku cloud bottom : 1.2987
New strategy :
Stand aside
Position : -
Target : -
Stop : -
Cable’s retreat after faltering below indicated resistance at 1.3048 (last week’s high) has retained our view that further choppy trading below this level would be seen and pullback to 1.2930 cannot be ruled out, however, reckon downside would be limited to 1.2900 and said support at 1.2889 should remain intact, bring another rebound later.
On the upside, although recovery to 1.3000-10 cannot be ruled out, reckon said resistance at 1.3048 would hold, bring further consolidation. Only a break of said resistance at 1.3048 would confirm recent upmove has resumed an extend further gain to 1.3075-80 and possibly towards 1.3100-10 later. As near term outlook is mixed, would be prudent to stand aside in the meantime.
Trade Idea Wrap-up: EUR/USD – Stand aside
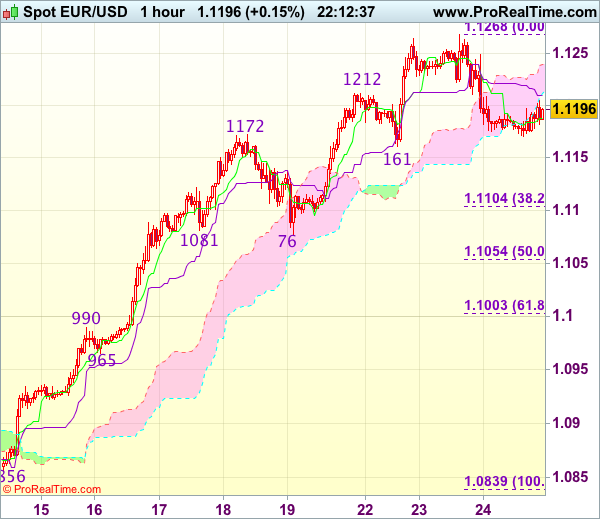
EUR/USD - 1.1197
Most recent candlesticks pattern : N/A
Trend : Up
Tenkan-Sen level : 1.1188
Kijun-Sen level : 1.1210
Ichimoku cloud top : 1.1240
Ichimoku cloud bottom : 1.1212
New strategy :
Stand aside
Position : -
Target : -
Stop : -
Despite yesterday’s marginal rise to 1.1268, the subsequent retreat suggests a temporary top is possibly formed and test of support at 1.1161 cannot be ruled out, however, break there is needed to add credence to this view, bring further fall to 1.1130 but reckon downside would be limited to 1.1100-05 (38.2% Fibonacci retracement of 1.0839-1.1268) and price should stay well above support at 1.1076, bring rebound later.
On the upside, whilst recovery to 1.1200 cannot be ruled out, reckon the Kijun-Sen (now at 1.1220) would limit upside and 1.1250 should hold, bring retreat later. Only break of said resistance at 1.1268 would extend recent upmove to extend further gain to 1.1280-85 (61.8% projection of 1.0839-1.1172 measuring from 1.1076) and possibly towards 1.1300-10.
Yen Drifting as Markets Look for Rate Clues from Fed Minutes
USD/JPY continues to show little movement this week, as the pair drifts in the Wednesday session. In North American trade, the pair is trading at the 112 level. On the release front, US Existing Home Sales dropped sharply to 5.57 million, short of the forecast of 5.65 million. Later on, the Federal Reserve will release the minutes of its May policy meeting. On Thursday, the US releases unemployment claims and Japan will release Tokyo Core CPI, a key inflation indicator.
Is the US housing sector in trouble? On Wednesday, Existing Home Sales fell to 5.57 million in April, compared to 5.71 million in the March estimate. This report comes on the heels of New Home Sales, which dropped to 569 thousand, well short of the forecast of 611 thousand. To be fair, the March readings for both indicators was very high, so the April numbers could just be a blip. However, if upcoming housing reports miss expectations, concerns will grow about the health of the US economy.
Since the Federal Reserve raised rates back in March, there has been plenty of speculation as to the timing of another rate hike. The markets are expecting the Fed to press the rate trigger at the June policy meeting. The odds of a rate hike have increased to 83%, according to the CME Group. Just last week, the likelihood of a rate increase stood at 73%. Despite the market speculation, Fed policymakers are keeping their cards close to their chest, at least in their public appearances. On Tuesday, Philadelphia Fed President Patrick Harker said that a June move was a "distinct possibility", but cautioned that a weak inflation report could delay a rate hike. Earlier in the week, Robert Kaplan, President of the Dallas Fed, stated that three interest increases in 2017 was "appropriate". The Fed minutes are expected to underscore support for a June move, but may not shed much light on what happens after that. Still any clues about the Fed's rate plans could shake up the listless USD/JPY.
With President Trump still overseas on his first presidential trip, the White House presented Trump's 21018 budget proposal to Congress on Tuesday. Trump has promised to slash government spending, and the budget proposes major cuts to the Medicaid health program, disability benefits and food stamps. Trump has outlined an ambitious program to cut government spending by $3.6 trillion in the next 10 years and achieving a balanced budget by 2020. The budget also includes $25 billion for paid leave after childbirth and some $200 billion for infrastructure programs. It's a safe bet that Trump's budget will face tough opposition on Capitol Hill, with both Democrats and Republicans unlikely to go along with such deep cuts to social assistance programs. Still, with the Trump administration beset by Congressional investigations, the White House can point to the budget as a step forward in his agenda to cut government spending.
Trade Idea Wrap-up: USD/JPY – Sell at 112.40 or buy at 111.50
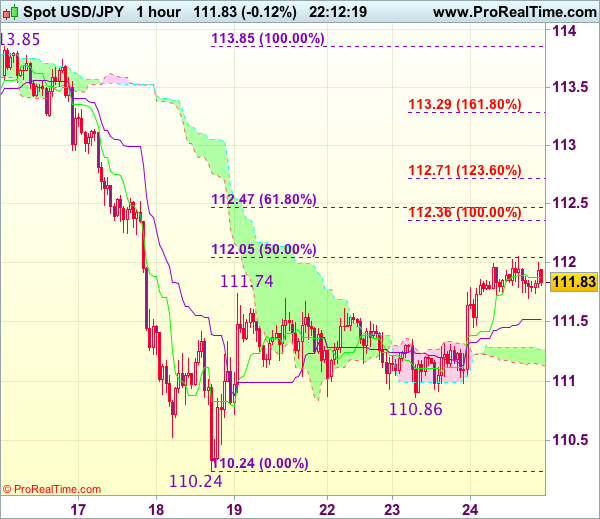
USD/JPY - 111.88
Most recent candlesticks pattern : N/A
Trend : Near term down
Tenkan-Sen level : 111.88
Kijun-Sen level : 111.52
Ichimoku cloud top : 111.27
Ichimoku cloud bottom : 111.14
Original strategy :
Sell at 112.40, Target: 111.00, Stop: 112.75
O.C.O.
Buy at 111.50, Target: 112.50, Stop: 111.15
Position : -
Target : -
Stop : -
New strategy :
Sell at 112.40, Target: 111.00, Stop: 112.75
O.C.O.
Buy at 111.50, Target: 112.50, Stop: 111.15
Position : -
Target : -
Stop : -
The greenback has rebounded after holding above support at 110.86, suggesting near term upside risk remains for the corrective rise from 110.24 low to extend gain to 112.05 (50% Fibonacci retracement of 113.85-110.24), then 112.36 (100% projection of 110.4-11174 measuring from 110.86) but upside should be limited to 112.45-50 (61.8% Fibonacci retracement) and bring another decline later, below 111.30-35 would bring test of said support at 110.86 but break there is needed to signal the rebound from 110.24 has ended, bring further fall to 110.50 first.
In view of this, whilst we are still looking to sell dollar on further recovery, we would turn long on dips as the Kijun-Sen (now at 111.50) should limit downside and bring another rebound. Above 112.70-75 would abort and signal recent decline has ended, bring further gain to 113.00.
(BOC) Bank of Canada maintains overnight rate target at 1/2 per cent
The Bank of Canada is maintaining its target for the overnight rate at 1/2 per cent. The Bank Rate is correspondingly 3/4 per cent and the deposit rate is 1/4 per cent.
Inflation is broadly in line with the Bank's projection in its April Monetary Policy Report (MPR). Food prices continue to decline, mainly because of intense retail competition, pushing inflation temporarily lower. The Bank's three measures of core inflation remain below two per cent and wage growth is still subdued, consistent with ongoing excess capacity in the economy.
The global economy continues to gain traction and recent developments reinforce the Bank's view that growth will gradually strengthen and broaden over the projection horizon. As anticipated, growth in the United States during the first quarter was weak, reflecting mostly temporary factors. Recent data point to a rebound in the second quarter. The uncertainties outlined in the April MPR continue to cloud the global and Canadian outlooks.
The Canadian economy's adjustment to lower oil prices is largely complete and recent economic data have been encouraging, including indicators of business investment. Consumer spending and the housing sector continue to be robust on the back of an improving labour market, and these are becoming more broadly based across regions. Macroprudential and other policy measures, while contributing to more sustainable debt profiles, have yet to have a substantial cooling effect on housing markets. Meanwhile, export growth remains subdued, as anticipated in the April MPR, in the face of ongoing competitiveness challenges. The Bank's monitoring of the economic data suggests that very strong growth in the first quarter will be followed by some moderation in the second quarter.
All things considered, Governing Council judges that the current degree of monetary stimulus is appropriate at present, and maintains the target for the overnight rate at 1/2 per cent.
Trade Idea: EUR/GBP – Buy at 0.8575
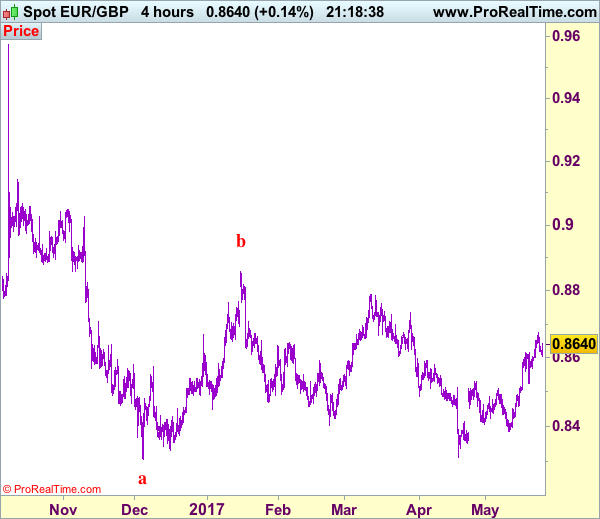
EUR/GBP - 0.8644
Recent wave: Major double three (A)-(B)-(C)-(X)-(A)-(B)-(C) is unfolding and 2nd (A) has possibly ended at 0.6936.
Trend: Near term up
Original strategy :
Buy at 0.8575, Target: 0.8675, Stop: 0.8535
Position : -
Target : -
Stop : -
New strategy :
Buy at 0.8575, Target: 0.8675, Stop: 0.8535
Position : -
Target : -
Stop : -
As the single currency retreated after our anticipated rise to 0.8675, suggesting consolidation below this level would be seen and pullback to 0.8600-05 cannot be ruled out, however, still reckon downside would be limited to 0.8570-75 and bring another rise later, above said resistance at 0.8675 would extend recent rise from 0.8312 low to 0.8700 but loss of upward momentum should prevent sharp move beyond resistance at 0.8735, risk from there is seen for a retreat later.
In view of this, would not chase this rise here and would be prudent to buy euro again on pullback as 0.8575-85 should limit downside. Below 0.8550 would defer and suggest top is possibly formed, bring subsequent test of said support at 0.8524, once this level is penetrated, this would provide confirmation.
Our preferred count is that, after forming a major top at 0.9805 (wave V), (A)-(B)-(C) correction is unfolding with (A) leg ended at 0.8400 (A: 0.8637, B: 0.9491 and 5-waver C ended at 0.8400. Wave (B) has ended at 0.9413 and impulsive wave (C) has either ended at 0.8067 or may extend one more fall to 0.8000 before prospect of another rally. Current breach of indicated resistance at 0.9043 confirms our view that the (C) leg has ended and bring stronger rebound towards 0.9150/54, then towards 0.9240/50.
USD/CAD Tests 1.3500 Support Ahead of BoC, FOMC and OPEC
The Bank of Canada (BoC) will announce its rate decision and monetary policy statement this afternoon at 15:00 BST. Be aware that it will likely cause volatility for CAD and USD crosses. Market consensus is that the BoC will keep rates unchanged at 0.5%.
USD/CAD has seen a substantial 1.7% retracement since May 5th caused by rising oil prices. USD/CAD bulls retreated after testing the significant resistance level at 1.3800.
The downtrend has held above the significant support line at 1.3500 since Tuesday May 23rd helped by the USD rebound after the release of the 2018 US budget plan.
1.3500 is likely to provide a stronger support.
The daily Stochastic Oscillator is below 20 suggesting a rebound.
The resistance level is at 1.3540, followed by 1.3570 and 1.3600.
The support line is at 1.3500, followed by 1.3450 and 1.3400.
Keep an eye on the FOMC Minutes, to be released at 19:00 BST. We will likely get further clues about a June rate hike and updated economic outlook. Be aware that it will likely cause volatility for USD/CAD.
If USD keeps on rallying, we can expect USD/CAD to rebound at this level. Conversely, if USD falls again, it will likely weigh on USD/CAD and test supports.
OPEC meeting will be held tomorrow May 25th in Vienna discussing whether to extend the existing output cut agreement. Market consensus is that OPEC will extend it so be aware that the outcome will likely cause volatility to USD/CAD.
Trade Idea: USD/CAD – Stand aside
USD/CAD - 1.3516
Recent wave: Only wave v of c has ended at 0.9407 and wave C of major A-B-C correction is underway for headway to 1.4700
Trend: Near term up
New strategy :
Stand aside
Position: -
Target: -
Stop:-
Although the greenback recovered after finding support at 1.3456 and consolidation with mild upside bias is seen for gain to 1.3550 but break of previous support at 1.3571 is needed to signal low is formed at 1.3456 and bring a stronger rebound to 1.3610-15, then 1.3635-40, having said that, only break of previous resistance at 1.3670 would signal the fall from 1.3792 has ended.
On the downside, below said support at 1.3456 would signal recent decline from 1.3792 top is still in progress for a stronger retracement of early rise, hence weakness to 1.3411 support cannot be ruled out, however, near term oversold condition should prevent sharp fall below there and reckon 1.3350-60 would hold, bring rebound later.
To recap, wave B from 1.3066 is unfolding as an a-b-c and is sub-divided as a: 1.2192, b: 1.2716 and wave c is a 5-waver with i: 1.1983, ii: 1.2506, extended wave iii with minor iii at 1.0206, wave iv ended at 1.0781 and wave v as well as wave iii has ended at 0.9931, hence the subsequent choppy trading is the wave iv which is unfolding as (a)-(b)-(c) with (a) leg of iv ended at 1.0854, followed by (b) leg at 1.0108 and (c) leg as well as the wave iv ended at 1.0674. The wave v is sub-divided by minor wave (i): 0.9980, (ii): 1.0374, (iii): 0.9446, (iv): 0.9913 and (v) as well as v has possibly ended at 0.9407, therefore, consolidation with upside bias is seen for major correction, indicated target at 1.3700 and 1.4000 had been met and further gain to 1.4700 would be seen later.