
Sample Category Title
Traders Convinced Of June Hike Ahead Of FOMC Minutes
- US futures and USD flat ahead of FOMC minutes;
- Oil climbs ahead of inventory data on anticipation of output extension;
- China downgrade shrugged off by markets.
We're expected a relatively flat open on Wall Street on Wednesday, as traders await the minutes from the FOMC meeting earlier this month having already strongly priced in a rate hike in June, with a second in December looking less certain.
While the dollar's performance in recent months would suggest otherwise, traders have become increasingly convinced that we'll see a rate hike in June, the second this year, but questions are being asked about where the Fed will go from there. A lot of the expectation in the final couple of months of the year came from the expectation that President Donald Trump would announce huge spending and tax reform plans but as of yet, that's not happened.
The result is that the rally in both equity markets and the dollar have stalled, with other currencies making up ground as central banks elsewhere turn a little less dovish. The S&P and the Dow on the other hand have been range bound over the last few months and have failed each time they've tested their highs. While the Dow remains a little off its highs, the S&P appears to be eyeing another test having rebounded convincingly following last Wednesday's tumble.
Brent and WTI crude are both trading in the green once again today and are headed for a sixth consecutive day of gains as we await the latest oil inventory data from EIA and the decision on whether there'll be an extension, and possible increase, to the output cut that came into effect this year. The rally in recent weeks would certainly suggest traders have bought into it already, leaving oil WTI and Brent very vulnerable to the downside should participating members fail to come to an agreement. With Saudi Arabia and Russia appearing on board though, the chance of a deal not materialising seems slim. The bigger question is whether they'll live up to market expectations. Another small reduction in inventories is expected to be reported today, in line with what API reported on Tuesday.
Markets have largely shrugged off Moody's downgrade of China's credit rating overnight, with even Chinese stocks and the yuan being relatively unfazed. We saw some initial weakness in Chinese stocks and the currency immediately following the announcement but both quickly reversed the moves to trade positive on the day. This sentiment has been shared by investors elsewhere who have also shrugged off the downgrade, with the possible surprise factor being offset by the fact that concerns about Chinese debt and growth are not exactly new.
While the FOMC minutes will likely attract the most attention today, we'll also get existing home sales data from the US and hear from a couple of Fed officials, with Robert Kaplan and Neel Kashkari both due to appear for the second time this week.
Trade Idea: GBP/JPY – Stand aside
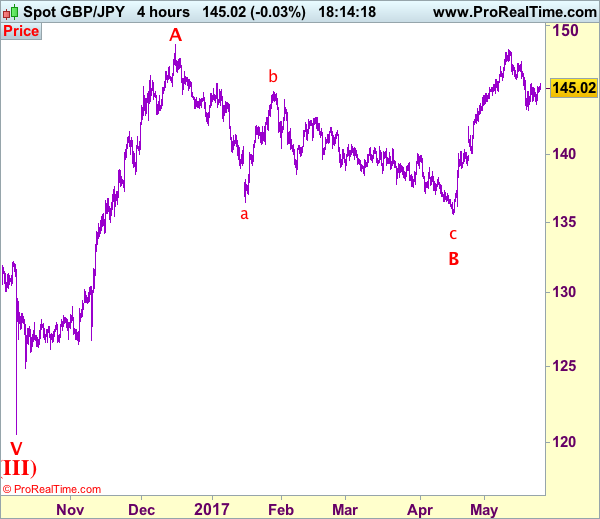
GBP/JPY - 144.93
Recent wave: Medium term low formed at 120.50 and (A)-(B)-(C) major correction has commenced with (A) leg ended at 148.45, hence wave (B) is unfolding for retreat to 131.00-10.
Trend: Near term up
New strategy :
Stand aside
Position: -
Target: -
Stop:-
Sterling found support at 143.80 and has rebounded again, suggesting further consolidation above previous support at 143.40 would be seen and another bounce to 145.35-40 cannot be ruled out, however, break there is needed to bring a stronger retracement of the fall from 148.10 to resistance at 145.90-95, having said that, break there is needed to confirm low has been formed, bring further subsequent gain to 146.30-35 but resistance at 147.10 should remain intact.
On the downs8de, below 144.30 would bring weakness to 144.00 but only break of 143.80 support would revive bearishness, bring retest of 143.40. Only a drop below this level would signal the decline from 148.11 top has resumed for correction of early upmove to 143.00, then 142.30-35 which is likely to hold from here.
Our preferred count is that larger degree wave V with circle is unfolding from 251.12 with wave (I) 219.34, (II): 241.38 and wave (III) is subdivided into 1: 192.60, 2: 215.89 (23 Jul 2008) and wave 3 ended at 118.87 earlier in 2009. The correction from there to 162.60 is wave 4 which itself is a double three and is labeled as first a-b-c ended at 151.53, followed by wave x at 139.03, 2nd a ended at 162.60, 2nd b at 146.75 and 2nd c leg of wave 4 ended at 163.00. Therefore, the decline from 163.00 to 116.85 is now treated as wave 5 which also marked the end of larger degree wave (III), hence wave (IV) major correction has commenced for retracement of the wave (III) from 241.38 and upside target at 183.95-00 (50% Fibonacci retracement of the wave (II) from 241.38) had been met, a drop below 160.00 would suggest wave (IV) has ended at 195.85, bring decline in wave (V) for initial weakness to 130 (already met) and 120.
The Tale Of OPEC And U.S Shale
The growing optimism over big oil-producing countries extending output cuts to mitigate oversupply woes propelled WTI Crude to a fresh monthly high at $51.76 on Wednesday. Although OPEC and Non-OPEC members have, on repeated occasions, exploited oil’s sensitivity to generate speculative boosts in prices, this may come at a heavy cost if oil markets fail to rebalance. While WTI Crude is likely to appreciate higher if OPEC and Non-OPEC producers extend the current output cut deal by another nine months, the question remains of how U.S Shale will react.
I believe that U.S Shale is a significant threat to the OPEC deal, especially when considering how the surging output from the U.S has seizedmarket share from other OPEC members. With the production cut agreement still not legally binding and no punishments in place for those who don’t adhere to its stipulations, there remains a strong temptation for individual countries to cheat in a bid to gain more market share. The bearish sentiment towards oil remains intact amid the oversupply concerns with the “prisoner’s dilemma” between OPEC and U.S Shale limiting upside gains. While it may be too early to say that this is the end of OPEC, U.S Shale has considerably weakened the cartel's grip on the global markets.
From a technical standpoint, WTI Crude has staged an incredible rebound on the daily charts with prices breaking above $51.50. Intraday bulls could exploit the upside momentum to send oil prices higher towards $52.
Fed meeting minutes in focus
The Greenback experienced a technical bounce on Tuesday with prices trading towards 97.40 as investors offloaded bearish positions ahead of the anticipated Federal Reserve meeting minutes this evening. A sense of uncertainty over Trump’s ability to implement the proposed fiscal policies has left investors on edge with questions being raised over the potential impacton the Federal Reserve. While most expect the pending minutes to reinforce expectations of a June rate hike, investors will be searching for further clues on when, or if, a third rate hike is still on the table. With economic data in the States becoming increasingly mixed and the Trump jitters returning with a vengeance, the prospects of a third U.S interest rate increase in 2017 could come under threat.
From a technical standpoint, the Dollar Index remains under pressure on the daily charts. A breakdown back below 97.00 should encourage a further depreciation lower towards 96.00.
Sterling searching for direction…
The fact that Sterling has struggled to maintain gains above 1.3000 on repeated occasions despite the Dollar’s weakness continues to highlight how the currency remains gripped by Brexit uncertainty. With soft economic data from the UK and anxiety over Brexit weighing heavily on investor sentiment, Sterling remains at risk of depreciating sharply if bulls fail to conquer 1.3000. Investors may direct their attention towards the second estimate for the first quarter GDP report released on Thursday which should provide some further insight to how Brexit has impacted the UK economy. An unexpected decline in the second estimate will most likely invite Sterling bears. From a technical standpoint, a breakdown below 1.2900 on the GBPUSD may open a path lower towards 1.2775.
Commodity spotlight – Gold
Gold prices edged lower on Tuesday as the combination of profit taking and a slightly appreciating Dollar attracted short-term bears to attack. Regardless of the recent declines, Gold remains supported on the daily charts with the persistent Trump uncertainties limiting downside losses. While Gold could face some punishment this evening if the Federal Reserve minutes cement expectations of a June rate hike, the Trump jitters should instill enough encouragement for bulls to remain in control in the medium to longer term. From a technical standpoint, Gold bulls need to break above $1260 for a further incline towards $1275.
GOLD Consolidating Above 1250, SILVER Short-Term Bullish, CRUDE OIL Strong Demand.
GOLD Consolidating above 1250.
Gold's retracement seems to end up. Hourly support is located at 1246 (18/05/2017 low). Stronger support is given at 1195 (10/03/2017 low). Expected to show further upside pressures.
In the long-term, the technical structure suggests that there is a growing upside momentum. A break of 1392 (17/03/2014) is necessary ton confirm it, A major support can be found at 1045 (05/02/2010 low).
SILVER Short-term bullish.
Silver increases. Strong support is given at 15.63 (20/12/2017 low). Closest support is given at 16.20 (04/05/2017 low). Key resistance is given at a distance at 19.00 (09/11/2017 high). Expected ton increase until 50% Fibonacci retracement around 17.30.
In the long-term, the death cross indicates that further downsides are very likely. Resistance is located at 25.11 (28/08/2013 high). Strong support can be found at 11.75 (20/04/2009).
CRUDE OIL Strong demand.
Crude oil continues to bounce on shortsqueeze move. Support is given at a distance 43.76 (05/05/2017 low). Demand is very strong and the road is wide-open for further increase.
In the long-term, crude oil has recovered after its sharp decline last year. However, we consider that further weakness are very likely. Strong support lies at 24.82 (13/11/2002) while resistance can now be found at 55.24 (03/01/2017 high)
AUD/USD Short-Term Bullish, EUR/GBP Growing Demand, EUR/CHF Selling Pressures Increase.
AUD/USD Short-term bullish.
AUD/USD is pushing higher since the pair reached hourly support at 0.7329 (09/05/2017 low). As long as prices remain below the resistance at 0.7608 (17/04/2017 high), there are strong downside risks.
In the long-term, we are waiting for further signs that the current downtrend is ending. Key supports stand at 0.6009 (31/10/2008 low) . A break of the key resistance at 0.8295 (15/01/2015 high) is needed to invalidate our long-term bearish view.
EUR/GBP Growing demand.
EUR/GBP is strengthening. The technical has turned positive since the pair has broken resistance at 0.8530 (25/04/2017 low). Support can be found at 0.8304 (05/12/2017 low). Expected to see further continued increase towards 0.8700.
In the long-term, the pair has largely recovered from recent lows in 2015. The technical structure suggests a growing upside momentum. The pair is trading above from its 200 DMA. Strong resistance can be found at 0.9500 psychological level.
EUR/CHF Selling pressures increase.
EUR/CHF is trading lower. We believe that the medium-term pattern suggests us to see continued bearish pressures towards key support that can be found at 1.0623 (24/06/2016 low).
In the longer term, the technical structure is mixed. Resistance can be found at 1.1200 (04/02/2015 high). Yet,the ECB's QE programme is likely to cause persistent selling pressures on the euro, which should weigh on EUR/CHF. Supports can be found at 1.0184 (28/01/2015 low) and 1.0082 (27/01/2015 low).
USD/CHF Heading Towards 0.9550, USD/CAD Continued Weakness, AUD/USD Short-Term Bullish.
USD/CHF Heading towards 0.9550.
USD/CHF continues to push lower since the pair broke support located at 0.9814 (27/03/2017 low). Strong resistance is given at 1.0107 (10/04/2017 high). Expected to continue going lower.
In the long-term, the pair is still trading in range since 2011 despite some turmoil when the SNB unpegged the CHF. Key support can be found 0.8986 (30/01/2015 low). The technical structure favours nonetheless a long term bullish bias since the unpeg in January 2015.
USD/CAD Continued weakness.
USD/CAD keeps on weakening since the pair reached 1.3800. Hourly support can be found at 1.3411 (24/04/2017 high) then 1.3353 (20/01/2017 high). Expected to show continued bearish pressures.
In the longer term, there is a golden cross with the 50 dma crossing the 200 dma indicating further upside pressures. Strong resistance is given at 1.4690 (22/01/2016 high). Long-term support can be found at 1.2461 (16/03/2015 low).
AUD/USD Short-term bullish.
AUD/USD is pushing higher since the pair reached hourly support at 0.7329 (09/05/2017 low). As long as prices remain below the resistance at 0.7608 (17/04/2017 high), there are strong downside risks.
In the long-term, we are waiting for further signs that the current downtrend is ending. Key supports stand at 0.6009 (31/10/2008 low) . A break of the key resistance at 0.8295 (15/01/2015 high) is needed to invalidate our long-term bearish view.
EUR/USD Bearish Consolidation Below Resistance At 1.3000, GBP/USD Holding Below 1.3000, USD/JPY Renewed Growing Pressures.
EUR/USD Bearish consolidation below resistance at 1.3000.
EUR/USD is trading higher towards strong resistance at 1.1300 (09/11/2017 high). Hourly support can be found at 1.0842 (11/05/2017 low). Strong support is now given at 1.0682 (21/04/2017 base) and key support can be found at 1.0494 (22/02/2017 low). Expected to continue growing higher.
In the longer term, the death cross late October indicated a further bearish bias. The pair has broken key support given at 1.0458 (16/03/2015 low). Key resistance holds at 1.1714 (24/08/2015 high). Expected to head towards parity.
GBP/USD Holding below 1.3000.
GBP/USD is trading sideways. Hourly resistance is given at 1.3048 (18/05/2017 high). Hourly support are given at 1.2831 (04/05/2017 low) and1.2757 (21/04/2017 low). An unlikely break of this last support would indicate further weakness. Expected to push higher.
The long-term technical pattern is even more negative since the Brexit vote has paved the way for further decline. Long-term support given at 1.0520 (01/03/85) represents a decent target. Long-term resistance is given at 1.5018 (24/06/2015) and would indicate a long-term reversal in the negative trend. Yet, it is very unlikely at the moment.
USD/JPY Renewed growing pressures.
USD/JPY has exited the symmetrical triangle and keeps pushing lower despite ongoing bullish consolidation. Hourly support is given at 110.24 (18/05/2017 low). Stronger support is located at 108.13 (17/04/2017 low). Other key supports lie at a distant 106.04 (11/11/2016 low). The road is now wide-open for further decline.
We favor a long-term bearish bias. Support is now given at 96.57 (10/08/2013 low). A gradual rise towards the major resistance at 135.15 (01/02/2002 high) seems absolutely unlikely. Expected to decline further support at 93.79 (13/06/2013 low).
Technical Outlook: Oil Continues To Trend Higher On Expectations Of Positive OPEC Meeting Outcome
US oil remains steady on Wednesday and continues to trend higher, approaching round-figure barrier at $52.00. Bull-leg from $48.02 (17 May trough) extends into sixth straight day of gains, as bullish technicals and strong expectations that OPEC will verify agreed extension of production cut for another nine months, keep the price well supported. OPEC and other major oil producing countries will meet on Thursday in Vienna to make a final decision whether to extend their current output cut program which end at the end of June. Positive decision from oil producers would give an additional boost to oil prices for possible extension towards $53.74 (12 Apr high). Tuesday's break and close above pivots at $51.10/38 (100SMA/Fibo 76.4% of $53.74/$43.74) generated bullish signals, with former barriers now acting as supports. Strongly overbought slow stochastic on daily chart warns of correction in the near –term, but no firmer bearish signals being generated so far.
Res: 52.00, 52.62, 53.18, 53.37
Sup: 51.38, 21.10, 50.56, 50.00
Technical Outlook: AUDUSD Falls On China Downgrade/Weak Data, But Dips Were So Far Contained
The Aussie dollar slipped to 0.7442 low in Asia, extending pullback from Tuesday's spike high at 0.7517, where gains were capped by weekly cloud top, reinforced by falling weekly Tenkan-sen.
Fresh weakness came after Moody's cut China's sovereign rating and weaker than expected Australian data overnight (Construction work done fell by 0.7% in Q1, beating -0.2% forecast).
The pair managed to recover the largest part of overnight's losses in late Asian/early Europe trading, however, risk of fresh weakness remains in play after Tuesday's trading ended in Doji candle with very long upper shadow that could be seen as initial signal of recovery stall. Session low/daily Tenkan-sen/Fibo 38.2% of 0.7328/0.7517 mark first pivot at 0.7442, followed by converged 10/20SMA at 0.7432, break of which would generate stronger bearish signal and expose supports at 0.7400 (round-figure/Fibo 61.8%) and 0.7388 (17 May low).
Release of US data today may give fresh direction signals.
Res: 0.7482, 0.7500, 0.7517, 0.7534
Sup: 0.7456, 0.7442, 0.7432, 0.7400
FOMC Minutes In Focus, BoC To Stay On Hold
BoC to stay on hold, USD/CAD subject to downside pressure
The Bank of Canada (BoC) is broadly expected to leave its benchmark rate unchanged at 0.50% today. The central bank will go on with its neutral approach as Governor Poloz does not want to derail the ongoing recovery. Despite a setback in the first quarter, inflation has been slowly moving toward the centre of the target band. On the growth side, the Canadian economy has been able to maintain a positive momentum and grew 2.5% y/y in February.
Besides the highly uncertain oil prices path, the President Trump threat remains one of the main concerns. After introducing tariffs on timber imports from Canada, a re-negotiation of NAFTA will be another painful shock for the economy. Therefore, we anticipate that the BoC will mainly stress the uncertainties surrounding the inflationary outlook and the threat of a tighter trade relationship with the US.
USD/CAD's reaction should remain limited. The currency pair is currently erasing early morning gains and returned to 1.3510. We remain bullish on the pair as we expect market participants will slowly start to switch attention towards the Fed's tightening path and reload bullish bets on the greenback.
China's ratings cut
As expected, Moody's has downgraded China's sovereign credit rating to A1 from Aa3 with revised outlook stable. According to Moody's, the cut was due to growing leverage and the fact indirect liabilities will be pressured as economic growth decelerates. However, the upgrade to a stable outlook indicates that at A1, the risks are balanced.
China's Ministry of Finance was quick to reject Moody's assessment on the grounds that local government and SOE debt should not be considered obligations of the federal government. Markets will be watching the S&P rating for a probable reaction as China still has an AA- credit rating and negative watch. While the credit rating cuts failed to hurt China's stock markets, AUD headed lower following industrial commodities weakness and risk in China.
In our view the probability of a full blown collapse is low considering their ability to control capital flows. However, today's rating move is another warning shot from the markets that pace of credit growth and sustainably of debt is worrying. It is uncertain whether China authorities have the nerve to tighten further at the risk of damaging already weak economic growth.
Oil upside limited
OPEC's meeting tomorrow is expected to see a 9-month extension to the production cut agreement. We suspect that much of the production cuts are already priced in as WTI climbed from $44 to $51.60 since 5th May. Clearly a no-extension result would deliver an asymmetrical negative reaction, while an unexpected deeper cut would send oil higher.
With expectations elevated and further crude price gains unlikely, watch for oil sensitive currencies RUB, CAD and NOK to fall back. In addition, the US budget proposed to sell 270 million barrels of oil from the Strategic Petroleum Reserves over the next 10 years. Traders will be watching US crude inventories today. Given our negative oil outlook (past production cuts deals have only had a transitory positive effect on prices) and a more optimistic view on EU inflation, we would trade long EURNOK.
Markets expect upbeat FOMC meeting minutes
Today will be released the FOMC meeting minutes. Traders will monitor carefully any further hint about the Fed rate path until the end of the year. For the time being, markets are expecting an optimistic tome from May's FOMC policy meeting.
Next US central bank's meeting will be held the 14th of June. A rate hike probability is around 88.8% according to the OIS (Overnight Index Swap). It may be surprising that markets are overly optimistic despite last week's strong arising political uncertainties and the Trump issue with the FBI.
Markets seem clearly skewed towards a rate hike, by moving (slightly) away this week from gold which prices have been declining since the start of the week losing -0.5% in the last 3 days. The US 2-year government bond rose to 1.32 Treasury yield and the US dollar is getting stronger.
Anyway, Fed's Bullard – President of the St Louis Federal Reserve – is concerned by the weak March data and believes that the Fed rate path for this year is maybe too aggressive. When looking at the US Equity Markets, we may believe that the era of low interest rates is far from over. The S&P 500 is back around 2'400 points. We reload very short-term dollar position, the time that the EURUSD to head back towards 1.10.