
Sample Category Title
AUD/USD Elliott Wave Analysis
AUD/USD – 0.7469
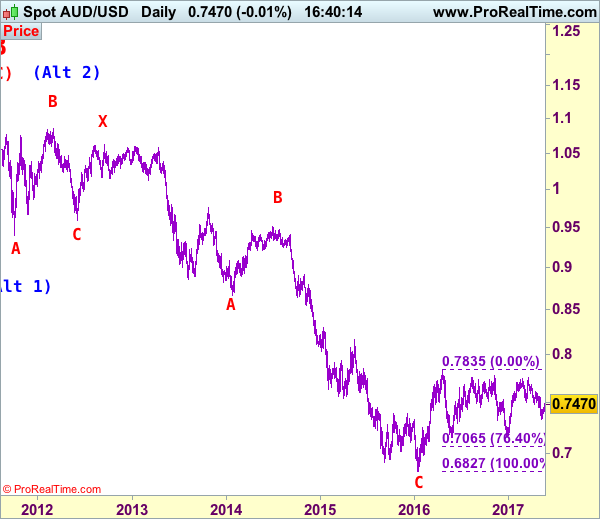
AUD/USD – Wave 5 of C and (B) has possibly ended at 1.1081
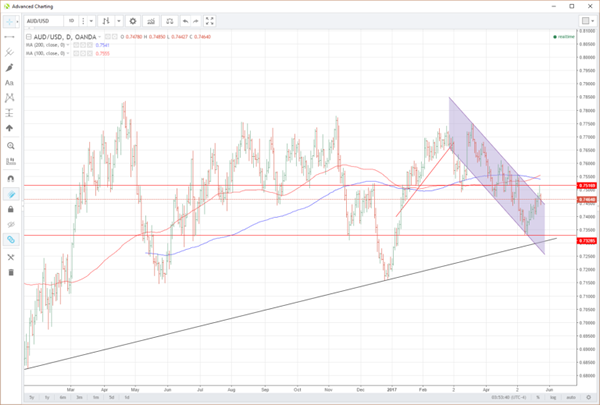
Although aussie edged higher after staging a rebound from 0.7329 and marginal gain from there cannot be ruled out, as this move is viewed as retracement of recent decline, reckon upside would be limited to 0.7556 resistance and bring another decline later, below support at 0.7388 would signal the rebound from 0.7329 has ended, bring retest of this level first. Looking ahead, only a break below 0.7329 would signal the decline from 0.7750 top is still in progress, hence further fall to 0.7300, then 0.7270 would follow, however, oversold condition should prevent sharp fall below 0.7200-10 and price should stay well above previous chart support at 0.7158, bring rebound later.
We are keeping our count that top has been formed at 1.1081 (wave 5 of V) and major correction (A-B-C-X-A-B-C) has commenced, indicated downside targets at 0.7945 (61.8% Fibonacci retracement of entire rise from 0.6007-1.1081) and 0.7750 had been met and downside bias is seen for further weakness to 0.6800, then 0.6700 but reckon 0.6500 would hold from here.
Our preferred count is that the rally from 0.6007 to 0.7270 (7 Jan 2009) is marked as wave A, the retreat to 0.6248 (2 Feb 2009) is wave B and the subsequent upmove is labeled as wave C with wave (iii) and wave (iv) ended at 0.8265 and 0.7700 respectively and wave (v) as well as 3 ended at 0.9407, then wave 4 ended at 0.8066 (instead of 0.8578). The wave 5 has met our indicated projection target of 1.1060 and could ended at 1.1081, this level is now treated as the peak of wave (C) as well as larger degree wave B, hence major fall in wave C has commenced, our initial downside target at psychological support at 0.7000 has just been met and further weakness to 0.6500 would be seen later.
On the upside, whilst initial marginal recovery from here cannot be ruled out, reckon resistance at 0.7566 would limit upside and bring another decline. A daily close above this level would dampen our bearishness and signal a temporary low is formed instead, bring a stronger rebound to another previous resistance at 0.7592, break there would add credence to this view, bring correction of recent decline to strong resistance at 0.7611 first.
Recommendation: Hold short entered at 0.7490 for 0.7290 with stop above 0.7590
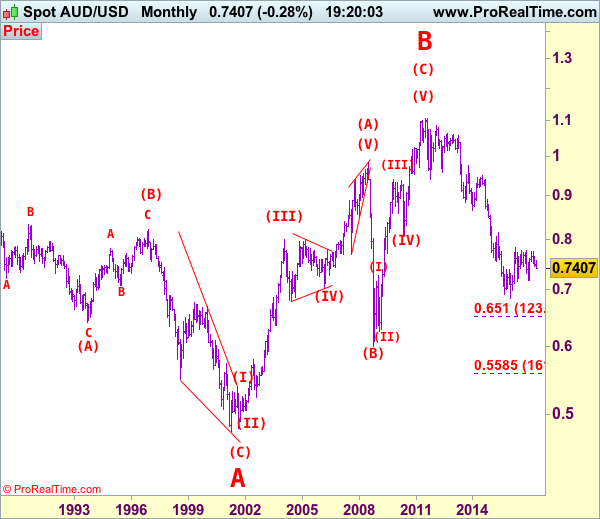
Our alternate count on the daily chart treated the top formed in 2008 at 0.9851 could be a larger degree wave I and was followed by a deep and sharp correction in wave II to 0.6007 and wave III is unfolding from there.
The long-term uptrend started from 0.4775 (2 Apr 2001) with an impulsive structure. Wave I is labeled as 0.4775 to 0.9851 (15 Jul 2008), wave II has ended at 0.6007 (Oct 2008) and wave III is still in progress which may extend further gain to 1.1265.
USD Bounces From 6-1/2-Month Low, Eyes On FOMC Minutes
The Trump administration has presented its 2018 budget plan to Congress last evening. The budget plan calls to slash $3.6 trillion in government spending, mainly reducing the funding for healthcare and social benefits (such as Medicaid, SNAP, pensions for government officials) and Environmental Protection Agency funds.
The cuts are to be used for funding to boost economic growth and to reduce the US deficit. Nevertheless, it will result in numerous needy American citizens losing vital benefits.
The plan forecasts economic growth will be increased to 3% after passing the budget cuts, tax reform, regulation reform and infrastructure plans. However, following the performance of Trump’s administration since taking office, it seems difficult for any of Trump’s plans to be passed smoothly.
Average US annual economic growth is ranging between 1.9% – 2.2%, a 3% target seems to be a big challenge to achieve. The scale of the 2018 budget cut is substantial with a distinct possibility that Congress will reject the plan in its entirety or pass only portions of it.
The dollar index has fallen approximately 2.67% since May 12th, hitting its lowest level of 96.68, post the US presidential election, on May 22. On Tuesday May 23rd, following the announcement of the budget cuts, the dollar index moved higher breaking the resistance level at 97.00 and touching a 3-day high of 97.35 early on Wednesday morning.
On Tuesday, EUR/USD retreated from a 6-and-a-half-month high of 1.1267, breaking the psychological level at 1.1200 as corrective pressures intensified with consolidation around 1.1180 on early Wednesday trading. USD/JPY rebounded around 0.68% from the support at 111.00, hitting a 1-week high of 112.04 on Wednesday morning. USD/JPY consolidates below the psychological resistance level at 112.00.
FOMC May Meeting Minutes will be released at 19:00 BST this evening. Per the CME FedWatch tool, the probability for a rate hike in June rose to 83.1% after the release of the 2018 budget plan. That said, markets are assuming the Fed will stick to its rate hike pace regardless of Trump’s Russia leak scandal and soft economic data. Keep an eye on the Minutes, we will likely get further clues about a June rate hike and updated economic outlook. Be aware that it will likely cause volatility for USD and USD crosses.
Moody’s cut China’s sovereign credit rating from Aa3 to A1 due to fears over rising debt levels, causing the falls in Chinese stock markets.
Trade Idea: EUR/JPY – Stand aside
EUR/JPY - 125.17
Recent wave: wave v of (C) ended at 94.12 and major correction in wave A has ended at 149.79
Trend: Near term up
New strategy :
Stand aside
Position: -
Target: -
Stop:-
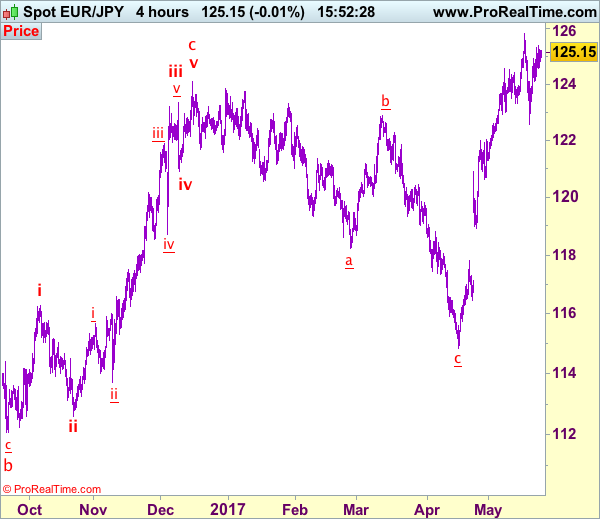
Although the single currency has staged a strong rebound after finding good support at 122.56 (last week’s low) and marginal gain from here cannot be ruled out, reckon upside would be limited and resistance at 125.82 would hold from here. Only a break above this level would confirm recent upmove has resumed and extend further gain to 126.20-30 and possibly 126.60-70 but reckon 127.00-10 would hold from here due to near term overbought condition.
In view of this, would not chase this rise here and would be prudent to stand aside for now. Below 124.10-15 would bring retreat to 123.35-40 but reckon downside would be limited to 123.00 and said support at 122.56 should hold, bring another rebound. Only a break below this support would add credence to our view that top has been formed, bring retracement of recent upmove to 122.00-10 and then 121.50-60 but downside should be limited to 121.20-30.
Our latest preferred count is that wave (ii) is ABC-X-ABC which ended at 123.33 and wave (iii) is unfolding with wave iii ended at 100.77, followed by wave iv at 111.57 and wave v as well as the wave (iii) has ended at 97.04, followed by wave (iv) at 111.43 and wave (v) has ended at 94.12 which is also the end of the larger degree v, this also implied the major wave (C) has also ended there, hence major correction has commenced from there with (A) leg unfolding in its lower degree wave c which has possibly ended at 145.69. Under this count, A-B-C wave (B) has commenced with A leg ended at 136.23, wave B at 143.79 and wave C has possibly ended at 149.79.
Our larger degree count is that the decline from 139.26 is wave (C) and is sub-divided into a diagonal triangle i-ii-iii-iv-v with wave i - 105.44, wave ii- 123.33, wave iii - 97.03, wave iv - 111.43, followed by the final wave v as well as the end of wave (C) at 94.12, this also mark the bottom of larger degree wave B. Under this count, major rise in wave C has commenced as an impulsive wave with minor wave III ended at 145.69, wave V is still in progress for further gain to 150.00. Having said that, this so-called wave V could well be the first leg of larger degree 5-waver wave C and this wave C should bring at least a retest of wave A top at 169.97 (July 2008).
China Downgrade Irons Australian Dollar
A surprise sovereign downgrade of China by Moody's sees iron ore collapse taking the Australian Dollar with it.
If ever there was a lesson about how intertwined the global economy is in the 21st century, it is the sometimes love/hate relationship between China and Australia. Both are mutually dependent on each other from a supply and demand point of view. In China's case, they import just about everything that Australia digs out of its vast ground area to fuel their primary industries. Think coal, copper and most especially iron ore. For Australia, conversely, China is by far its largest trading partner. Consuming vast quantities of both various mineral ores as well as primary products such as meat and dairy to fuel the factory of the word. Given that China's capital account can by no stretch of the imagination be considered open, despite the rhetoric, it can be very hard to express a trading view on the world's 2nd largest economy. Both the onshore and offshore Chinese currencies, the CNY and the CNH, are carefully managed by the PBOC.
Given that China's capital account can by no stretch of the imagination be considered open, despite the rhetoric, it can be very hard to express a trading view on the world's 2nd largest economy. Both the onshore and offshore Chinese currencies, the CNY and the CNH, are carefully managed by the PBOC. The symbiotic nature of the Australian and Chinese relationship means that the Australian Dollar is a 'high beta' in financial market speak to developments within the Chinese economy. In plain English, this really means that because China's capital account is closed, the Australian Dollar (AUD) is used to reflect developments in China.
One could say that when China is booking (read importing lots of raw materials), the AUD tends to move higher. Sometimes a lot higher. When China catches a cold(imports less raw materials), the AUD catches tuberculosis. Asia, including China, was thoroughly wrong-footed today when Moody's rating agency surprisingly downgraded China's sovereign debt from Aa3 to A1. It was the first downgrade of China by them since 1998.
08:18 *(CN) MOODY'S CUTS CHINA SOVEREIGN RATING TO A1 FROM AA3 (one notch); revises outlook from negative to stable (first Moody's cut since 1989) Moody's Investors Service has today downgraded China's long-term local currency and foreign currency issuer ratings to A1 from Aa3 and changed the outlook to stable from negative. The downgrade reflects Moody's expectation that China's financial strength will erode somewhat over the coming years, with economy-wide debt continuing to rise as potential growth slows. – Source TradeTheNews.com
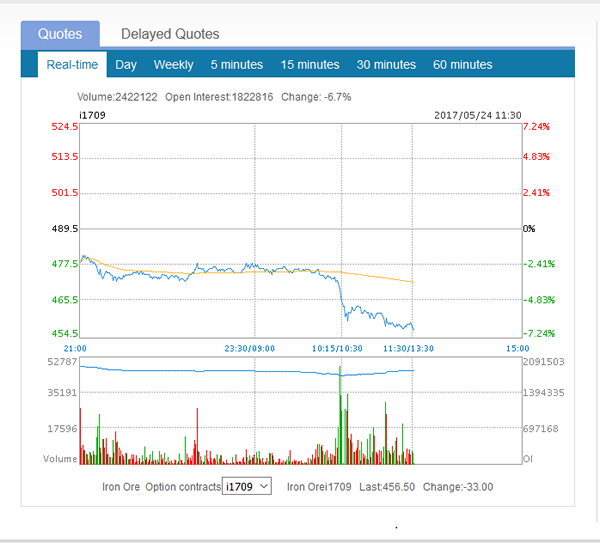
The markets wasted no time in China reacting to this with the Dalian Commodity Exchange Industrial MAtarial Futures all falling.
Both the coking coal and coke futures (used in steel and power production I believe) fell -1.80% and 2.70% respectively.
However, it was the Dalian iron Ore Futures that felt the fury, plunging 6.70% in a straight line as per the chart below.
AUD/USD
The AUD is for obvious reasons, sensitive to all three of the above commodities, but most especially to iron ore. It duly obliged in a 'high beta' fashion and fell in a straight line from 7480 to 7435 before making an anaemic recovery as the Asia session ended. Equities also felt the chill wind with the Shanghai Composite falling (-0.40%) along with the Hang Seng (-0.30%). Surprisingly the ASX 200 finished the day unchanged suggesting the effects of the downgrade may be transitory ahead of tonight's FOMC minutes.
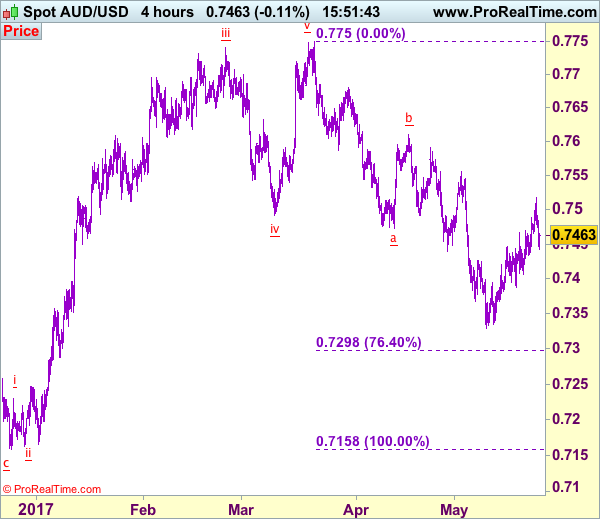
Looking at the chart below, we can see that AUD has fallen back into its down channel and is flirting with its upper boundary at 7460.
Resistance lies above here at yesterday's high at 7517 before we encounter the important 7540/7455 region. Home to the 100 and 200-day moving averages.
Support lies at 7435 followed by the 9th May low at 7330. Long term support is denoted by a trendline stretching back to January 2016, which today is at 7305.
Summary
The China downgrade and subsequent fall in the iron ore futures indeed 'ironed out' the AUD today. However, the ASX closed flat, not a bad result when China iron ore futures dropped nearly seven percent. It may imply the AUD sell-off could be transitory unless we get a hawkish FOMC minutes this evening.
Foreign Exchange Market Commentary: EUR/USD, USD/JPY, GBP/USD, GOLD, WTI CRUDE, DJIA, FTSE100, DAX
EUR/USD
The greenback closed generally higher in a dull Tuesday, although gains were shallow, and uneven across the board. The recovery came in the American afternoon, backed by a recovery in Treasury yields and as Wall Street traded once again in the green. The EUR/USD pair topped at 1.1267 early London, but was unable to extend its gains, despite the EU later released more encouraging macroeconomic data. The May Markit PMIs showed that German and the EU numbers held near six-year highs, confirming strong growth in the region. The services sector indexes ticked lower, but still came in strong. Additionally, the German IFO survey indicated that business confidence in the country remains strong, up to a record of 114.6 following April's revised 113.00, with both the assessment of the current situation and expectations sharply up.
In the US, the Markit preliminary PMIs presented a similar behavior, with the manufacturing sector expanding, but the services one shrinking. The Composite PMI resulted at 56.8, matching April's final reading. New Home sales, however, edged sharply lower after the strong March reading, down by 11.4% in the month against expectations of a 1.5% decline. Fed's Kashkari was on the wires, expressing concerns over the decline in core inflation, adding to the latest dovish rhetoric.
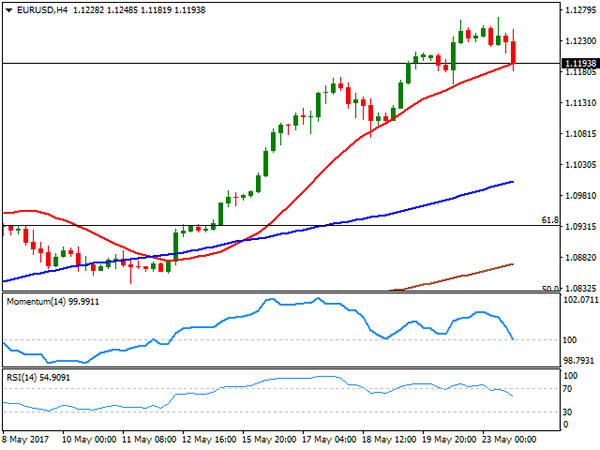
The EUR/USD pair settled a few pips below 1.1200, and seems poised to correct lower, although in the longer term, is too early to confirm an interim top. In the 4 hours chart, the price has found some support around a bullish 20 SMA, whilst technical indicators turned sharply lower from overbought levels, currently pressuring their mid-lines and ready to break lower. The pair has an immediate support at Monday's low of 1.1161, while a stronger one comes at 1.1080. Approaches to this last will likely attract buying interest. Back above 1.1220, the risk turns towards the upside, with room then to extend the advance up to 1.1300.
Support levels: 1.1160 1.1120 1.1080
Resistance levels: 1.1200 1.1260 1.1300
USD/JPY
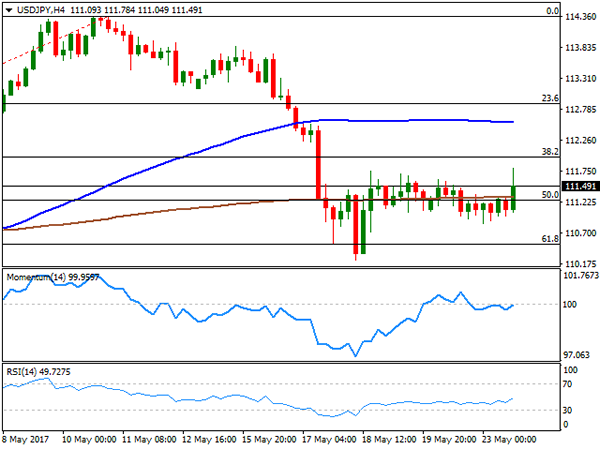
Having traded within a tight range ever since the week started, the USD/JPY ended up this Tuesday, surging alongside with US Treasury yields. The recovery, however, was not enough to change the neutral stance seen over these last few days, as the pair remained well below 112.00, ending around 111.50 after peaking at 111.78. Yields advanced after a local auction, although the movement was quite shallow, with the 10-year benchmark settling at 2.26% from previous 2.25%. BOJ´s Governor Kuroda will be on the wires during the upcoming Asian session, but is not expected to surprise markets with a change in the monetary policy bias. Technically, the 4 hours chart shows that the price has settled midway between the 50% and the 61.8% retracement of the latest bullish run, while moving averages remain flat, as technical indicators keep lacking directional strength, currently within neutral territory. The risk remains towards the downside, albeit only a downward acceleration through 111.00 will confirm additional declines. The bearish pressure will likely ease on a break above 112.00, but gains are hardly expected to extend beyond 113.00 this week.
Support levels: 111.00 110.50 109.90
Resistance levels: 111.65 112.00 112.45
GBP/USD
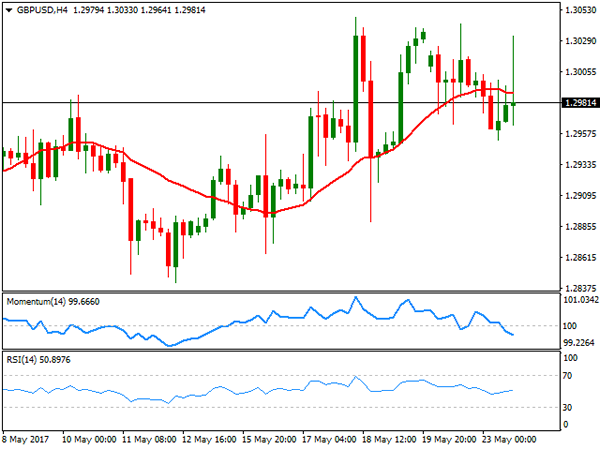
The GBP/USD pair eased at the beginning of the day, hit by a terror attack that took place in Manchester late Monday. The pair traded as low as 1.2952, but managed to bounce back, although held below the 1.3000 threshold for most of the day. There was a short-lived up-tick that reached 1.3030 around London's fix, but the pair settled around 1.2980, indicating that speculative interest is now preferring to sell spikes, somehow anticipating additional declines ahead. There were no big news coming from the UK this Tuesday, and the calendar will remain light until next Thursday, when the UK will release a revision of Q1 GDP. Still, little action is expected around Pound's crosses ahead of the UK election, and fresh news over Brexit negotiations. Technically, the neutral stance seen on previous updates persist with the 4 hours chart showing that the price keeps hovering around a directionless 20 SMA, whilst the Momentum indicator heads lower, right below its 100 level, and the RSI aims higher around 52, diverging from each other but both lacking strength. Below 1.2890, the pair can extend its decline towards 1.2830, the base of the wider range that will likely keep holding ahead of the big events to come.
Support levels: 1.2950 1.2910 1.2880
Resistance levels: 1.3025 1.3060 1.3100
GOLD
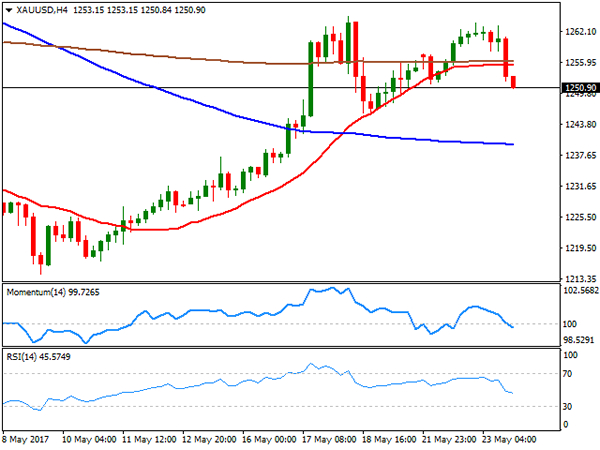
Gold prices retreated from near a three-week high of $1.263.72 a troy ounce reached at the beginning of the day, settling around 1,250.90, not far from its daily low. There were little news affecting particularly gold, and those released, were in fact gold positive, as Fed's Kashkari made some dovish comments, expressing concerns over the recent decline in core inflation, and therefore weighing on chances of a rate hike next June. Nevertheless, the commodity fell, as the dollar gathered momentum against most of its rivals during the US afternoon. Technically, the daily chart shows that indicators have turned south within positive territory, whilst the price holds above its 20 and 100 DMAs, both converging today at 1,241.10, still lacking directional strength. Shorter term, and according to the technical picture has turned bearish, given that technical indicators have entered negative territory, maintaining their downward strength, whilst the price broke below its 20 SMA, now flat around 1,255.45, providing resistance for the upcoming session.
Support levels: 11,245.40 1,237.40 1,229.90
Resistance levels: 1,255.45 1,264.95 1,273.10
WTI CRUDE OIL
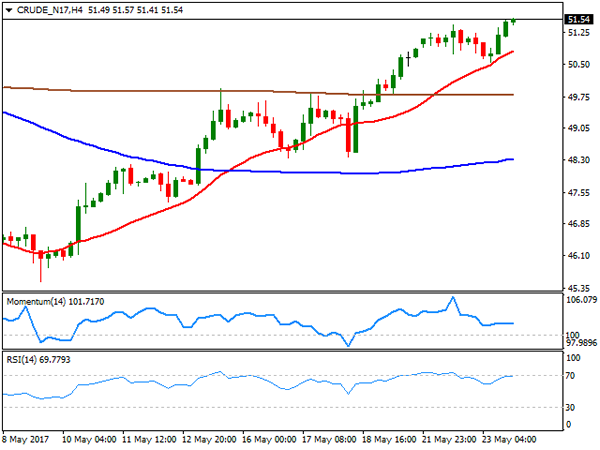
Crude oil prices advanced further this Tuesday, with West Texas Intermediate futures settling at $51.40 a barrel, its highest since mid April. The commodity recovered from a daily low of 50.56, achieved early US session as the White House unveiled its budget proposal, which includes reducing national debt by selling off half of the nation's Strategic Petroleum Reserve and allowing drilling in the Alaska National Wildlife Refuge. Speculation that the bill will hardly pass the Congress have taken out some of the pressure, whilst hopes of another drawdown in US stockpiles and of an extension of OPEC's output cut backed a new leg higher. Daily basis, the commodity has advanced further above its 100 DMA after closing around it for the first time in a month this Monday, whilst technical indicators aim modestly higher near overbought readings, supporting additional gains. In the 4 hours chart, a bullish 20 SMA keeps leading the way higher, now providing support around 50.70, while technical indicators have turned horizontal, but within positive territory.
Support levels: 51.10 50.60 50.00
Resistance levels: 51.90 52.60 53.20
DJIA
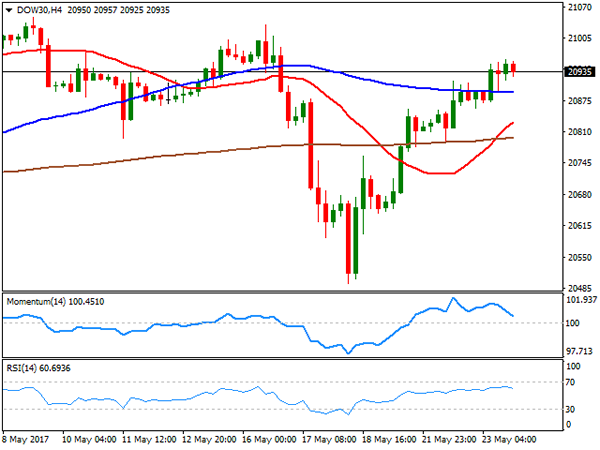
US equities followed the lead of their European counterparts, ending the day with modest gains. The Dow Jones Industrial Average advanced for a fourth consecutive day, up 0.21% or 43 points, to 20,937.91. The Nasdaq Composite added 0.08% and settled at 6,138.71, while the S&P added 4 points, to 2,398.42. Within the Dow, Goldman Sachs led advancers, adding 1.68%, followed by Caterpillar which added 1.34%. Home Depot, on the other hand, led decliners with a 0.67% loss, followed by Walt Disney that shed 0.57%. The daily chart for the Dow shows that the index recovered above its 20 DMA that anyway remains flat, whilst the RSI indicator entered positive territory, now heading north around 55. The Momentum however, holds below its 100 level, reflecting the limited intraday advance. Short term, the 4 hours chart presents a generally positive stance, as the benchmark holds above all of its moving averages, with the Momentum also faltering, heading south above its mid-line.
Support levels: 20,918 20,858 20,806
Resistance levels: 20,961 21,009 21,040
FTSE100
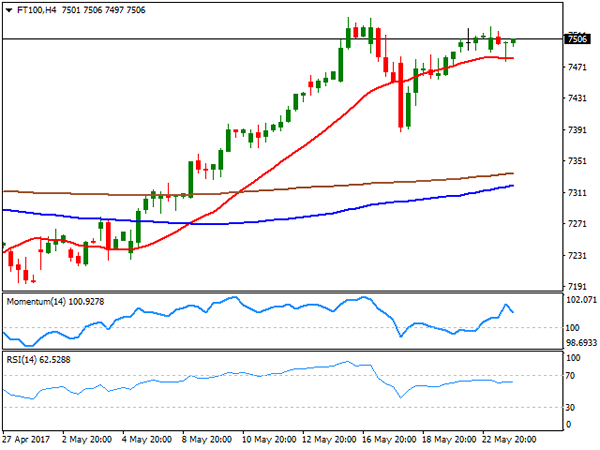
The FTSE 100 ended the day at 7,485.29, down 11 points or 0.15%, trimming early gains as the Pound bounced from a fresh weekly low. Mood was subdued amid the terror attack in Manchester, further weighed by rising public sector net borrowing, up in the month by the highest amount since 2014. Babcock International led advancers, adding 2.97%, followed by EasyJet that gained 2.52%. The losers' list was led by Kingfisher that lost 2.42%. The advance in Wall Street helped the London benchmark to regain the 7,500 level in after-hours trading, overall maintaining the positive tone seen on previous updates. Daily basis, the Footsie is still way above a bullish 20 SMA, whilst technical indicators hold near overbought readings, but with no clear directional strength. In the 4 hours chart, an intraday decline was quickly reverted after the index touched its 20 SMA, now around 7,481, while technical indicators retreated modestly from near overbought readings, not enough to suggest an upcoming bearish move.
Support levels: 7,481 7,455 7,410
Resistance levels: 7,534 7,570 7,605
DAX
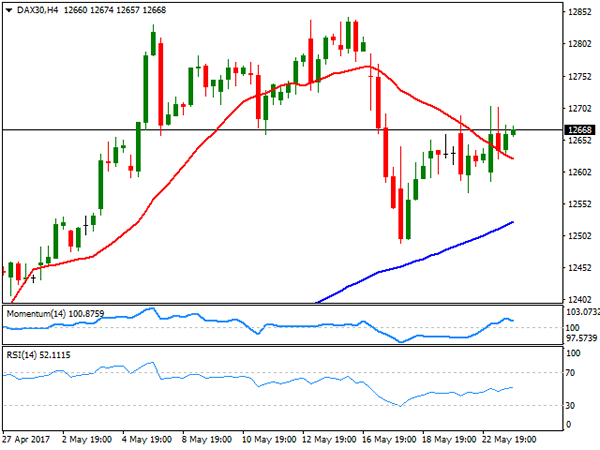
The German DAX added 39 points this Tuesday, closing at 12,659.15, with financials and energy-related equities leading the advance. Strong German macroeconomic figures backed the rally, as business confidence in the country, according to the IFO survey, peaked at 114.6 in May, its highest on record. E.ON led gainers with a 3.66% gain, followed by ThyssenKrupp which added 2.0% Among banks, Deutsche added 1.12%, whilst Commerzbank closed 0.76%. Daimler was the worst performer, down by 1.29% as auto-parts sales sunk in the US, affecting the sector. The technical picture for the DAX is modestly positive, as it keeps hovering around a horizontal 20 SMA, whilst technical indicators barely hold above their mid-lines, without directional strength. In the 4 hours chart, the technical picture is quite alike, as the index managed to surpass a still bearish 20 SMA, whilst technical indicators head nowhere within neutral territory.
Support levels: 12,625 12,598 12,557
Resistance levels: 12,675 12,729 12,781
Trade Idea: AUD/USD – Buy at 0.7405
AUD/USD – 0.7463
Recent wave: Wave 5 ended at 1.1081 and major correction has commenced for fall to 0.7000 and then towards 0.6500-10
Trend: Near term down
Original strategy :
Buy at 0.7420, Target: 0.7570, Stop: 0.7360
Position: -
Target: -
Stop: -
New strategy :
Buy at 0.7405, Target: 0.7570, Stop: 0.7345
Position: -
Target: -
Stop:-
As aussie has retreated after meeting resistance at 0.7518, suggesting minor consolidation below this level would be seen and pullback to 0.7420-25 cannot be ruled out, however, if our view that low has been formed at 0.7329 is correct, downside should be limited to 0.7400-05 and bring another rebound later, above said resistance at 0.7518 would extend the rise from 0.7329 low to resistance at 0.7556, having said that, a break above there is needed to provide confirmation, bring subsequent rise towards 0.7595-00.
In view of this, we are looking to buy aussie on dips as 0.7400-10 should limit downside and bring another rise. A break of support at 0.7388 would abort and signal top is formed, bring further fall to 0.7360 but said recent low at 0.7329 should remain intact. Only a drop below this support at 0.7329 would abort and signal recent decline has resumed and extend weakness to 0.7295-00 (76.4% retracement of 0.7158-0.7750).
On the 4-hour chart, the move from 0.8066 is the wave 5 with i: 0.8860, ii: 0.8315, wave iii is an extended move ended at 1.0183, iv: 0.9706 and wave v has ended at 1.1081 (also the top of entire wave 5). The subsequent selloff is the major correction which is unfolding as ABC-X-ABC and 2nd A leg has ended at 0.8848, followed by a-b-c wave B which ended at 0.9758, hence, 2nd C wave is now in progress and indicated downside target at 0.7000 and 0.6950 had been met, so further fall to 0.6710-20 cannot be ruled out.
Technical Outlook: Cable – Risk Of Deeper Pullback Seen On Break Below Converging 10/20SMA’s
Cable closed in red on Tuesday and generated another negative signal after Harami pattern was formed on Fri/Mon. The pair came under additional pressure after yesterday's terrorist attack in Manchester, keeping the downside vulnerable. Technical studies on lower timeframes are weak with indicators on daily chart pointing lower that may shift near-term bias. First triggers and strong supports lay at 1.2945/35 (converging 10/20SMA's), loss of which would generate stronger bearish signal for fresh extension of pullback from highs at 1.3045 zone, as descending thick weekly cloud continues to weigh. Further easing would expose next pivotal supports at 1.2843/30, break below which is needed to confirm reversal. Conversely, break and close above 1.3000 barrier would neutralize immediate bearish threats. With no releases of economic indicators from the UK today, turns focus towards US housing data and more significant FOMC minutes, which may give more clues whether the Fed remains on track for rate hike in June.
Res: 1.3000, 1.3033, 1.3046, 1.3087
Sup: 1.2945, 1.2935, 1.2888, 1.2843
Technical Outlook: EURUSD At The Back Foot Ahead Of Draghi
The Euro remains at the back foot in early Wednesday and holding around 1.1175 (Tuesday's low) after failure to sustain break above 1.1200 barrier pulled the price lower.
Tuesday's close in red that also formed bearish Outside Day, could be seen as early signal of correction, along with slow stochastic which reversed from overbought territory on daily chart.
Stronger dollar in Asia dragged the single currency lower, offsetting positive impact of strong German Ifo data and EU PMI on Tuesday.
Further negative signal could be expected on break below Monday's low at 1.1161, with loss of pivotal 1.1100 support (Fibo 38.2% of 1.0839/1.1268 upleg, reinforced by rising 10SMA) needed to confirm pullback, which may extend towards next strong support at 1.1000 (Fibo 61.8%, reinforced by rising 20SMA).
However, overall structure remains bullish and sees scope for fresh upside after correction.
Focus today in on the speech of ECB President Draghi (due at 12:45 GMT) which may provide more information about timing for tapering of QE program and hints about exiting current ultra-low rate policy.
Any comments from Draghi that markets will understand as hawkish would be supportive for Euro for renewed attempts above 1.1200 and extension towards next target at 1.1313 (Fibo 76.4% of 1.1614/1.0340.
Conversely, more dovish from Draghi would accelerate pullback from Tuesday's fresh multi-month high at 1.1268.
Res: 1.1200, 1.1249, 1.1268, 1.1300
Sup: 1.1161, 1.1100, 1.1053, 1.1000
Currencies: Dollar Decline Shows Tentative Signs Of Slowing
Sunrise Market Commentary
- Rates: Range trading remains in vogue
Yesterday, some modest further losses, which pushes core bonds back lower in the reach, while equities recaptured the highs. Today, the calendar is thin. Surprises are possible from the ECB speakers or FOMC Minutes, but overall we bet on another technical driven bond session. - Currencies: Dollar decline shows tentative signs of slowing
Yesterday, the dollar finally rebounded supported by a rise in equities and US yields; Today, the focus is on the Minutes of the May FOMC meeting. More signs that the Fed normalization process will continue might help to put a floor underr the dollar. Equities remain a wild card.
The Sunrise Headlines
- US equities rallied for the fourth day in a row, leaving the S&P 500 within striking distance of its all-time high at the close. Financials outperformed and recouped last Wednesday's rout. Asian equities area trading mixed. Japanese equities outperform on weaker yen, while Chinese ones lose on a rating downgrade.
- China's credit rating has been downgraded by Moody's from Aa3 to A1 (stable) on expectations the country's financial strength will 'erode somewhat' over coming years as debt rises, but its outlook was lifted to stable from negative.
- New Zealand reported its largest monthly trade surplus since 2015 in April as dairy, wood and wine exports grew. Its trade deficit year to date decline to NZD 4.4B. The Kiwi dollar was little changed around NZD/USD 0.70
- S&P Global Ratings has placed the ratings of 38 Brazilian financial institutions on negative watch amid a political scandal that rocked the country's markets. It may delay an economic recovery and increases the risks for credit fundamentals.
- Philadelphia FED Harker said June 'is a distinct possibility' for the U.S. central bank's second interest-rate increase of 2017. He still sees 3 hikes in 2017 as appropriate and expects an balance-sheet unwinding as likely to start in 2017.
- Ben Bernanke subtly criticized the BOJ: It's disappointing the 2% CPI target had to be pushed back, policy transmission channels are near their limits and the government and BOJ have to do better coordinating fiscal and monetary policy.
- Today calendar is light with speeches of ECB Praet and Draghi, a US 5-yr Note auction and the FOMC Minutes.
Currencies: Dollar Decline Shows Tentative Signs Of Slowing
USD finally gets (modest) interest rate support
On Tuesday, the trends of the previous days initially persisted. USD/JPY (111.10) struggled to avoid further losses even as sentiment on risk remained constructive. The euro remained well bid supported by very strong EMU data. Finally, the dollar received interest support later in the session, lifting the USD currency off the recent lows. EUR/USD dropped below 1.12 to close session at 1.1183. USD/JPY rebounded higher in the 111 big figure to finish the day at 111.78 (from 111.30).
Overnight, Asian equities show a mixed picture. Japanese equities are supported by a weaker yen. USD/JPY trades currently at 111.85. Chinese markets underperform after Moody's cut the China debt rating to A1 from Aa3, stable outlook. The China rating downgrade also put additional pressure on the Aussie dollar. AUD/USD trades currently in the 0.7450 area (top around 0.7517 yesterday). EUR/USD is holding a tight range in the 1.1180 area.
Today, in the US the Existing Home sales (April) will be published. A slight decline at a high level is expected. This evening, the focus will turn to the minutes of the May FOMC meeting. For an in dept analysis see the fixed income part. We expect the report the confirm the Fed's intention to raise rates in June. If the Fed would give concrete hints on the roadmap for its balance sheet reduction, it would be hawkish and USD supportive.
Over the previous days, the dollar hardly profited from the post-Turmp rebound of equities. Euro strength prevailed. Yesterday afternoon, fortunes finally changed in favour of the dollar. Recently, but not yesterday, interest rate differentials drifted gradually against the dollar. If the Fed minutes confirm the Fed's intention to normalize policy further, interest rate differentials between the US and Europe shouldn't go against the dollar anymore. The global equity performance is also a wildcard for USD trading. Yesterday, the dollar finally profited from a better equity sentiment. A risk-off correction, if it would occur, might be mixed for the dollar. However, we are not convinced on the safe haven characteristics of the euro. Over the previous days we suggested that the EUR/USD rebound has gone far. Yesterday's price action suggests that the upside has indeed become tougher. We look to cautiously sell EUR/USD on upticks.
Technical picture.
The USD/JPY rebound ran into resistance two weeks ago. Wednesday's selloff/ re-break below the 112.20 previous top aborted the uptrend and made the short-term picture negative. Return action lower in the 108.13/114.37 range is possible. Yesterday, the USD/JPY decline took a breather, but the global picture didn't change fundamentally.
Earlier this month, it looked that EUR/USD could revisit the 1.0821/1.0778 support (gap). However, poor US data and political upheaval finally propelled EUR/USD north the 1.1023 range top. The correction tops at 1.1300/1.1366 is the next resistance. We think that USD sentiment will have to be extremely negative to clear this hurdle short-term. Further ST EUR/USD gains will become tougher. A return below 1.1023 would indicate that the upside momentum has eased.
EUR/USD rally running into resistance as USD stages a comeback
EUR/GBP
EUR/GBP rally running into resistance
Yesterday, the news flow on the UK remained sterling negative. The terrorist attack in Manchester weighed on sterling early in the session. The CBI May reported sales were also softer than expected. EUR/GBP touched a new correction top in the 0.8675 area around noon, but this move was also driven by euro strength. Later, EUR/USD fell prey to profit taking as the dollar rebounded. EUR/GBP closed the session at 0.8628. The decline in cable was more modest. The pair closed the session at 1.2961.
Today, the UK eco calendar is empty. So sterling trading will be driven by to global moves in the dollar and the euro. If the EUR/USD rally takes a breather, the topside of EUR/GBP will probably also be capped. So, some profit taking on EUR/GBP shorts might be on the cards.
EUR/GBP rally to take a breather
Market Update – Asian Session: Moody’s Cuts China Sovereign Rating For The First Time Since 1989
US Session Highlights
(US) Fed’s Kashkari (dove, voter): it's hard to believe there would be a spike in inflation; hard to see 3% growth in US given demographics
(US) MAY PRELIMINARY MARKIT MANUFACTURING PMI: 52.5 V 53.0E
(US) APR NEW HOME SALES: 569K V 610KE
(US) MAY RICHMOND FED MANUFACTURING INDEX: +1 V 15E (lowest since Sep 2016); new orders 0 v 23 prior
Investors digested Trump's budget plan, which calls for large cuts to Medicaid and social services, with major indices making small gains for the day. Markets were unperturbed after weak US data and a heinous terrorist attack in the UK overnight. Fixed income fell out of favor again, as investors regained interest in risk; 10-year Notes yield rising 3bps on the day. In the S&P, Financials was the best performing sector, up 0.8%, with Consumer Discretionary the only losing sector, down 0.4%
US markets on close: Dow +0.2%, S&P500 +0.2%, Nasdaq +0.1%
Best Sector in S&P500: Financials
Worst Sector in S&P500: Consumer Discretionary
Biggest gainers: A +4.6%; ADM +3.7%; NUE +3.3%
Biggest losers: AZO -11.8%; ALXN -9.3%; BRO -6.2%
At the close: VIX 10.7 (-0.2pts); Treasuries: 2-yr 1.32% (+4bps), 10-yr 2.28% (+3bps), 30-yr 2.95% (+3bps)
US movers afterhours
TCS: Reports Q4 $0.17 v $0.10e, R$221M v $214Me; Guides initial FY17 $0.25-0.35* v $0.25e, R$830-850M v $837Me, SSS down low single digits; +40.9% afterhours
TLYS: Reports Q1 -$0.01 v -$0.10e, R$120.9M v $114Me; Guides Q2 $0.07 to $0.03 v $0.02e; SSS "flat to up low single digits"; +16.6% afterhours
INTU: Reports Q3 $3.90 v $3.87e, R$2.54B v $2.50Be; Guides Q3 $0.16-0.18 v $0.15e, R$795-815M v $772Me; +9.1% afterhours
BG: Issues statement: Not in talks on combination with Glencore; -3.4% afterhours
STNG: To merge with Navig8 Product Tankers Inc., will pay $42.2M cash consideration; -4.8% afterhours
ANW: Reports Q1 $0.03 v $0.36e, R$1.5B v $1.16Be; EBITDA $27.1M v $21.9M y/y; -18.1% afterhours
Key economic data
(NZ) NEW ZEALAND APR TRADE BALANCE (NZD): 578M V 267ME (2nd straight trade surplus); 12-MONTH YTD: -3.48B V -3.8BE
(AU) AUSTRALIA Q1 CONSTRUCTION WORK DONE Q/Q: -0.7% V -0.5%E
(AU) AUSTRALIA APR SKILLED VACANCIES M/M: +0.1% V -0.6% PRIOR
Asia Session Notable Observations, Speakers and Press
Asian indices traded mixed in the wake of 4th consecutive session of gains on Wall St, where rising Treasury yields helped Financials lead the broader index despite confirmation that the overnight explosion in Manchester was in fact a terror act. Mainland China is underperforming following a surprise sovereign rate cut by Moody's - the first since 1989. The rating agency noted that "China's financial strength will erode over the coming years, with economy-wide debt continuing to rise as potential growth slows", though the "stable outlook reflects our assessment that, at the A1 rating level, risks are balanced." Moody's also forecast leverage across the China economy to increase in coming years and reform to slow, as sustained policy stimulus will lead to higher debt. China Finance Ministry responded that the assessment overestimated economic difficulties and underestimates ability to deepen supply side reform, maintaining that debt levels will be reasonable and govt reform will help curb local debt risks.
China CDS rose about 3bps in the wake of the downgrade and AUD/USD fell some 40pips below 0.7450, though the spillover was contained to only marginal declines in US equity futures and a slight ripple in the risk-gauge USD/JPY pair. FX majors were otherwise fairly rangebound going into tomorrow's FOMC policy meeting minutes where investors will look for more clues about the Fed's intended policy mix, including anticipated balance sheet reduction later this year.
In other notable economic data, New Zealand Apr trade balance registered its 2nd straight month of surplus, with Exports volume at a 2-year high of 4.75B v 4.4Be. Shipments to China also rose over 20% y/y, helping NZD/USD to session highs above 0.7020. Modest upward momentum in NZD was helped by earlier release of Fonterra milk price forecast hike speculated to result in sooner RBNZ tightening than currently expected.
China
(CN) China will further open its economy to foreign investors, through measures such as allowing investment in more industries, such as services - Chine media
(CN) China margin trading is at a 3-month low and 60% lower than the peak 2 years ago - Chinese press
(CN) MSCI notes there are still over 100 stocks suspended in China
Japan
(JP) BOJ Gov Kuroda: Many people agree the natural interest rate has fallen in recent years, leading to unconventional monetary policy - press
(JP) Japan PM Abe planning to hold talks with US Pres Trump at upcoming G7 summit - press
(JP) Japan Upper House approves government’s two nominees for BoJ board; Vote to move to lower house
Australia/New Zealand
(NZ) Fonterra Raises 2016/17 farmgate milk price to NZ$6.15/kg; Affirms FY17 EPS NZ$0.45-0.55
(NZ) Fonterra's increase of price forecasts today may lead RBNZ to hike rates sooner than expected - NZ Press
Korea
(KR) According to one survey, analysts are unanimous in expectation for Bank of Korea (BOK) to hold rates unchanged this month - Korean press
(KR) South Korea govt to submit extra budget to Parliament in June - Korean press
Asian Equity Indices/Futures (00:30ET)
Nikkei +0.5%, Hang Seng -0.2%, Shanghai Composite -0.4%, ASX200 -0.1%, Kospi +0.2%
Equity Futures: S&P500 -0.1%; Nasdaq -0.1%, Dax -0.1%, FTSE100 -0.2%
FX ranges/Commodities/Fixed Income (00:30ET)
EUR 1.1175-1.1190; JPY 111.75-112.00; AUD 0.7440-0.7480; NZD 0.6990-0.7020
June Gold -0.3% at 1,252/oz; July Crude Oil flat at $51.47/brl; July Copper -1.2% at $2.57/lb
SPDR Gold Trust ETF daily holdings fall 5.0 tonnes to at 847.5 tonnes; lowest since Apr 12th
(US) Weekly API Oil Inventories: Crude: -1.5M v +0.9M prior
(CN) Dalian iron ore down over 5% in early trade
(CN) PBOC to inject combined CNY90B v CNY140B prior
(CN) PBOC SETS YUAN MID POINT AT 6.8758 V 6.8661 PRIOR; 1st weaker fix in 3 sessions
(AU) Australia MoF (AOFM) sells A$800M v A$800M indicated in 2.75% 2027 bonds; avg yield 2.545% v 2.515% prior; bid-to-cover 3.04x v 3.24x prior
Asia equities notable movers
Australia
Iluka (ILU) +6.1%; Increases Zircon Reference price
Worleyparsons (WOR) +3.6%; investor day comments
Programmed Maintenance Services (PRG) +2.3%; Reports FY17
Japan
Toshiba (6502) +8.0%; Western Digital said to have proposed ¥2T offer for chip unit as part of partnership with INCJ and DBJ
Nippon Express (9062) +1.6%; Working with Amazon to launch a logistics service allowing small and mid-size businesses to send exports to the US - Nikkei
Park 24 (4666) -2.4%; May report H1 op profit ¥9B, -10% y/y (prior forecast +1% y/y) - Nikkei
Hong Kong
Worldgate Global Logistics (8292) +4.0%; Share buyback
Sustainable Forest Holding (0732) +3.2%; Guides Q1
Hilong Holding (1623) -4.5%; Pakistan contract