Sample Category Title
UK Public Sector Net Borrowing Rose In April
For the 24 hours to 23:00 GMT, the GBP declined 0.32% against the USD and closed at 1.2961, after a suspected terrorist attack in UK's Manchester city killed at least 22 people and left around 60 people injured.
On macro front, UK's public sector net borrowing reported a deficit £9.6 billion in April, from a revised deficit of £2.3 billion in the previous month. Markets were expecting public sector net borrowing to show a deficit of £8.0 billion.
In the Asian session, at GMT0300, the pair is trading at 1.2967, with the GBP trading 0.05% higher against the USD from yesterday's close.
The pair is expected to find support at 1.2935, and a fall through could take it to the next support level of 1.2904. The pair is expected to find its first resistance at 1.3016, and a rise through could take it to the next resistance level of 1.3066.
With no economic release in the UK today, investors will look forward to global macroeconomic data for further direction in Pound.
The currency pair is trading below its 20 Hr and 50 Hr moving averages.

Japanese Yen Trading Lower This Morning
For the 24 hours to 23:00 GMT, the USD rose 0.43% against the JPY and closed at 111.80.
On macro front, Japan's final machine tool orders rose 34.7% YoY in April, meeting the initial estimates.
In the Asian session, at GMT0300, the pair is trading at 111.89, with the USD trading 0.08% higher against the JPY from yesterday's close.
Meanwhile, Bank of Japan (BoJ) Governor, Haruhiko Kuroda, stated that uncertainty about the natural interest rate is making it difficult for central bankers to steer policy. He further commented that the natural rate of interest has been falling globally, which has led central banks to adopt unconventional economic policies.
The pair is expected to find support at 111.2, and a fall through could take it to the next support level of 110.52. The pair is expected to find its first resistance at 112.28, and a rise through could take it to the next resistance level of 112.68.
The currency pair is trading above its 20 Hr and 50 Hr moving averages.

Switzerland’s Trade Surplus Narrowed In April
For the 24 hours to 23:00 GMT, the USD rose 0.18% against the CHF and closed at 0.9757.
Meanwhile, data showed that Swiss trade surplus dropped to CHF 1.97 billion in April, from a revised trade surplus of CHF 3.04 billion in the previous month, as its industrial sector continued to struggle with the strong currency and pharmaceuticals exports slowed. Additionally, the nation's exports fell 2.5% in April, compared to a revised rise of 1.8% last month. On the other hand, imports climbed 2.6% on a MoM basis, from a revised 0.6% rise in the prior month.
In the Asian session, at GMT0300, the pair is trading at 0.9759, with the USD trading marginally higher against the CHF from yesterday's close.
The pair is expected to find support at 0.9719, and a fall through could take it to the next support level of 0.968. The pair is expected to find its first resistance at 0.9781, and a rise through could take it to the next resistance level of 0.9804.
The currency pair is trading above its 20 Hr and 50 Hr moving averages.

Canadian Dollar Trading Lower, Ahead Of BoC’s Interest Rate Decision
For the 24 hours to 23:00 GMT, the USD declined 0.03% against the CAD and closed at 1.3515.
In economic news, wholesales sales rose less than expected by 0.9% in March, compared to a revised gain of 0.3% in the previous month. Investors had anticipated a 1.0% rise.
In the Asian session, at GMT0300, the pair is trading at 1.3531, with the USD trading 0.12% higher against the CAD from yesterday's close.
The pair is expected to find support at 1.3481, and a fall through could take it to the next support level of 1.343. The pair is expected to find its first resistance at 1.3557, and a rise through could take it to the next resistance level of 1.3582.
Moving forward, all eyes would be on the Bank of Canada's (BoC) monetary policy meeting, scheduled later in the day.
The currency pair is trading above its 20 Hr and 50 Hr moving averages.

Daily Technical Analysis: EUR/USD Reversal Or Correction After Rising Wedge Break
Currency pair EUR/USD
The EUR/USD failed to break above the 1.1250-1.13 resistance zone and showed a bearish reversal or correction. Price also broke below the rising wedge chart pattern which is indicated by the broken support (dotted green) and resistance (red).
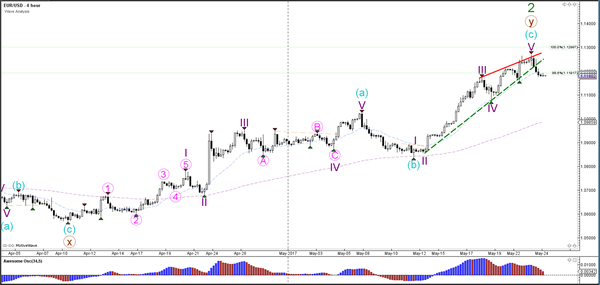
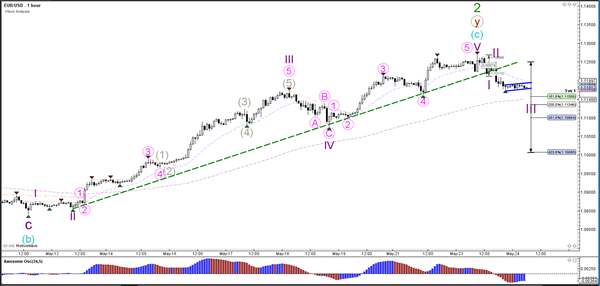
The EUR/USD seems to have completed the 5th waves (pink/purple) and price could either be retracing within the uptrend or starting a new downtrend. The wave count is showing a bearish 123 (purple) wave pattern, which would become more likely if price manages to break the bear flag (blue lines) and fall towards 1.11-1.1130. Otherwise the bearish price action runs the risk of being a correction which becomes likely if price manages to push above 1.1250.
Currency pair USD/JPY
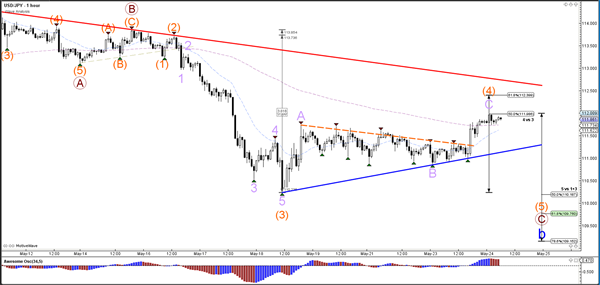
The USD/JPY broke the resistance trend line (dotted orange) and is approaching the -27.2% Fibonacci target. A bearish bounce could indicate a continuation of the downtrend but a break above 112-112.50 would indicate that the wave C (brown) of wave B (blue) is completed at the recent low.
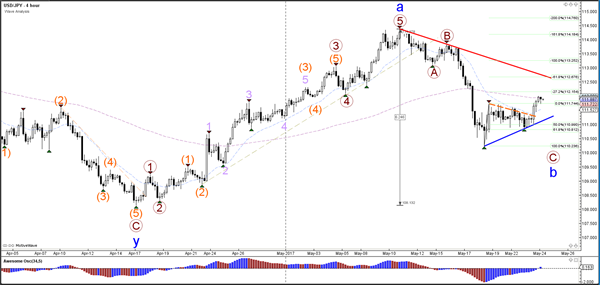
The USD/JPY is building a potential wave 4 (orange) correction and a wave 5 (orange) continuation before completing wave C (brown). However if price breaks above the 61.8% Fibonacci level of wave 4 (orange), then a different wave structure seems likely.
Currency pair GBP/USD
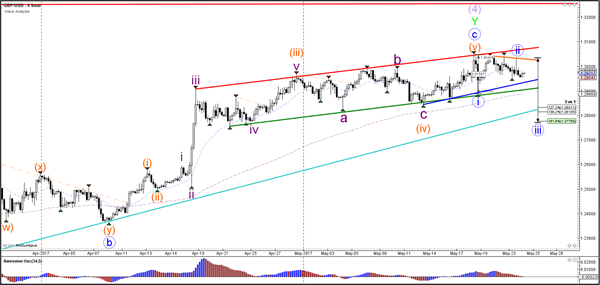
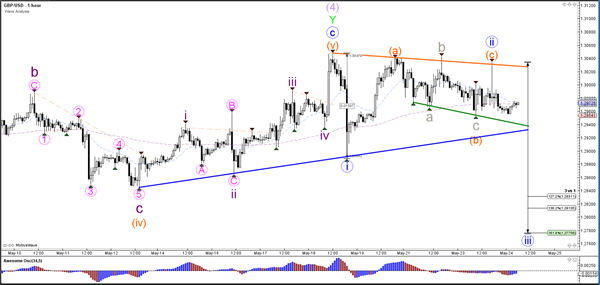
The GBP/USD has been unable to break above resistance (red/orange) levels which could mean that the Cable is still in a wave 1-2 (blue). A break above the orange trend line indicates the invalidation of wave 2 and the potential for an uptrend continuation whereas but a break below the channel support (green/blue) could see a reversal take place.
The GBP/USD has been unable to break above resistance (red/orange) levels which could mean that the Cable is still in a wave 1-2 (blue). A break above the orange trend line indicates the invalidation of wave 2 and the potential for an uptrend continuation whereas but a break below the channel support (green/blue) could see a reversal take place.
Daily Technical Outlook And Review: EUR/USD, GBP/USD, AUD/USD, USD/JPY, USD/CAD, USD/CHF, DOW 30, GOLD
A note on lower timeframe confirming price action...
Waiting for lower timeframe confirmation is our main tool to confirm strength within higher timeframe zones, and has really been the key to our trading success. It takes a little time to understand the subtle nuances, however, as each trade is never the same, but once you master the rhythm so to speak, you will be saved from countless unnecessary losing trades. The following is a list of what we look for:
- A break/retest of supply or demand dependent on which way you're trading.
- A trendline break/retest.
- Buying/selling tails ... essentially we look for a cluster of very obvious spikes off of lower timeframe support and resistance levels within the higher timeframe zone.
- Candlestick patterns. We tend to only stick with pin bars and engulfing bars as these have proven to be the most effective.
We typically search for lower-timeframe confirmation between the M15 and H1 timeframes, since most of our higher-timeframe areas begin with the H4. Stops are usually placed 1-3 pips beyond confirming structures.
EUR/USD
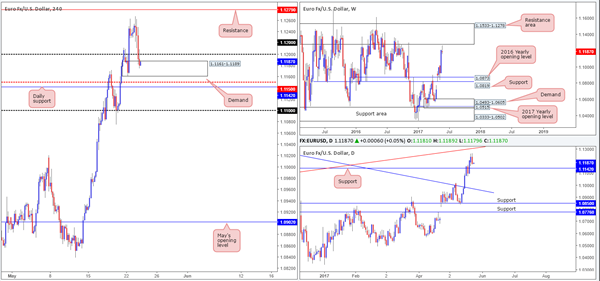
Kicking this morning's report off with a look at the weekly timeframe reveals that price recently came within striking distance of a formidable resistance area coming in at 1.1533-1.1278. As you can see, the pair responded bearishly and has, at the time of writing, chalked up a reasonably strong selling wick.
Moving down to the daily timeframe, the single currency was unable to challenge the trendline resistance etched from the low 1.0711, before turning south yesterday. This has placed the EUR nearby a neighboring support penciled in at 1.1142, which boasts strong historical significance noted all the way back to early 2015!
Looking over to the H4 timeframe, the recent selloff saw the market surpass the 1.12 handle going into yesterday's London close, which left price free to test demand at 1.1161-1.1189. We find this demand appealing due to the robust momentum seen from the base. However, buying from here is risky for several reasons. Firstly, the 1.12 handle could be a potentially troublesome resistance barrier to overcome. Secondly, not only do we have the H4 mid-level support at 1.1150 plotted a few pips below; we also have the said daily support lurking just below that. In addition to this, let's remember where weekly price is trading FROM (see above)!
Our suggestions: From our perspective, we do not see a lot to hang our hat on at the moment. Entering long is not really something we would advise for reasons stated above. And playing this market short, knowing that we're trading within H4 demand that sits above a daily support, is also just as risky we believe.
Therefore, we feel remaining on the sidelines may very well be the better path to take for the moment.
Data points to consider: ECB President Draghi speaks at 1.45pm. FOMC meeting minutes at 7pm, FOMC member Kaplan speaks at 11pm GMT+1.
Levels to watch/live orders:
- Buys: Flat (stop loss: N/A).
- Sells: Flat (stop loss: N/A).
GBP/USD
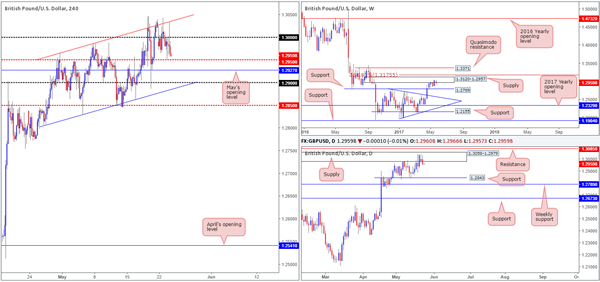
In recent trading, the GBP/USD crossed below the large psychological handle 1.30 and is now seen within shouting distance of the H4 mid-level support at 1.2950. The UK Prime Minister Theresa May recently came out and stated that the UK's terror threat level has been raised to critical, which undoubtedly helped push the GBP lower. With that being said though, we can also see that the technical landscape indicates further selling could be on the cards. The pair remains trading within the walls of a weekly supply base drawn from 1.3120-1.2957, and daily action continues to trade around supply seen within the said weekly supply at 1.3058-1.2979.
Our suggestions: While we believe the bears will continue to drive lower, selling knowing that price is lurking just ahead of 1.2950, followed closely by May's opening level at 1.2927, is just too risky for our liking.
The nearest support target seen on the higher timeframes at the moment is the daily support coming in at 1.2843. This sits just below the H4 mid-level support at 1.2850. In the event that price reaches the H4 channel support etched from the low 1.2804, there's a good chance that we'll witness a rotation from here. At the same time though, one should also expect a possible fakeout down to 1.2850 given its connection with the said daily support before we see serious buyers step in here.
Data points to consider: FOMC meeting minutes at 7pm, FOMC member Kaplan speaks at 11pm GMT+1.
Levels to watch/live orders:
- Buys: Currently have our eye on longs around the H4 channel support taken from the low 1.2804.
- Sells: Flat (stop loss: N/A).
AUD/USD
(Trade update: Stopped out for a loss at 0.7490).
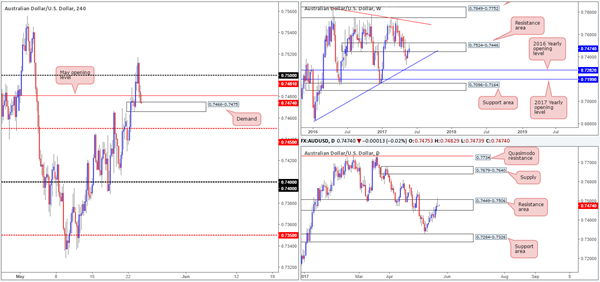
Unable to sustain gains beyond the 0.75 handle yesterday, the commodity currency turned lower and ended the day closing below May's opening level at 0.7481. What's also notable from a technical perspective is that H4 price is now seen trading within the confines of a small demand base drawn from 0.7466-0.7475.
Over on the bigger picture, the weekly resistance area at 0.7524-0.7446 remains in play, as does the daily resistance zone which is seen housed within the said weekly area at 0.7449-0.7506. Also of interest here is the daily selling wick printed during yesterday's segment.
Our suggestions: Entering long from the current H4 demand is not really something our desk would be comfortable with in light of the higher-timeframe structure. So, with that in mind, we are expecting this H4 area to give way at some point during the day and see price challenge the H4 mid-level support pegged at 0.7450. It would only be upon seeing a decisive H4 close beyond 0.7450 would the team become interested in shorts.
While there are two H4 demands located below this number seen marked with green circles around 0.7440/0.7416, we believe these areas will easily be consumed and price will at least achieve the 0.74 handle, as let's not forget that we have higher-timeframe sellers currently in the game!
As a result, a close below 0.7450 and a retest as resistance, followed by a reasonably sized H4 bearish candle (preferably a full-bodied candle), would have us looking to short, targeting 0.74.
Data points to consider: FOMC meeting minutes at 7pm, FOMC member Kaplan speaks at 11pm GMT+1.
Levels to watch/live orders:
- Buys: Flat (stop loss: N/A).
- Sells: Watch for H4 price to engulf 0.7450 and then look to trade any retest seen thereafter ([waiting for a H4 bearish candle to form following the retest is advised] stop loss: ideally beyond the candle's wick).
USD/JPY
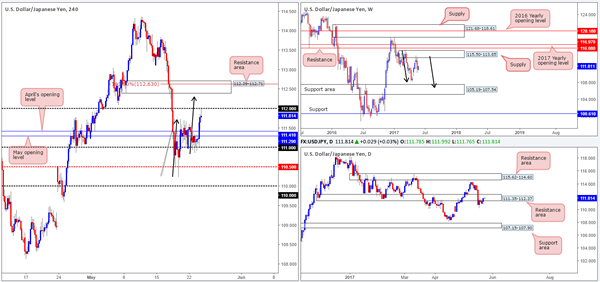
With US bond yields advancing, we saw the USD/JPY bulls go on the offensive yesterday from the 111 handle. The move took out May/April's opening levels at 111.29/111.41 and has recently seen the pair challenge the 112 handle. Although the bulls do look incredibly strong at the moment, it might be worth noting that daily price is seen trading within a resistance area at 111.35-112.37. In addition to this, there's a H4 AB=CD pattern that terminates between 112 and a H4 resistance area coming in at 112.39-112.71.
Our suggestions: Given that this H4 resistance area converges closely with the AB=CD pattern, we are interested in shorting from here. More specifically, we are interested in selling from the H4 AB=CD 161.8% Fib ext. at 112.63, with stops planted at 112.81 (this gives us 10 pips breathing space above the current H4 area).
Data points to consider: FOMC meeting minutes at 7pm, FOMC member Kaplan speaks at 11pm GMT+1.
Levels to watch/live orders:
- Buys: Flat (stop loss: N/A).
- Sells: 112.63 ([pending order] stop loss: 112.81).
USD/CAD
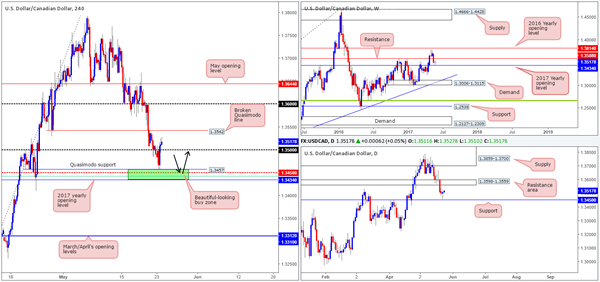
For those who read Tuesday's report you may recall our desk highlighting that a pending buy order was placed at 1.3548 with a stop set at 1.3408. Our rationale behind setting this order was due to a very appealing H4 buy zone seen marked in green at 1.3434/1.3457. This area boasted a H4 Quasimodo support at 1.3457, a H4 61.8% Fib support at 1.3441 taken from the low 1.3223 (green line), a H4 mid-level support at 1.3450 which also happens to represent daily support and the 2017 yearly opening level seen on the weekly chart at 1.3434.
As you can see, our order was filled yesterday and price has rallied beyond the 1.35 handle. We took 50% off the table around 1.35 and reduced risk to breakeven, so we're effectively in a free trade right now. Our next port of call is 1.3542: a H4 broken Quasimodo line. And then beyond here we have our eye on the 1.36 handle. Price, however, may struggle to reach 1.36, since before this number we have to contend with a daily resistance area at 1.3598-1.3559 and a weekly resistance level at 1.3588.
Well done to any of our readers who managed to join us on this trade.
Data points to consider: FOMC meeting minutes at 7pm, FOMC member Kaplan speaks at 11pm GMT+1. BoC Rate statement at 3pm, Crude oil inventories at 3.30pm GMT+1.
Levels to watch/live orders:
- Buys: 1.3458 ([pending order] stop loss: Breakeven).
- Sells: Flat (stop loss: N/A).
USD/CHF
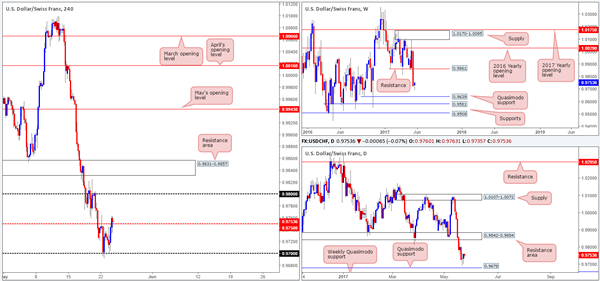
With the EUR/USD selling off during yesterday's segment, USD/CHF bulls found another pocket of bids around the 0.97 handle. Rallying to a high of 0.9763 and closing above the H4 mid-level resistance at 0.9750, the pair now looks poised to continue north and test the 0.98 handle. The bigger picture also indicates that there's room to advance north, with the closest resistance not coming into view until 0.9842-0.9884: a daily resistance area that houses a weekly resistance level at 0.9861.Should 0.9750 hold firm as support today, this could be a reasonably logical platform in which to look for a long setup from, targeting 0.98, followed closely by the H4 resistance area at 0.9831-0.9857.
Our suggestions: Personally, we'll need to see not only H4 price hold firm around 0.9750, but we'd also like to see a lower-timeframe buy setup (see the top of this report) before pulling the trigger.
Data points to consider: FOMC meeting minutes at 7pm, FOMC member Kaplan speaks at 11pm GMT+1.
Levels to watch/live orders:
- Buys: 0.9750 region ([waiting for a lower-timeframe buy signal to form before pulling the trigger is advised] stop loss: dependent on where one confirms the area).
- Sells: Flat (stop loss: N/A).
DOW 30
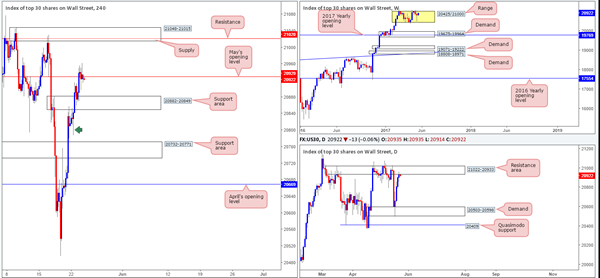
As can be seen from the H4 chart, US equities were slightly more subdued on Tuesday as price spent the day seesawing around May's opening level at 20929. With daily price now teasing the underside of a resistance area at 21022-20933, and weekly action heading towards the top edge of its current range at 20425 (yellow area), we believe the bears may make an appearance soon. While this may be the case, shorting is risky seeing as how there's a H4 support area plotted nearby at 20882-20849.
Our suggestions: Wait for H4 price to close below the current H4 support area. Once/if this occurs, then we see little stopping price from trading down to the H4 support area coming in at 20732-20771, followed by April's opening level at 20669. The reason for not including the H4 demand base seen below around the 20816ish area simply comes down to the large H4 demand consumption tail seen marked with a green arrow at 20788.
Data points to consider: Several FOMC members set to take the stage at different times today.
Levels to watch/live orders:
- Buys: Flat (stop loss: N/A).
- Sells: Watch for H4 price to engulf 20882-20849 and then look to trade any retest seen thereafter ([waiting for a H4 bearish candle to form following the retest is advised] stop loss: ideally beyond the candle's wick).
GOLD
(Trade update: Closed the remainder of our long position at 1257.8).
Gold prices pulled back yesterday as the dollar recovered from lows of 96.80. Leaving the H4 61.8% Fib resistance at 1264.5 (green line) extended from the high 1295.4 unchallenged, the yellow metal sold off from H4 supply at 1268.3-1262.7. The move, as you can see, brought bullion down to within striking distance of March/April's opening levels at 1245.9/1248.0. Whether these lines can hold the market higher for a second time is difficult to judge, since there are daily sellers likely in play now from the resistance area drawn from 1265.2-1252.1. Also noteworthy here is the daily bearish engulfing candle printed yesterday!
Our suggestions: With the above information in mind, where does this leave us in terms of potential setups? Well, we do not really favor a second bounce from the above said H4 monthly levels knowing that daily sellers could drag price below here. And selling would be highly risky without a decisive H4 close seen beyond these two monthly levels. But even then, the bears would have to contend with the H4 trendline support etched from the high 1278.0.
Therefore, opting to stand on the sidelines here may very well be the better path to take today.

Levels to watch/live orders:
- Buys: Flat (stop loss: N/A).
- Sells: Flat (stop loss: N/A).
European Open Briefing: Markets Were Surprised By A Downgrade Of China’s Credit Rating By Moody’s
Global Markets:
- Asian stock markets: Nikkei up 0.55 %, Shanghai Composite fell 0.40 %, Hang Seng declined 0.15 %, ASX 200 gained 0.05 %
- Commodities: Gold at $1251 (-0.30 %), Silver at $16.98 (-0.90 %), WTI Oil at $51.60 (+0.20 %), Brent Oil at $54.25 (+0.20 %)
- Rates: US 10-year yield at 2.28, UK 10-year yield at 1.08, German 10-year yield at 0.41
News & Data
- Japan Reuters Tankan Index May: 24 (prev 26)
- Australian Construction Work Done (QoQ) Q1: -0.7% (exp -0.5%; prev -0.2%)
- New Zealand Trade Balance (MoM) (NZD) Apr: 578M (prev 332M)
- New Zealand Trade Balance (YoY) (NZD) Apr: -3.481B (prev -3.67B)
- New Zealand Exports (NZD) Apr: 4.75B (prev 4.65B)
- New Zealand Imports (NZD) Apr: 4.17B (prev 4.31B)
- Fed's Harker: Repeats Support for Shedding Bonds This Year and Two More Rate Hikes This Year
- Fed's Harker: Labour Market Has Very Little Slack Left
- Fed's Harker: Fed Will Adjust Pace of Rate Hikes If Needed
- Fed's Harker: June Rate Hike 'A Distinct Possibility'
Markets Update:
Markets were surprised by a downgrade of China's credit rating by Moody's. The rating agency lowered China's rating from A1 to AA3 and the outlook from “stable” to “negative”. This put stocks in Asia under pressure, especially in Shanghai and Hong Kong.
The announcement had also an effect on the FX market. The Australian Dollar declined, as Australia's economy is quite sensitive to developments in China. AUD/USD fell from 0.7480 to a low of 0.7480. The breakout in the pair now looks like a false one, and losses could extend to 0.7380, where the next notable support level lies.
This put also some pressure on the New Zealand Dollar, which fell despite better than expected trade data, which showed a solid increase in exports. NZD/USD declined from 0.7040 to 0.70.
The Euro retraced some of the recent gains, amid broad USD strength in the market. A break below 1.1170 support would indicate that EUR/USD could fall back to 1.11 soon.
This evening, the Federal Reserve will publish its latest meeting minutes. The central bank is likely to signal a rate hike in June. Given that the market is already expecting that, the release will likely be a non-event.
Upcoming Events:
- 13:45 BST – ECB President Draghi speaks
- 15:00 BST – US Existing Home Sales
- 15:00 BST – Bank of Canada Rate Decision
- 15:30 BST – US Crude Oil Inventories
- 19:00 BST – FOMC Meeting Minutes
The Euro Could Be Moving Into The Final Stages Of An Elliot Wave
Key Points:
- An Elliot wave could spell near-term losses for the EUR.
- A number of technical readings are now bearish.
- Medium to long-term bias remains bullish.
The Euro's most recent surge higher is beginning to show signs of cracking as the bears are now putting up a bit of a fight. Indeed, last session's slip could be the start of a rather pronounced tranche of losses that may see the pair back down at around the 1.0971 level. Although, things aren't altogether grim as this may actually be a necessary correction in the Euro's journey all the way back to last year's highs.
Firstly, let's take a look at just why a reversal and subsequent slip back to support is warranted. One vital reason to suspect a change in bias is the stochastic oscillator which is clearly overbought. However, given that this has been the case for some time, it alone is unlikely to convince the bulls to give up the ghost just yet. Fortunately, if we focus in on the last two candles it also becomes clear that we have either a tweezer top or bearish engulfing taking place which would also suggest losses are now on the way.
Incidentally, this bearish reversal is occurring at around the right price for an Elliott wave’s third leg to complete. As shown above, the recent spate of gains has stalled at the 1.1233 mark which had been a likely candidate level for a reversal given the historical resistance present at this price. Importantly, this leads us into the second part of our forecast which is concerned with how far we expect to see the EUR tumble and how high we expect the following rally to carry the pair.
Currently, it is assumed that any near-term decline could reach as low as the 1.0971 mark before the bulls regain control. Such a tumble would be appropriate for the above Elliott wave and would also respect the 38.2% Fibonacci level. As a result, it would in all likelihood require a major fundamental upset to see support at this level broken, especially as the 100 day EMA will be a source of dynamic support around this price.
Due to the relative robustness of the forecasted support level, we remain tentatively optimistic that a secondary reversal would occur around here. This should, in turn, lead into a period of gains for the EURUSD which might extend as high as the 1.1354 mark by late July. Bullishness beyond this level is currently doubtful as we would then begin to stray into the highs of last year which may prove to be a medium to long-term limit amid the ongoing Brexit fears.
Ultimately, even if the long-term bias is incorrect, the near-term slip is looking rather likely. As mentioned, the combination of being overbought and the historic zone of resistance around the 1.1233 level should be more than a match for the already exhausted bulls. However, as always, keep an eye on the fundamental side of things as the ECB has been toying with the idea of raising rates as early as June which could prematurely end the forecasted downtrend.
GBP/JPY Daily Outlook
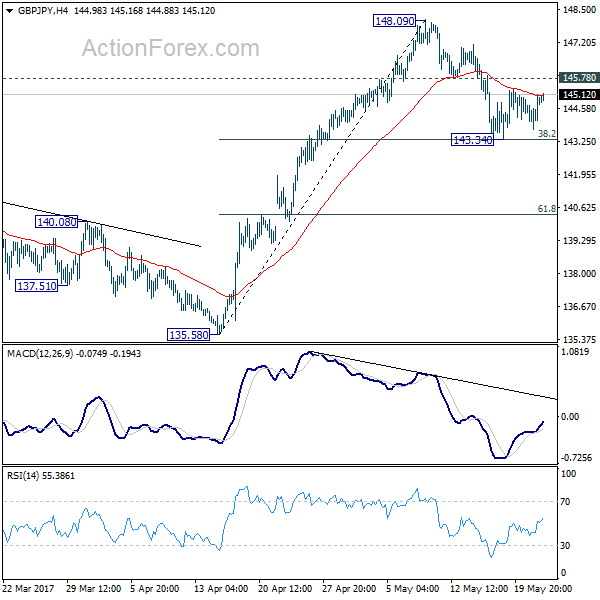
Daily Pivots: (S1) 144.05; (P) 144.60; (R1) 145.43; More....
Intraday bias in GBP/JPY is still neutral at this point. The corrective pattern from 148.09 short term top could extend. On the upside, above 145.78 will turn bias back to the upside for retesting 148.09 first. Meanwhile, break of 143.34 will extend the pull back from 148.09 to 61.8% retracement at 140.35. Overall, we'd still expect the rise from 122.36 to resume after pull back from 148.09 completes. Break of 148.09 will target 150.42 long term fibonacci level first.
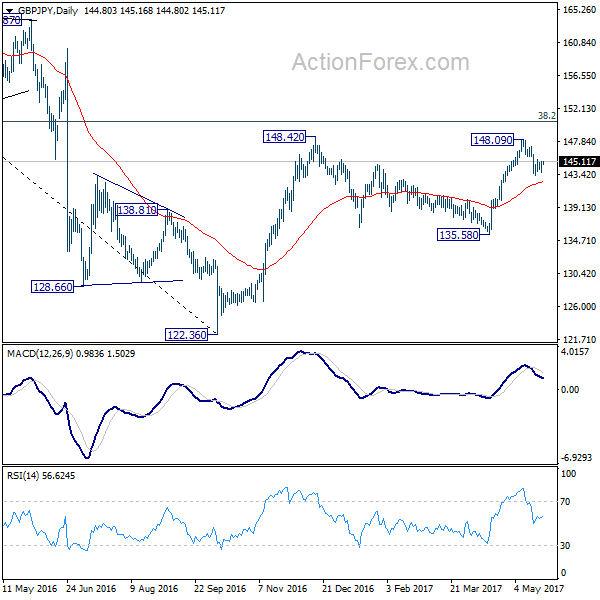
In the bigger picture, based on current momentum, rise from 122.36 bottom should be developing into a medium term move. Break of 38.2% retracement of 195.86 to 122.36 at 150.42 should pave the way to 61.8% retracement at 167.78. This will now be the favored case as long as 135.58 support holds.
EUR/JPY Daily Outlook
Daily Pivots: (S1) 124.57; (P) 124.97; (R1) 125.39; More...
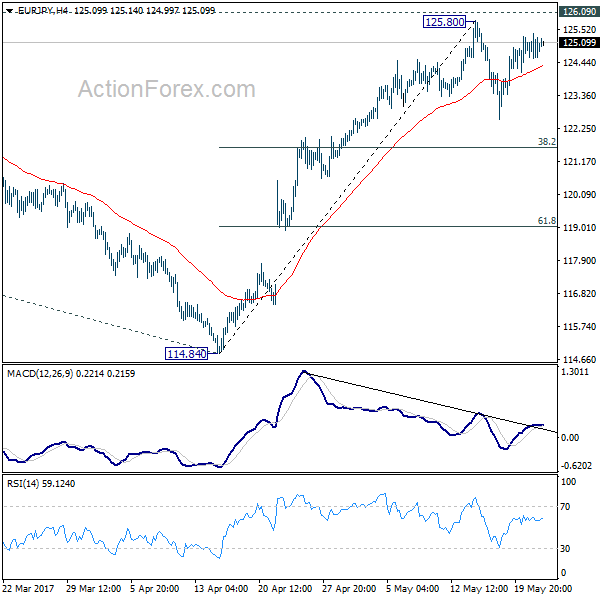
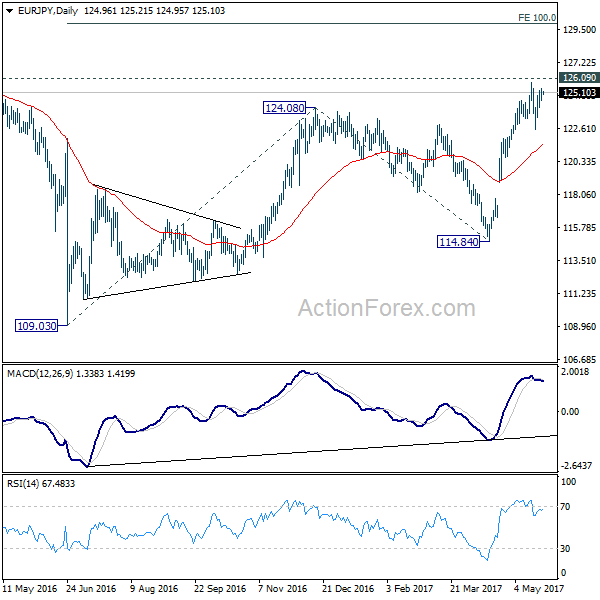
EUR/JPY is still bounded in the consolidation pattern from 125.80 and intraday bias remains neutral. Another fall could be seen but downside should be contained by 38.2% retracement of 114.84 to 125.80 at 121.61 to bring rise resumption. We're staying mildly bullish in the cross. And, break of 126.09 key resistance will extend the whole rebound from 109.03 to 100% projection of 109.03 to 124.08 from 114.84 at 129.89.
In the bigger picture, focus is back on 126.09 support turned resistance. Decisive break there will confirm completion of the down trend from 149.76. And in such case, rise from 109.20 is at the same degree and should target 141.04 resistance and above. Meanwhile, rejection from 126.09 and break of 114.84 will extend the fall from 149.76 through 109.20 low.