
Sample Category Title
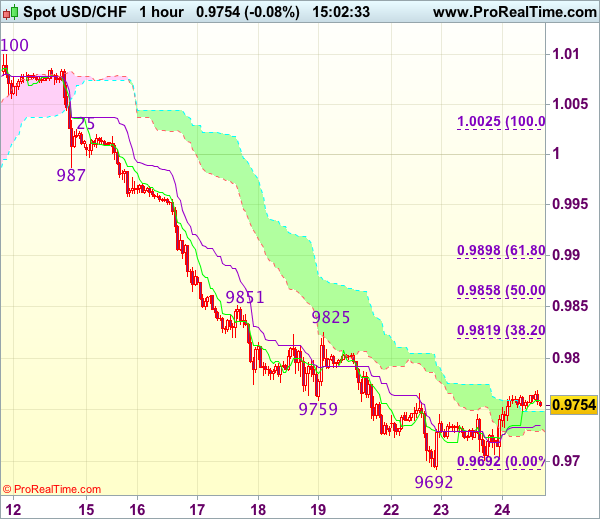
Trade Idea : USD/CHF – Hold long entered at 0.9700
USD/CHF - 0.9754
Most recent candlesticks pattern : N/A
Trend : Near term down
Tenkan-Sen level : 0.9759
Kijun-Sen level : 0.9735
Ichimoku cloud top : 0.9749
Ichimoku cloud bottom : 0.9729
Original strategy :
Bought at 0.9700, Target: 0.9800, Stop: 0.9690
Position : - Long at 0.9700
Target : - 0.9800
Stop : - 0.9690
New strategy :
Hold long entered at 0.9700, Target: 0.9800, Stop: 0.9700
Position : - Long at 0.9700
Target : - 0.9800
Stop : - 0.9700
As the greenback has rebounded after holding above this week’s low at 0.9692, retaining our view that further consolidation above this level would be seen and mild upside bias remains for another rebound to 0.9790-00, however, break of resistance at 0.9825 is needed to low is formed, bring retracement of recent decline to previous resistance at 0.9851 which is likely to hold from here.
In view of this, we are holding on to our long position entered at 0.9700. Below said support at 0.9692 would signal recent decline has resumed and extend weakness to 0.9670-75 but reckon downside would be limited to 0.9650 and 0.9620-25 should hold, bring another rebound later.
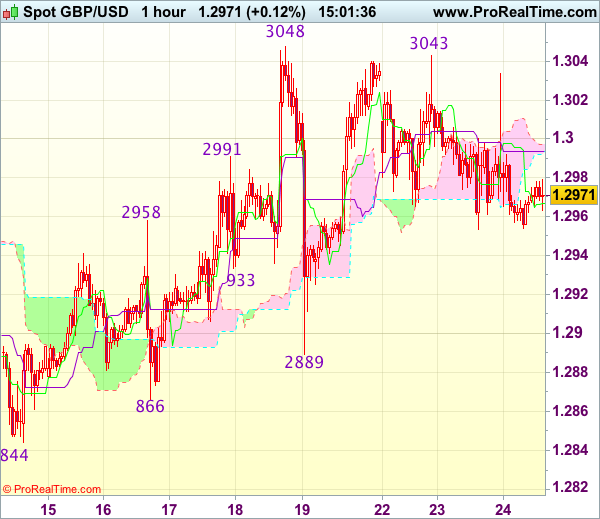
Trade Idea : GBP/USD – Stand aside
GBP/USD - 1.2972
Most recent candlesticks pattern : N/A
Trend : Near term up
Tenkan-Sen level : 1.2969
Kijun-Sen level : 1.2994
Ichimoku cloud top : 1.2997
Ichimoku cloud bottom : 1.2994
New strategy :
Stand aside
Position : -
Target : -
Stop : -
Cable’s retreat after faltering below indicated resistance at 1.3048 (last week’s high) has retained our view that further choppy trading below this level would be seen and pullback to 1.2950 cannot be ruled out, however, reckon downside would be limited to 1.2920-25 and said support at 1.2889 should remain intact, bring another rebound later.
On the upside, although recovery to 1.3000-10 cannot be ruled out, reckon said resistance at 1.3048 would hold, bring further consolidation. Only a break of said resistance at 1.3048 would confirm recent upmove has resumed an extend further gain to 1.3075-80 and possibly towards 1.3100-10 later. As near term outlook is mixed, would be prudent to stand aside in the meantime.
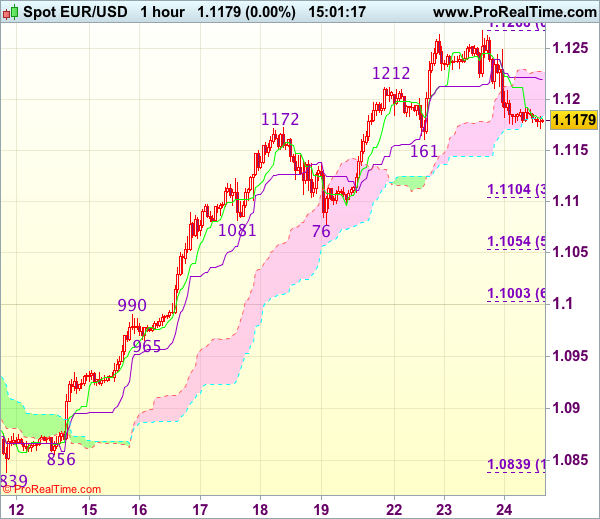
Trade Idea : EUR/USD – Stand aside
EUR/USD - 1.1178
Most recent candlesticks pattern : N/A
Trend : Up
Tenkan-Sen level : 1.1182
Kijun-Sen level : 1.1220
Ichimoku cloud top : 1.1227
Ichimoku cloud bottom : 1.1183
New strategy :
Stand aside
Position : -
Target : -
Stop : -
Despite yesterday’s marginal rise to 1.1268, the subsequent retreat suggests a temporary top is possibly formed and test of support at 1.1161 cannot be ruled out, however, break there is needed to add credence to this view, bring further fall to 1.1130 but reckon downside would be limited to 1.1100-05 (38.2% Fibonacci retracement of 1.0839-1.1268) and price should stay well above support at 1.1076, bring rebound later.
On the upside, whilst recovery to 1.1200 cannot be ruled out, reckon the Kijun-Sen (now at 1.1220) would limit upside and 1.1250 should hold, bring retreat later. Only break of said resistance at 1.1268 would extend recent upmove to extend further gain to 1.1280-85 (61.8% projection of 1.0839-1.1172 measuring from 1.1076) and possibly towards 1.1300-10.
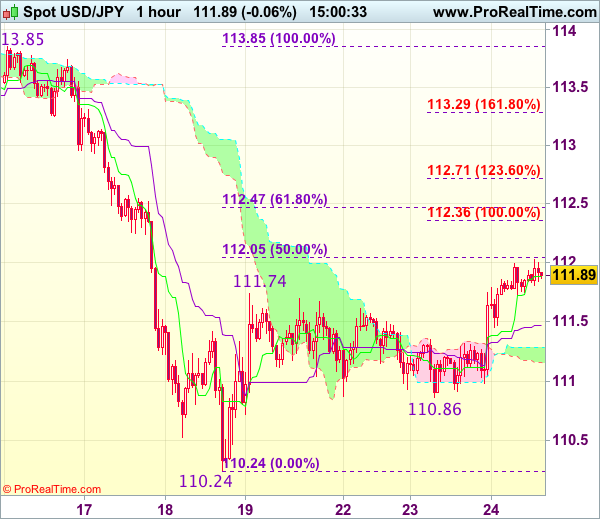
Trade Idea : USD/JPY – Sell at 112.40
USD/JPY - 111.84
Most recent candlesticks pattern : N/A
Trend : Near term down
Tenkan-Sen level : 111.88
Kijun-Sen level : 111.47
Ichimoku cloud top : 111.28
Ichimoku cloud bottom : 111.16
Original strategy :
Sell at 112.05, Target: 110.85, Stop: 112.40
Position : -
Target : -
Stop : -
New strategy :
Sell at 112.40, Target: 111.00, Stop: 112.75
Position : -
Target : -
Stop : -
The greenback has rebounded after holding above support at 110.86, suggesting near term upside risk remains for the corrective rise from 110.24 low to extend gain to 112.05 (50% Fibonacci retracement of 113.85-110.24), then 112.36 (100% projection of 110.4-11174 measuring from 110.86) but upside should be limited to 112.45-50 (61.8% Fibonacci retracement) and bring another decline later, below 111.30-35 would bring test of said support at 110.86 but break there is needed to signal the rebound from 110.24 has ended, bring further fall to 110.50 first.
In view of this, would be prudent to sell dollar on further subsequent recovery as 112.45-50 should limit upside and bring another decline. Above 112.70-75 would abort and signal recent decline has ended, bring further gain to 113.00.
AUD/JPY Candlesticks and Ichimoku Analysis
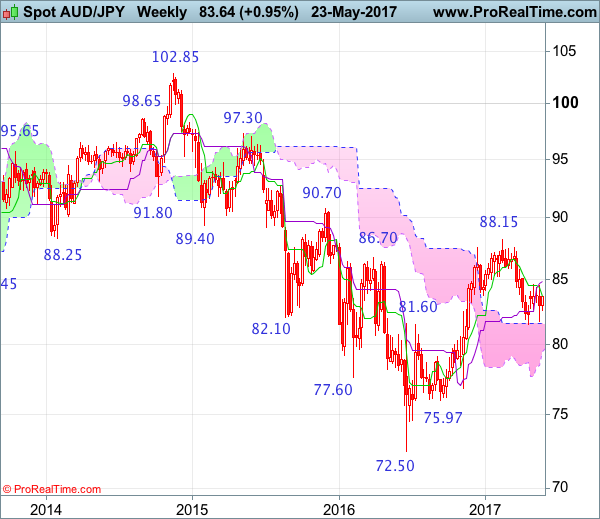
Weekly
• Last Candlesticks pattern: Shooting star
• Time of formation: 13 Mar 2017
• Trend bias: Down
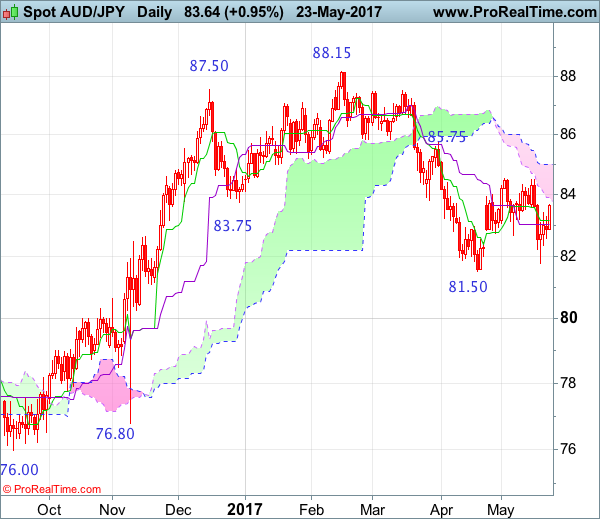
Daily
• Last Candlesticks pattern: Bearish engulfing pattern
• Time of formation: 16 Feb 2017
• Trend bias: Near term down
The Australian dollar did falter below indicated resistance at 84.55 and retreated in line with our bearish expectation, retaining our downside bias and below last week’s low at 81.80 would signal the rebound from 81.50 has ended, bring retest of this level first. A drop below this level would extend recent decline from 88.15 top to support at 81.10-15, however, near term oversold condition should limit downside and reckon 80.00 psychological support would hold from here, bring rebound later.
On the upside, whilst initial recovery to the lower Kumo (now at 83.90) cannot be ruled out, as long as said resistance at 84.55 holds, prospect of another decline to aforesaid downside targets remains. Only a break above said resistance at 84.55 would abort and suggest low is formed instead, risk a stronger rebound to 85.00-10 but said resistance at 85.75 should remain intact, bring another decline later.
Recommendation: Hold short entered at 83.65 for 81.65 with stop above 84.65.
On the weekly chart, as aussie has remained confined within near term range, suggesting further sideways trading would be seen, however, still reckon resistance at 84.55 would cap upside and bring another decline later, below last week’s low at 81.80 would signal the rebound from 81.50 has ended, bring retest of this level later. A drop below this level would extend the fall from 88.15 top to support at 81.10-15, a weekly close below there would retain bearishness and suggest the rise from 72.50 has ended, then further fall to 80.50 and possibly psychological support at 80.00 would follow.
On the upside, expect recovery to be limited to the Tenkan-Sen (now at 83.63) and bring another decline. A weekly close above resistance at 84.55 would suggest low is formed instead, bring a stronger rebound to 85.00, then towards resistance at 85.75 but only break there would abort and signal low is formed instead, bring further subsequent gain to 86.00 and then 86.50-60, however, price should falter below resistance at 87.50.
AUD/USD Candlesticks and Ichimoku Analysis
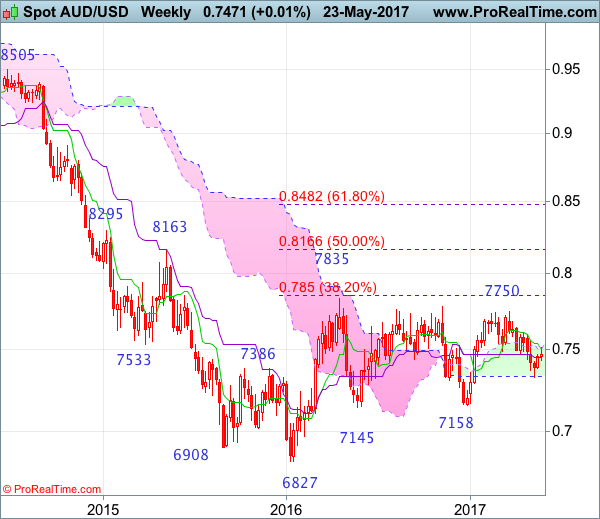
Weekly
• Last Candlesticks pattern: Shooting doji
• Time of formation: 20 Feb 2017
• Trend bias: Sideways
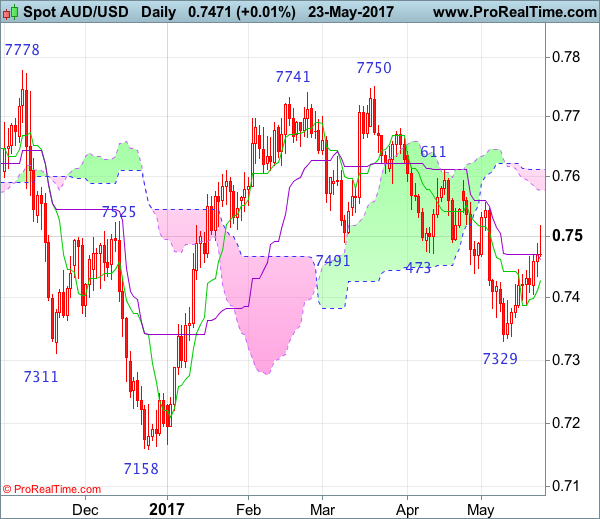
Daily
• Last Candlesticks pattern: Bearish engulfing pattern
• Time of formation: 21 Mar 2017
• Trend bias: Near term down
Although aussie has risen again after finding support just above the Tenkan-Sen and near term upside risk remains for the rebound from 0.7329 to extend gain towards previous resistance at 0.7556 but only break there is needed low has been formed at 0.7329, bring further rise to another previous resistance at 0.7611, having said that, aussie needs to break this level to signal the fall from 0.7750 top has ended bring subsequent rise towards resistance at 0.7680.
On the downside, below the Tenkan-Sen (now at 0.7428) would bring weakness to 0.7388 support but break there is needed to signal the rebound from 0.7329 has ended, bring retest of this level, break there would extend recent fall from 0.7750 top to 0.7300 and possibly 0.7250-60 but reckon downside would be limited to 0.7200-10 and price should stay well above indicated previous chart support at 0.7158, bring rebound later.
Recommendation: Hold short entered at 0.7440 for 0.7240 with stop above 0.7540.
On the weekly chart, after forming a hammer candlestick pattern earlier this month, last week’s rebound formed a white candlestick, suggesting low has possibly been formed there and consolidation with mild upside bias is seen for gain to 0.7560-65, however, break of previous resistance at 0.7611 is needed to add credence to this view, bring further gain towards resistance at 0.7680, having said that, price should falter below said resistance at 0.7750.
On the downside, although pullback to the Kijun-Sen (now at 0.7454) is likely, reckon downside would be limited to 0.7384 support (last week’s low), bring another rebound later. Only a weekly close below there would signal the rebound from 0.7329 has ended, bring retest of this level, break there would extend recent decline from 0.7750 to 0.7290-00 and possibly towards 0.7230, however, downside should be limited to 0.7200 and price should stay well above previous support at 0.7158, risk from there is seen for a rebound to take place later.
Research US: Trump’s Budget Seems Dead On Arrival In Congress – Do Not Expect Too Much Of Trumponomics
Yesterday, the Trump administration released the long-awaited budget for the fiscal year 2018 and the administration's priorities for the next 10 years. The Trump administration expects to eliminate the government deficit by 2027 due to a combination of higher GDP growth (3% per year) and large welfare spending cuts.
We think it is unlikely the supply-side effects from Trump's economic policy (deregulation, tax reform,infrastructure investments) will increase GDP growth to 3% even if fully implemented.
The budget reflects the Trump administration's expectation of full implementation of its policy proposals,which we think is unlikely given the disagreement within the Republican Party. Although all Republicansshare the same goal to cut and simplify taxes, they disagree on the financing. While moderate Republicansdo not want to make big cuts in other parts of the budget, fiscal hawks do not want to increase thegovernment budget deficit/debt to finance this. Thus, we may see a repetition of the Republicans'difficulties to change Obamacare.
We do not expect the US Congress to pass a new budget before the fiscal year starts on 1 October, henceCongress likely needs to pass a short-term funding bill to keep the US government running. This alsomeans there is a risk of a government shutdown by 1 October –also note that the US Treasury exhausts itsextraordinary measures during the autumn and Congress has still not found a solution to the debt limitissue.
We maintain our long-held view that Trumponomicswill come later and be smaller than pledged. We do notexpect a deal on tax reform before end of the year, at the earliest.
The G7 Summit In Italy Will Be Held On Friday And Saturday
Market movers today
US durable goods orders will include the core capital goods orders, which is a good proxy for corporate investments. Core orders have moved higher since the middle of last year. The past months have shown somewhat slower momentum. The numbers today will show whether this was just a small pause or whether the loss of momentum is real. We expect investment growth to be robust this year based on strong earnings growth from the beginning of the year and improved sentiment among companies.
The US is due to release revised figures for Q1 GDP as well as for May consumer confidence from the University of Michigan. We do not expect any big revisions to these numbers.
The G7 Summit in Italy will be held on Friday and Saturday. It will be the first summit for US President Donald Trump, Brit ish Prime Minster Theresa May, French President Emmanuel Macron and Italian Prime Minister Paolo Gent iloni. The summit will among other things focus on the global economy and foreign policy. Issues such as protectionism, North Korea, the fight on terror and climate change are likely to be on the agenda.
In Norway, the important Q2 oil investment survey is due out (please see Scandi sect ion for more details).
Selected market news
This morning, emerging Asian currencies and stocks are trading on cautious note following the Moody's downgrade of China's credit rating, which hurt the out look for the region's t radedependent economies. Moody's cut China's rating to A1 from Aa3, citing a worsening out look for the nation's financial strength. We have in recent months pointed to the increasing stress symptoms in the Chinese financial markets and an imminent slowdown in the economy as the Chinese authorities seek to rein in the debt problems in the economy.
Yesterday, the Trump administ ration released its long-awaited budget for the fiscal year 2018 and the administ ration's priorit ies for the next 10 years. The Trump administ ration expects to eliminate the government deficit by 2027 due to a combination of higher GDP growth (3% per year) and large welfare spending cuts. The budget does not contain significant new details on tax reforms than the already known overall principles. We think it is going to be very difficult for the Trump administ ration to get the budget through the US Congress given the divisions in the Republican party and more generally we maintain our longheld view that Trumponomics will come later and be smaller than pledged. See Research US: Trump's budget seem s dead on arrival in Congress –do not expect too much of Trumponomics, 24 May 2017.
Aussie Dollar Trading Lower In The Asian Session
For the 24 hours to 23:00 GMT, the AUD rose 0.38% against the USD and closed at 0.7481.
On the economic front, Australia’s Westpac leading index declined 0.12% in April, from an increase of 0.08% reported in March. Additionally, the nation’s Q1 construction work done showed a bigger than expected fall, compared to revised 0.6% rise in the previous quarter.
LME Copper prices declined 0.29% or $16.5/MT to $ 5660.5/MT. Aluminium prices declined 0.87% or $17.0/MT to $ 1926.0/MT.
In the Asian session, at GMT0300, the pair is trading at 0.7452, with the AUD trading 0.39% lower against the USD from yesterday’s close.
The pair is expected to find support at 0.7427, and a fall through could take it to the next support level of 0.7402. The pair is expected to find its first resistance at 0.7497, and a rise through could take it to the next resistance level of 0.7542.
The currency pair is trading below its 20 Hr and 50 Hr moving averages.

Euro Trading Slightly Lower, Ahead Of Mario Draghi’s Speech
For the 24 hours to 23:00 GMT, the EUR declined 0.48% against the USD and closed at 1.1186.
Macroeconomic data showed that manufacturing PMI recorded an unexpected rise to a level of 57.0 in May in the Eurozone, against market expectations for the index to drop to 56.5, following a reading of 56.7 in the previous month. However, the services activity in the region eased to a two-month low of 56.2 from 56.4 reported in April, compared to expectations for an unchanged reading.
Elsewhere, in Germany, the region's powerhouse economy, the seasonally adjusted final gross domestic product (GDP) rose 0.6% on a quarterly basis in 1Q 2017, in line with market expectations. The preliminary figures had also indicated a rise of 0.6%, following an advance of 0.4% in the prior quarter.
Moreover, the manufacturing PMI in Germany unexpectedly rose to 59.4 in May, compared to a reading of 58.2 in the last month. Markets were anticipating manufacturing PMI to decline to a level of 58.0. Additionally, the nation's services activity unexpectedly slid to a level of 55.2 in May, from a reading of 55.4 reported in the previous month. Market anticipation was for services PMI to climb to a level of 55.5.
In other news, the German Ifo business climate index reached to a level of 114.6 in May from a revised prior reading of 113.0. Investors were expecting the index to climb to 113.1. Also, the Ifo current assessment index in the nation advanced unexpectedly to a level of 123.2 in the same month, compared to market expectations of a fall to a level of 121.0, after a revised reading of 121.4 in the previous month.
The greenback traded higher against its peers, after the nation's services PMI climbed to a four-month high in May with a reading of 54.0, which was above market forecasts of 53.2. In the prior month, the index had reported a level of 53.1. On the other hand, Markit flash manufacturing PMI surprisingly declined to 52.5 in May from 52.8 recorded in April, slipping to its lowest level in eight months. Markets were expecting the index to rise to 53.0.
Separately, sales of newly constructed homes fell 11.4% on a monthly basis in April to a seasonally adjusted annual rate of 569.0k, which was below analysts' estimates of a drop to 610.0k. In the previous month, news home sales had posted a reading of 642.0k.
In the Asian session, at GMT0300, the pair is trading at 1.1183, with the EUR trading a tad lower against the USD from yesterday's close.
The pair is expected to find support at 1.1149, and a fall through could take it to the next support level of 1.1116. The pair is expected to find its first resistance at 1.1242, and a rise through could take it to the next resistance level of 1.1302.
Going forward, investors will await a speech by the ECB President, Mario Draghi, scheduled later in the day, to get his insights into the Eurozone economy. Also, in the US, the FOMC meeting minutes along with weekly mortgage applications and existing home sales data for April, all due to release today, will garner a lot of market attention.
The currency pair is trading below its 20 Hr and 50 Hr moving averages.
