Sample Category Title
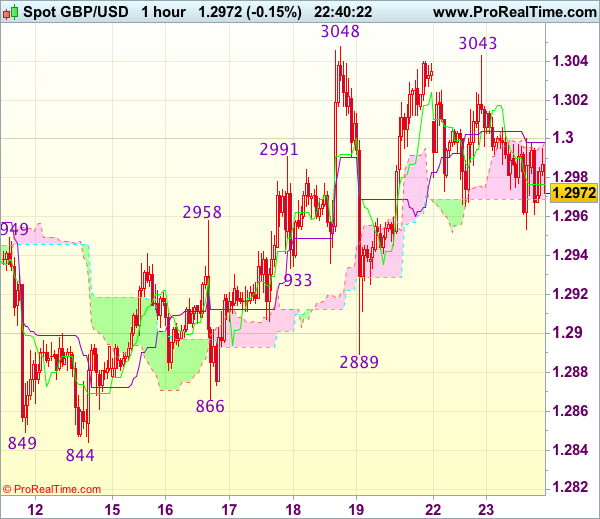
Trade Idea Wrap-up: GBP/USD – Stand aside
GBP/USD - 1.2977
Most recent candlesticks pattern : N/A
Trend : Near term up
Tenkan-Sen level : 1.2977
Kijun-Sen level : 1.2998
Ichimoku cloud top : 1.2999
Ichimoku cloud bottom : 1.2969
New strategy :
Stand aside
Position : -
Target : -
Stop : -
Despite yesterday’s rise to 1.3043, as cable has retreated after faltering below indicated resistance at 1.3048 (last week’s high), retaining our view that further choppy trading below this level would be seen and pullback to 1.2950 cannot be ruled out, however, reckon downside would be limited to 1.2920-25 and said support at 1.2889 should remain intact, bring another rebound later.
On the upside, only a break of said resistance at 1.3048 would confirm recent upmove has resumed an extend further gain to 1.3075-80 and possibly towards 1.3100-10 later. As near term outlook is mixed, would be prudent to stand aside in the meantime.
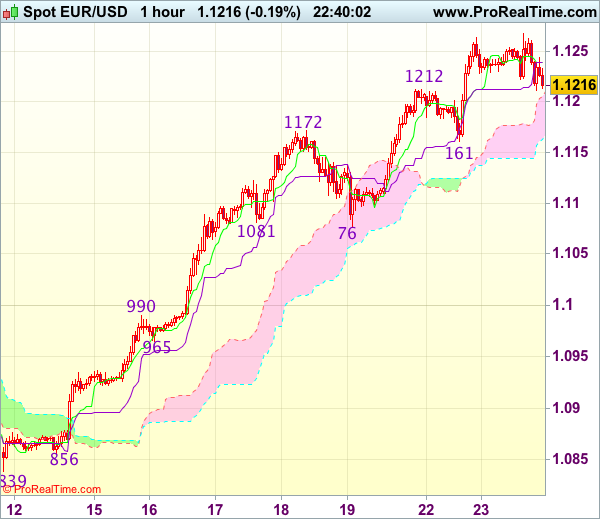
Trade Idea Wrap-up: EUR/USD – Stand aside
EUR/USD - 1.1222
Most recent candlesticks pattern : N/A
Trend : Up
Tenkan-Sen level : 1.1240
Kijun-Sen level : 1.1240
Ichimoku cloud top : 1.1206
Ichimoku cloud bottom : 1.1163
New strategy :
Stand aside
Position : -
Target : -
Stop : -
Although the single currency has maintained a firm undertone after recent rally and near term bullishness remains for recent upmove to extend gain to 1.1260-65, reckon upside would be limited to 1.1280-85 (61.8% projection of 1.0839-1.1172 measuring from 1.1076) and loss of near term upward momentum should prevent sharp move beyond 1.1300-10, risk from there is seen for a retreat later.
In view of this, would not chase this rise here and would be prudent to stand aside in the meantime. Below 1.1185-90 would bring pullback towards support at 1.1161 but break there is needed to signal top is formed, bring retracement of recent rise to 1.1125-30 first.
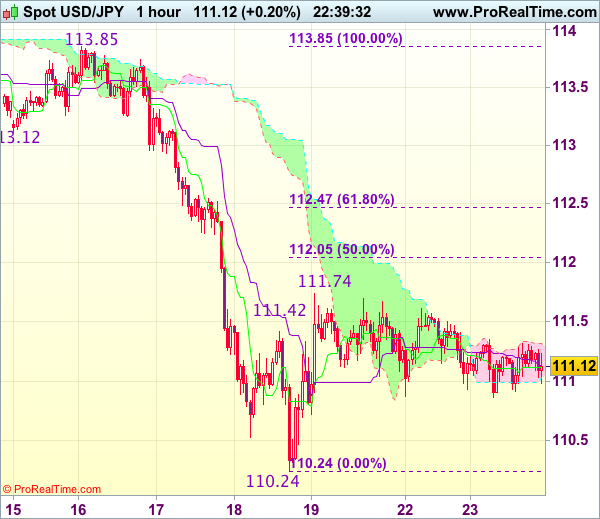
Trade Idea Wrap-up: USD/JPY – Sell at 112.05
USD/JPY - 111.07
Most recent candlesticks pattern : N/A
Trend : Near term down
Tenkan-Sen level : 111.12
Kijun-Sen level : 111.14
Ichimoku cloud top : 111.32
Ichimoku cloud bottom : 111.03
Original strategy :
Sell at 112.05, Target: 110.85, Stop: 112.40
Position : -
Target : -
Stop : -
New strategy :
Sell at 112.05, Target: 110.85, Stop: 112.40
Position : -
Target : -
Stop : -
The greenback has remained confined within near term established range and further sideways trading within this familiar range would be seen and another corrective bounce to resistance at 111.74 is likely, however, reckon upside would be limited to 112.00-05 (50% Fibonacci retracement of 113.85-110.24) and bring another decline later, below 110.70-75 would suggest the rebound from 110.24 has ended, bring retest of this level first.
In view of this, would be prudent to sell dollar on further subsequent recovery as 112.05-10 should limit upside and bring another decline. Above 112.35-40 would defer and signal low is formed instead, risk a stronger rebound to 112.65-70.
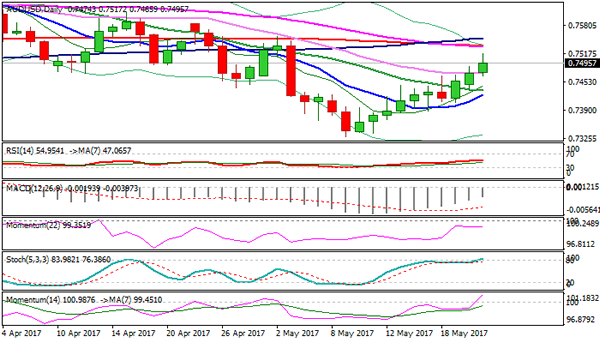
Technical Outlook: Aussie Resumes Uptrend from 0.7328
The Aussie resumes uptrend from 0.7328 (09 May low) and probes above 0.7500 barrier, after strong barrier at 0.7469 (daily Kijun-sen/Fibo 61.8% of 0.7555/0.7328) has been eventually taken out.
Bull-leg from 0.7406 (19 May trough) extends into third consecutive day, boosted by weaker US dollar and bullish signal on break above 0.7469 pivot.
The pair eyes a cluster of strong barriers between 0.7436 (converged 200/55SMA's) and 0.7555 (02 May high/100SMA), break of which would generate another strong bullish signal.
Meantime, the rally may show signs of stall on approach to these barriers, as slow stochastic is entering overbought territory. Strong bullish structure suggests mild correction, with broken daily Kijun-sen offering initial support and 20SMA at 0.7434, expected to contain.
Res: 0.7517; 0.7536; 0.7555; 0.7584
Sup: 0.7485; 0.7462; 0.7434; 0.7423
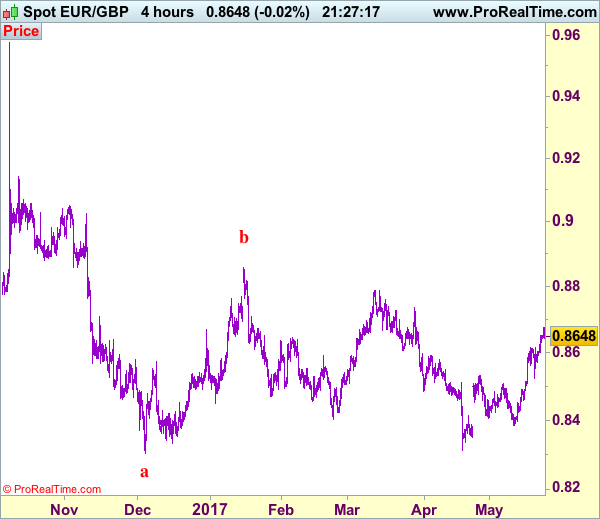
Trade Idea: EUR/GBP – Buy at 0.8575
EUR/GBP - 0.8645
Recent wave: Major double three (A)-(B)-(C)-(X)-(A)-(B)-(C) is unfolding and 2nd (A) has possibly ended at 0.6936.
Trend: Near term up
New strategy :
Buy at 0.8575, Target: 0.8675, Stop: 0.8535
Position : -
Target : -
Stop : -
Euro’s anticipated rally adds credence to our bullish view that the rise from 0.8312 low is still in progress and bullishness remains for this move to extend further gain to 0.8675-80 and then toward s0.8700, however, loss of upward momentum should prevent sharp move beyond latter level and price should falter below resistance at 0.8735, risk from there is seen for a retreat later.
In view of this, would not chase this rise here and would be prudent to buy euro again on pullback as 0.8575-85 should limit downside. Below 0.8550 would defer and suggest top is possibly formed, bring subsequent test of said support at 0.8524, once this level is penetrated, this would provide confirmation.
Our preferred count is that, after forming a major top at 0.9805 (wave V), (A)-(B)-(C) correction is unfolding with (A) leg ended at 0.8400 (A: 0.8637, B: 0.9491 and 5-waver C ended at 0.8400. Wave (B) has ended at 0.9413 and impulsive wave (C) has either ended at 0.8067 or may extend one more fall to 0.8000 before prospect of another rally. Current breach of indicated resistance at 0.9043 confirms our view that the (C) leg has ended and bring stronger rebound towards 0.9150/54, then towards 0.9240/50.
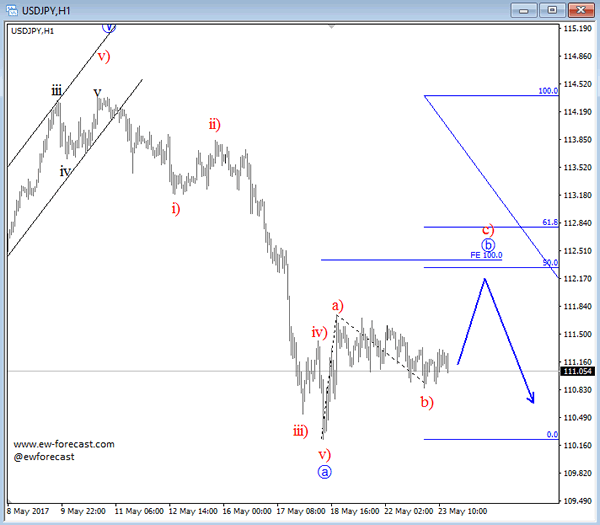
Elliott Wave Analysis: USDJPY Trading In A Corrective Recovery
On the intra-day chart of USDJPY we are observing a corrective three-wave recovery in the making. Recently price completed a five wave impulse to the downside within blue wave a, which means some slow and choppy movement was expected to follow. At the moment we see price trading in late stages of sub-wave b), so we expect final push to follow in the near-term into red wave c) of b. Resistance for wave c) may later be found around Fibonacci ratio of 50.0 or 61.8.
USDJPY, 1H
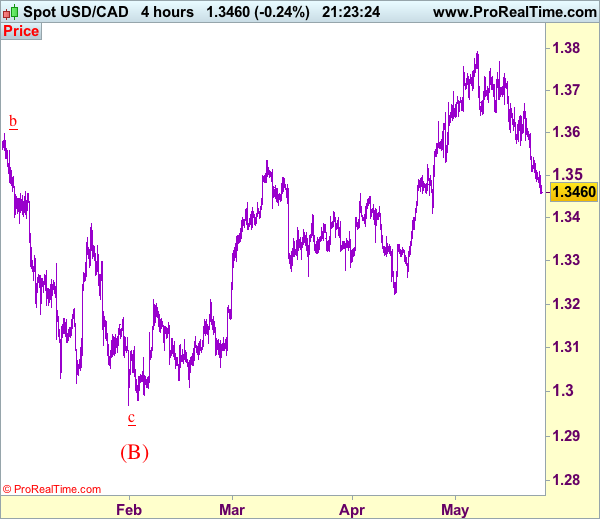
Trade Idea: USD/CAD – Stand aside
USD/CAD - 1.3464
Recent wave: Only wave v of c has ended at 0.9407 and wave C of major A-B-C correction is underway for headway to 1.4700
Trend: Near term up
New strategy :
Stand aside
Position: -
Target: -
Stop:-
The greenback has fallen again after brief recovery, suggesting the decline from 1.3794 top is still in progress and downside risk remains for this move to bring a stronger retracement of recent rise, hence weakness to 1.3411 support cannot be ruled out, however, near term oversold condition should prevent sharp fall below there and reckon 1.3350-60 would hold, bring rebound later.
In view of this, would not chase this fall here and would be prudent to stand aside in the meantime. Above 1.3505-10 would bring recovery to 1.3540-45 but only break of previous support at 1.3571 would signal low is formed, bring a stronger rebound to 1.3630-35 but resistance at 1.3670 should remain intact.
To recap, wave B from 1.3066 is unfolding as an a-b-c and is sub-divided as a: 1.2192, b: 1.2716 and wave c is a 5-waver with i: 1.1983, ii: 1.2506, extended wave iii with minor iii at 1.0206, wave iv ended at 1.0781 and wave v as well as wave iii has ended at 0.9931, hence the subsequent choppy trading is the wave iv which is unfolding as (a)-(b)-(c) with (a) leg of iv ended at 1.0854, followed by (b) leg at 1.0108 and (c) leg as well as the wave iv ended at 1.0674. The wave v is sub-divided by minor wave (i): 0.9980, (ii): 1.0374, (iii): 0.9446, (iv): 0.9913 and (v) as well as v has possibly ended at 0.9407, therefore, consolidation with upside bias is seen for major correction, indicated target at 1.3700 and 1.4000 had been met and further gain to 1.4700 would be seen later.
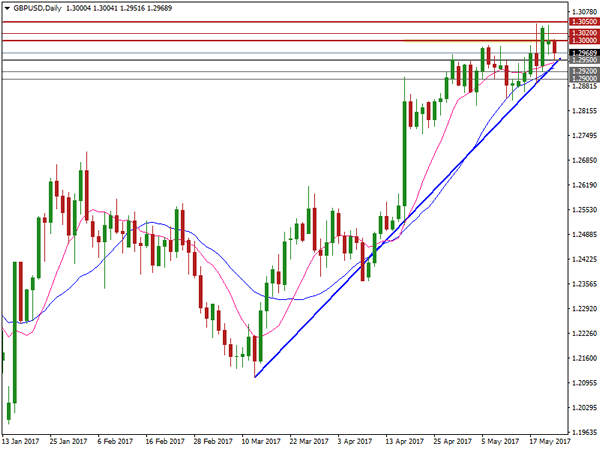
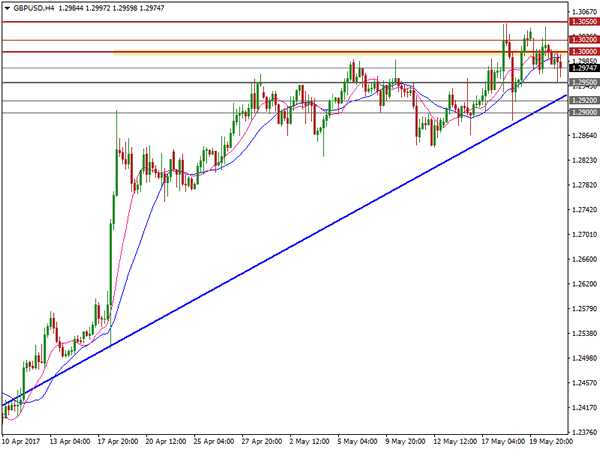
GBP/USD Bears Test Uptrend Line Support Post Manchester Terror Attack
GBP/USD has been trading above the downside uptrend line support since mid-March.
Cable rallied around 3.5% since Theresa May announced a snap general election on April 18 as markets have largely priced in a Tory victory.
GBP/USD hit a high of 1.3047 on May 18, last seen on September 29, breaking a significant resistance level at 1.3000.
However, the bullish momentum has waned since Monday, because of the drop in the approval rating for the Conservative Party caused by Theresa May's plans to cancel free school lunches and reduce free healthcare services for wealthy senior citizens.
The terror attack last night in Manchester further weighed on GBP/USD resulting in Cable falling below the significant level at 1.3000.
Currently, GBP/USD still holds above the downside uptrend line support.
However, on the 4-hourly chart, the 10 SMA is crossing over the 20 SMA, indicating bearish sentiment is increasing.
If the downside uptrend line support is broken, we will likely see a further fall in GBP/USD.
The resistance level is at 1.3000, followed by 1.3020 and 1.3050.
The support line is at 1.2950, followed by 1.2920 and 1.2900.
We will see a set of US economic data to be released between 14:45 - 15:00 BST this afternoon. It will likely affect GBP/USD.
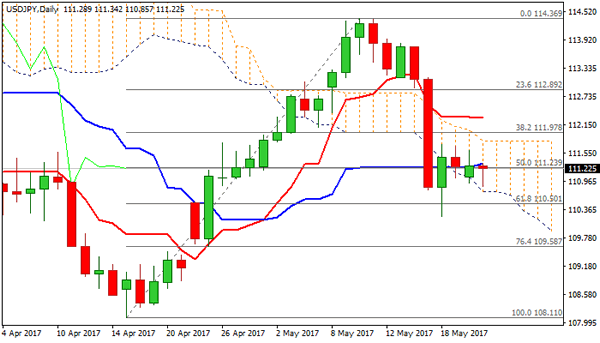
Technical Outlook: USDJPY Trading in Directionless Mode
The pair is trading in directionless mode for the fourth day, after bounce from fresh one-month low at 110.23 was capped by descending 55SMA which continued to limit upside attempts. Today's action is capped by daily Kijun-sen line (111.34) with lower pivot at 110.74 (daily cloud base) being under pressure, on overall weaker greenback. Bearish tone prevails on near-term studies while daily MA's are in bearish setup and maintain downside pressure. A probe below daily cloud and attempts towards strong supports at 110.23/00 (18 May low/psychological support) and 200SMA at 109.87 could be anticipated while 55SMA caps, as last week's long bearish daily candle continues to weigh. Descending 55SMA offers solid resistance (currently at 111.65), followed by daily cloud top at 111.80, which are expected to limit upticks and keep focus shifted lower. Alternative scenario requires break above daily cloud to neutralize bearish pressure and open way for recovery extension towards next strong barrier at 112.30 (daily Tenkan-sen).
Res: 111.34; 111.65; 111.80; 112.30
Sup: 110.74; 110.50; 110.23; 110.00
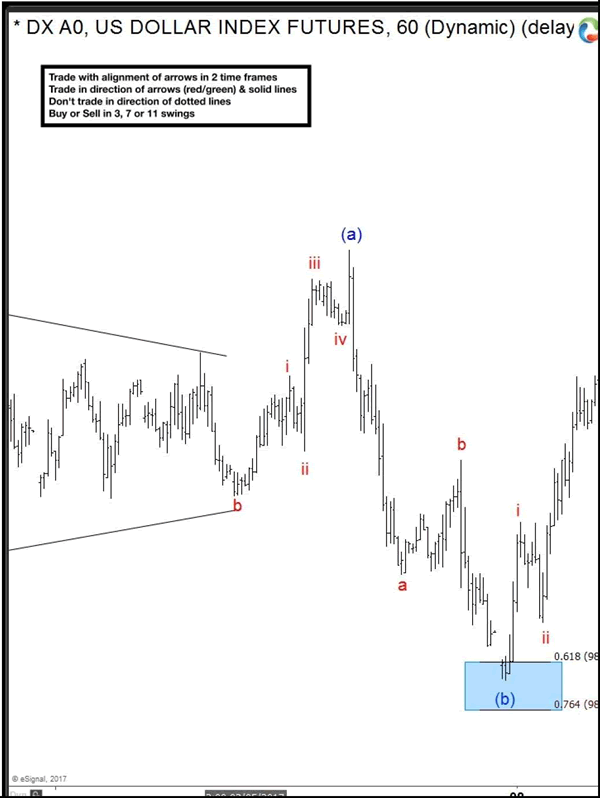
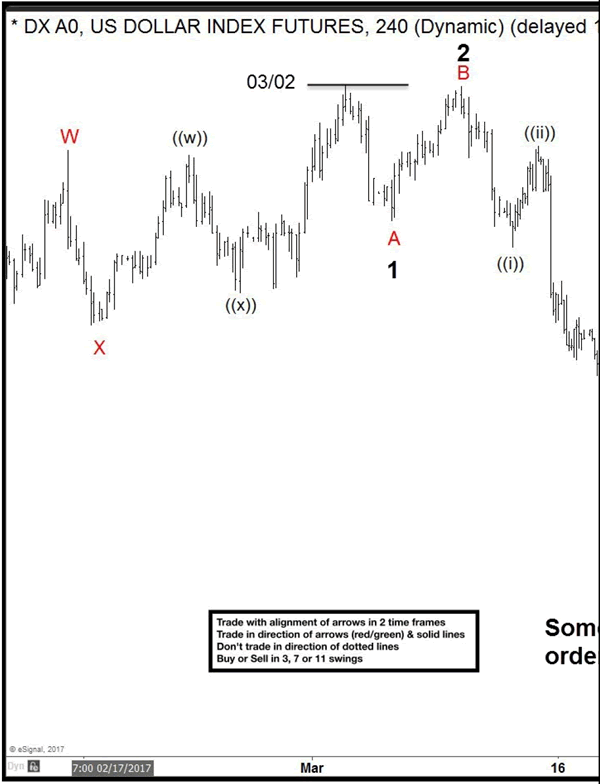
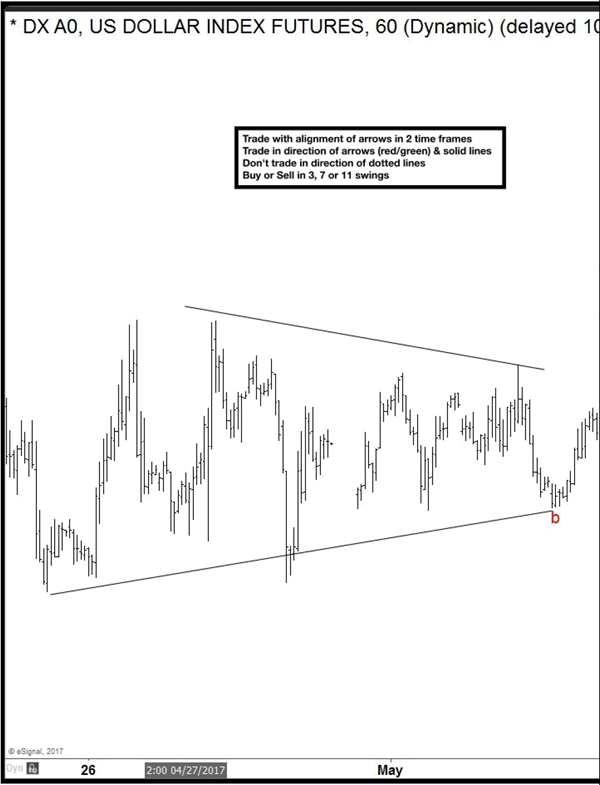
USDX Forecasting the Decline after Flat
Hello fellow traders. In this technical blog we're going to take a quick look at the past Elliott Wave charts of Dollar Index published in members area of www.elliottwave-forecast.com. We're going to take a look at the price structures of USDX , count the swings and explain the forecast.
USDX 4 hour update 05.09.2017
As our members know, we were pointing out that USDX is having incomplete bearish swings sequnces within the cycle from the 03/02 peak. From the chart below, we can see that USDX has a clear 5 swing from the peak, when we're about to complete 6th swing as Irregular Flat. Consequently, we're calling further weakness once proposed Flat is complete. Dollar index is targeting 97.92-96.91 area ideally.
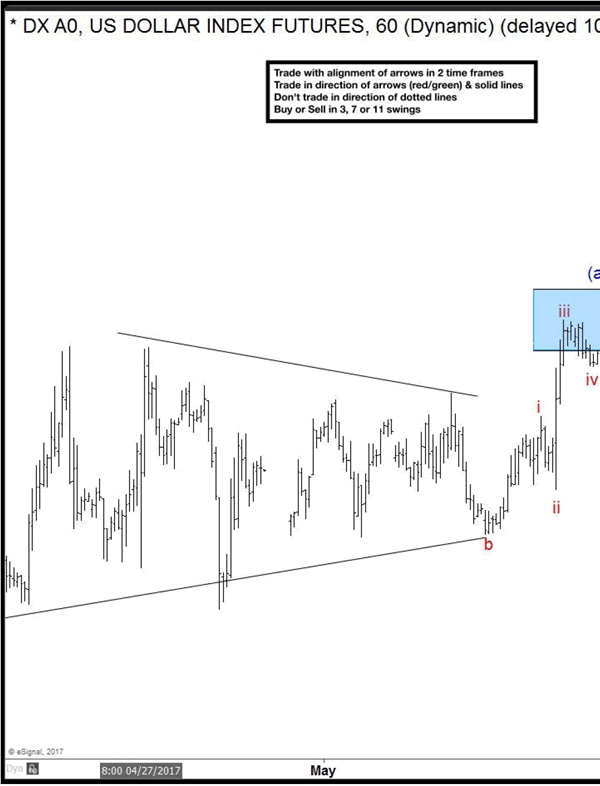
Now let's take a look at the short term structures...
USDX 1 Hour Asia Chart 05.11.2017
Dollar Index is about to complete wave ((x)) recovery as expanded flat structure. We got clear 5 waves from the lows that is part of wave (c) of flat. Although, the extreme area is reached at 99.64 -99.92, and we have minimum requirements for correction to complete soon, we see possibility of marginal extension higher within the blue box still.
USDX 1 Hour NY Midday Chart 05.11.2017
We got expected marginal extension and reaction from the blue box. Now we're calling wave ((x)) recovery completed at 99.88 peak as expanded flat. While the price stays below 99.88 peak further weakness should ideally follow.
USDX 1 Hour London Chart 05.16.2017
99.88 peak held nicely and USDX is now breaking lower, suggesting more downside in 7th swing towards proposed 97.92-96.91 area.