Sample Category Title
Trade Idea: GBP/USD – Stand aside
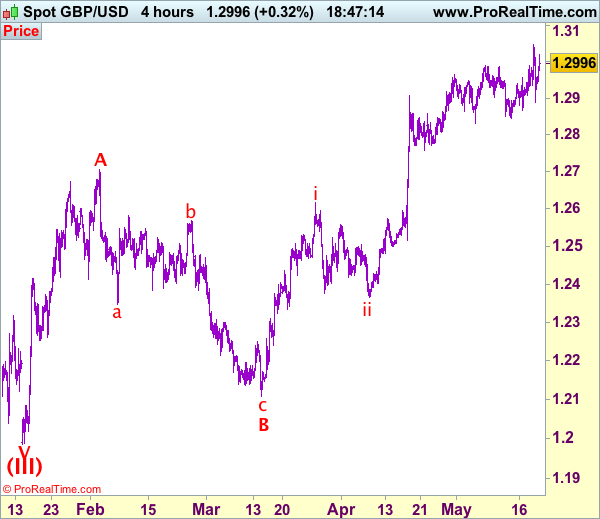
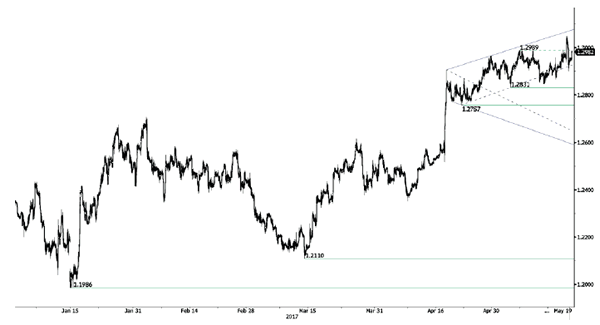
GBP/USD – 1.3000
Recent wave: Wave V of larger degree wave (III) has ended at 1.1986 and major correction has commenced from there for gain to 1.3000 and 1.3140-50
Trend: Near term up
Original strategy :
Bought at 1.2995, stopped at 1.2935
Position: - Long at 1.2995
Target: -
Stop: - 1.2935
New strategy :
Stand aside
Position: -
Target: -
Stop:-
Although cable’s retreat from 1.3048 turned out to be much deeper than expected, as sterling found good support at 1.2889 and has staged another strong rebound, suggesting consolidation with mild upside bias would be seen and gain to 1.3020 cannot be ruled out, however, break of said resistance at 1.3048 is needed to signal upmove has resumed and extend further rise to 1.3075-80, then 1.3100-10, however, near term overbought condition should limit upside to 1.3050-60 and price should falter well below 1.3100-10.
Our preferred count on the daily chart is that cable's rebound from 1.3500 (wave (A) trough) is unfolding as a wave (B) with A ended at 1.7043, followed by triangle wave B and wave C as well as wave (B) has ended at 1.7192, the subsequent selloff is the larger degree wave (C) which is still unfolding with minor wave (III) of larger degree wave 3 ended at 1.1986, hence wave (IV) correction is in progress which could either be a triangle wave (IV) of a complex formation but upside should be limited to 1.3500 and price should falter well below 1.4000, bring another decline in wave (V) of 3 for weakness to 1.1500, then 1.1200.
On the downside, whilst pullback to 1.2975-80 is likely, reckon 1.2940-45 would limit downside and bring further consolidation. Only below said support at 1.2889 would signal top has been formed at 1.3048 and bring retracement of recent upmove to 1.2866, then towards previous support at 1.2844 which is likely to hold from here.
Equities Bounce Back After Midweek Sell-Off
- Trump distraction fades as markets bounce back from midweek sell-off;
- FTSE weighed down by GBP rebound following Thursday's mini flash crash;
- Oil boosted by reports that OPEC considering deepening and extending cuts.
It's been one of the quieter days of the week so far in terms of major news flow or economic data and yet, markets are anything but flat as we near the US open, with the events of the previous days continuing to have an impact.
Wednesday's sell-off in equity markets got many people worried about whether the political circus in the US was finally starting to take its toll on investor appetite at the near-record levels. What we've seen since though would clearly suggest otherwise and instead indicate that the moves two days ago were nothing more than a combination of the usual Trump distraction combined with technical levels giving way.
The distraction is obviously undesirable, especially if it develops into anything more, but as it is investors appear relatively confident that it will pass, leaving the administration to focus on the policies that are largely responsible for markets being at these levels, tax reform and spending. The last few months has been something of a waiting game for investors as we await further news on taxes and fiscal stimulus, leaving the S&P and Dow bouncing around between 2,320 and 2,400, and 20,400 and 21,170, respectively. Only a break below here would suggest to me that investors are losing confidence.
In Europe, the FTSE's run this morning has been a little hampered by sterling's resurgence, which comes following a mini flash crash after the European session on Thursday. The stronger pound can weigh on the FTSE, due to its substantial foreign exposure, and that appears to be happening today. The pound is still currently looking a little overextended at these levels and last night's moves are another reminded of its vulnerability. Should it fail to break above 1.3048 against the dollar, it may suggest the pair has topped for now.
Oil is trading higher once again today, supported once again by the prospect of a nine month extension to the current output deal. Reports this morning that OPEC is considering not just extending but also deepening the cuts in a bid to bring the market back into balance is likely supporting the move, with Brent and WTI now on course for their seventh winning session in eight. Of course, just because OPEC is considering this and the Russian energy minister has suggested a willingness to support an extension, it doesn't mean it will happen, especially with regards to the deeper cuts as reported this morning.
Market Update – European Session: Quiet Session In The Mist Of A Turbulent Week
Notes/Observations
Quiet session no economic data or fundamental news of note
President Trump begins his 1st international trip (8 days, 5 stops, and 4 countries)
Overnight:
Asia:
China President Xi said to have told South Korea envoy he was willing to work to put bilateral relations on normal track
US Navy said to have moved a 2nd aircraft carrier near North Korea
Japan Government approved one-off bill to allow Emperor Akihito to abdicate; Now passed to Parliament which is expected to pass
Europe:
ECB's Draghi stated that the crisis was now behind them and reiterated view that Euro Area recovery was resilient and increasingly broad-based. Once again called for greater structural integration
ECB's Vasiliauskas (Lithuania): ECB should use its June meeting to start building the case for unwinding its monetary stimulus before making an announcement in the fall
Greece Parliament approved pension cuts and tax hikes agreed upon with the EU and IMF ahead of the Eurogroup meeting on Monday, May 22nd. The measures would allow Greece to complete its bailout review with its international lenders
Greece PM Tsipras: Greece has done its part; now international lenders must fulfill their debt relief promises; it's time for debt relief
OpinionWay/ORPI poll on Parliament elections: Macron's Republic on the Move (REM) set to win 27% of votes in the first round of the National Assembly election
According to ARD survey, support for Germany's ruling coalition CDU/CSU is 38% and opposition SPD party at 36% ahead of September elections
Americas:
(MX) Mexico Central Bank (Banxico) raised Overnight Rate by 25bps to 6.75% (not expected)
(CL) Chile Central Bank (BCCh) cuts Overnight Rate Target by 25bps to 2.50% (not expected)
President Trump: respected the move to name special counsel, but whole thing remained a witch hunt; reiterated there was no collusion between his campaign and Russia
Treasury Sec Mnuchin: We've had no talks about a national sales tax; remain very concerned about debt. affirmed 3% or higher GDP growth was achievable if we reform taxes and regulation; reiterated plan to provide middle-class tax relief. Treasury studying ultra-long bonds, no decision yet on ultra-long bond issuance
US Trade Rep Lighthizer: confirmed began 90-day consultation period to renegotiate NAFTA
Brazil President Temer: I have nothing to hide; I will not resign; will prove innocence before Brazil's Supreme Court. Never authorized bribes to stay quiet
Brazil Supreme court reportedly opened investigation into President Temer over obstruction of justice
Energy:
(NO) Norway Petroleum Directorate (NPD) Apr Oil Production: 1.704M bpd v 1.73M bpd m/m
Economic Data
(NL) Netherlands May Consumer Confidence Index: 23 v 26 prior
(DE) Germany Apr PPI M/M: 0.4% v 0.2%e; Y/Y: 3.4% v 3.2%e
(DK) Denmark May Consumer Confidence: 5.8 v 7.4 prior
(EU) Euro Zone Mar Current Account: €34.1B v €37.8B prior; Current Account NSA: €44.8B v €27.8B prior
Fixed Income Issuance:
(LT) Lithuania opened its books to sell EUR-denominated 10-year and 30-year bonds
(IN) India sold total INR150B in 2022, 2029, 2033 and 2051 bonds
SPEAKERS/FIXED INCOME/FX/COMMODITIES/ERRATUM
Equities
Indices [Stoxx50 +0.4% at 3233, FTSE +0.4% at 7465, DAX +0.4% at 12639, CAC-40 +0.6% at 5324, IBEX-35 +0.5% at 10737, FTSE MIB +0.6% at 21424, SMI +0.6% at 8990, S&P 500 Futures +0.2%]
Market Focal Points/Key Themes
European Indices trade higher across Europe rebounding from yesterday's losses and tracking positive gains from Asia and the US overnight.
On the corporate front Danone shares edge higher following their long term guidance, with Dufry shares in Switzerland an outperformer after Richemont takes a 5% stake while Hikma Pharmaceuticals trades down over 4% after cutting guidance. Looking to the US morning notable earners include Deere & Co, Footlocker and Campbell Soup.
Equities
Consumer discretionary [Dufry [DUFN.CH] +6.6% (Richemont take 5% stake), Aryzta [ARYN.CHF] +3% (New CEO)]
Materials: [Gemfields [GEM.UK] +3% (Take over offer), K+S [SDF.DE] +3.6% (Reportedly looking to IPO salt division)]
Industrials: [Ficantieri [FCT.IT] +2% (Acquires majority stake in STX France)]
Financials: [Legal & Gen [LGEN.UK] -1.2% (Solvency update)]
Healthcare: [Hikma [HIK.UK] -4.6% (Cuts outlook), Santhera Pharma [SANN.CH] -10% (update on timeline for application of Raxone)]
Speakers
Moody's: Portugal's economic recovery supports its credit profile. 2017 GDP growth at 1.7% and 2018 slowing to 1.4%. Challenges include high govt debt but expected debt-to-GDP ratio to gradually decline
Nigeria Central Bank Dep Gov Nnanna: Monetary policy to remain tight for now
S&P raised Indonesia Sovereign Rating from BB+ to BBB- (investment grade); outlook stable
Taiwan Dep Gov Yang stated that it has now adopted a floating management mechanism
OPEC Panel said to be considering scenario of deepening and extending oil supply cut agreement following meeting with non-member on Friday
Currencies
FX market continue to see some headwinds for the USD as perceived disarray engulfing President Trump ’ s White House and possible impact on his agenda for the time being.
EUR/USD was approaching the mid-1.11 neighborhood as recent ECB speak appeared to have the central bank build the case for autumn QE decision
GBP/USD finally made a test above the 1.30 handle. It has failed to get above the psychological level several times over the past week
USD/JPY was lower in the mid-111 area with the JPY currency having its best week in more than a month aided by demand for safer assets
Fixed Income
Bund futures trade at 161.43 down 8 ticks, coming off Thursday’s high of 161.88. Initial resistance comes from the 162.01 level followed by 163.68. A break of 160.75 support level could see lows target 160.13 followed by 157.50.
Gilt futures trade at 128.33 lower by 33 ticks, finding support from Monday’s high of 128.31. Thursday rally made a high at 128.94 and major resistance lies at the 2017 high of 129.01. Price finds key support at the 127.51 support level. An acceleration lower could test the 126.80 region. Medium-term resistance remains the 129.51 level then 130.28 followed the August 2016 high of 132.80.
Friday’s liquidity report showed Thursday’s excess liquidity declined to €1.646T a drop of €5B from €1.6510T prior. Use of the marginal lending facility rose to €137M from €97M prior.
Corporate issuance saw no deals priced. This week’s issuance is at $26.1B, below the analysts’ issuance target to come in around $30B. For the week ending May 18th Lipper US fund flows reported IG funds net inflows $3.1B bringing YTD inflows to $54.9B, High yield funds reported outflows of $0.65B bringing YTD outflows to $6.74B.
Looking Ahead
06:00 (UK) May CBI Industrial Trends Total Orders: 4e v 4 prior; Selling Prices: 29e v 29 prior
06:00 (UK) DMO to sell combined £2.0B in 1-month, 3-month and 6-month bills (£0.5B, £0.5B and £1.0B respectively)
06:30 (IS) Iceland to sell 2020 and 2028 RIKB Bonds
06:45 (US) Daily Libor Fixing
07:30 (IN) India Weekly Forex Reserves
08:00 (PL) Poland Apr Sold Industrial Output M/M: -10.6%e v +17.6% prior; Y/Y: 1.9%e v 11.1% prior; Construction Output Y/Y: 6.8%e v 17.2% prior
08:00 (PL) Poland Apr PPI M/M: +0.1%e v -0.1% prior; Y/Y: 4.5%e v 4.7% prior
08:00 (PL) Poland Apr Retail Sales M/M: -1.3%e v +16.5% prior; Y/Y: 9.0%e v 9.7% prior; Real Retail Sales Y/Y: 7.2%e v 7.9% prior
08:00 (EU) ECB's Constancio (Portugal) speaks at Conference in Brussels
08:15 (UK) Baltic Dry Bulk Index
08:30 (CA) Canada Mar Retail Sales M/M: +0.3%e v -0.6% prior; Retail Sales Ex Auto M/M: +0.2%e v -0.1% prior
08:30 (CA) Canada CPI M/M: 0.5%e v 0.2% prior; Y/Y: 1.7%e v 1.6% prior; Consumer Price Index: No est 129.9 prior
08:30 (CA) Canada CPI Core- Common Y/Y: 1.4%e v 1.3% prior; CPI Core- Trim Y/Y: No est v 1.4% prior; CPI Core- Median Y/Y: No est v 1.7% prior
09:15 (US) Fed's Bullard (non-voter, dovish) to speak about US Economy and Monetary Policy
10:00 (EU) Euro Zone May Advance Consumer Confidence: -3.0%e v -3.6 prior
10:15 (EU) EU Commission's Guersen speaks at ECB Conference in Brussels
11:00 (EU) Potential sovereign ratings after European close
(NL) Netherlands Sovereign Debt to be rated by S&P
(CH) Switzerland Sovereign Debt to be rated by S&P
(SE) Sweden Sovereign Debt to be rated by DBRS
12:00 (CO) Colombia Q1 GDP Q/Q: -0.2%e v +1.0% prior; Y/Y: 1.2%e v 1.6% prior
13:00 (US) Weekly Baker Hughes Rig Count data
13:40 (US) Fed’s Williams (moderate, non-voter) in SF
15:00 (CO) Colombia Mar Economic Activity Index (Monthly GDP) Y/Y: 1.2%e v 0.3% prior
(IA) Iran holds elections
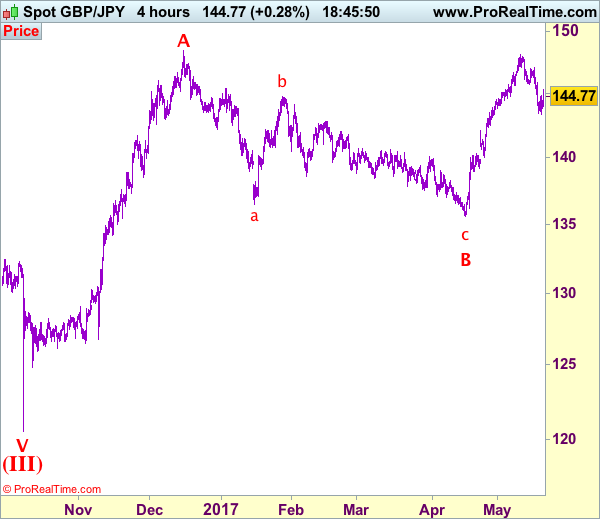
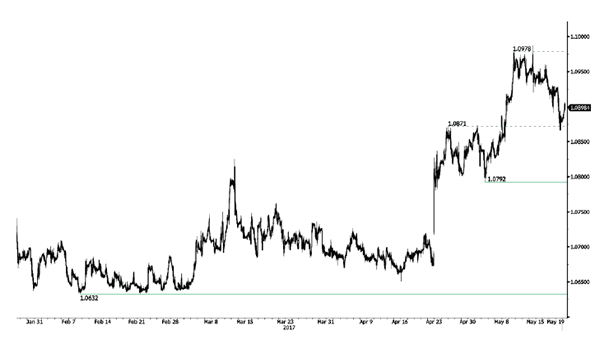
Trade Idea: GBP/JPY – Stand aside
GBP/JPY - 144.70
Recent wave: Medium term low formed at 120.50 and (A)-(B)-(C) major correction has commenced with (A) leg ended at 148.45, hence wave (B) is unfolding for retreat to 131.00-10.
Trend: Near term up
New strategy :
Stand aside
Position: -
Target: -
Stop:-
Although sterling fell marginally to 143.40 yesterday, lack of follow through selling and the subsequent rebound suggest consolidation above this level would be seen and gain to 145.30-35 cannot be ruled out, however, break of resistance at 145.90-95 is needed to signal low is formed, bring a stronger rebound to 146.30-35 but resistance at 147.10 should remain intact, bring retreat later.
In view of this, would be prudent to stand aside for now. Below 144.00 would bring test of 143.80-85 but break there is needed to signal the rebound from 143.40 has ended, bring another test of this level, break there would extend the corrective decline from 148.10 top for retracement of recent upmove to 143.00, then towards 142.50-60.
Our preferred count is that larger degree wave V with circle is unfolding from 251.12 with wave (I) 219.34, (II): 241.38 and wave (III) is subdivided into 1: 192.60, 2: 215.89 (23 Jul 2008) and wave 3 ended at 118.87 earlier in 2009. The correction from there to 162.60 is wave 4 which itself is a double three and is labeled as first a-b-c ended at 151.53, followed by wave x at 139.03, 2nd a ended at 162.60, 2nd b at 146.75 and 2nd c leg of wave 4 ended at 163.00. Therefore, the decline from 163.00 to 116.85 is now treated as wave 5 which also marked the end of larger degree wave (III), hence wave (IV) major correction has commenced for retracement of the wave (III) from 241.38 and upside target at 183.95-00 (50% Fibonacci retracement of the wave (II) from 241.38) had been met, a drop below 160.00 would suggest wave (IV) has ended at 195.85, bring decline in wave (V) for initial weakness to 130 (already met) and 120.
GOLD Medium-Term Bullish, SILVER Weakening Again, CRUDE OIL Monitoring The $50 Level.
GOLD Medium-term bullish.
Gold seems on its way back up. Hourly support is now located at 1195 (10/03/2017 low). Expected to show further upside pressures.
In the long-term, the technical structure suggests that there is a growing upside momentum. A break of 1392 (17/03/2014) is necessary ton confirm it, A major support can be found at 1045 (05/02/2010 low).
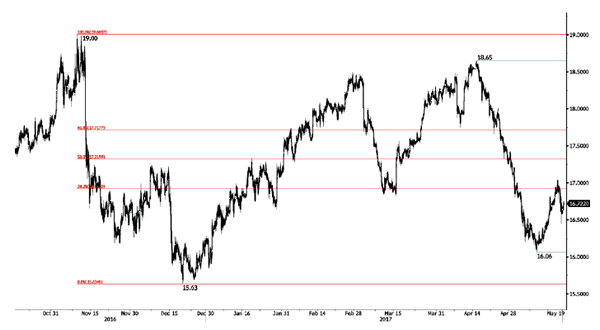
SILVER Weakening again.
Silver weakens. Strong support is given at 15.63 (20/12/2017 low). Closest support is given at 16.20 (04/05/2017 low). Key resistance is given at a distance at 19.00 (09/11/2017 high).
In the long-term, the death cross indicates that further downsides are very likely. Resistance is located at 25.11 (28/08/2013 high). Strong support can be found at 11.75 (20/04/2009).
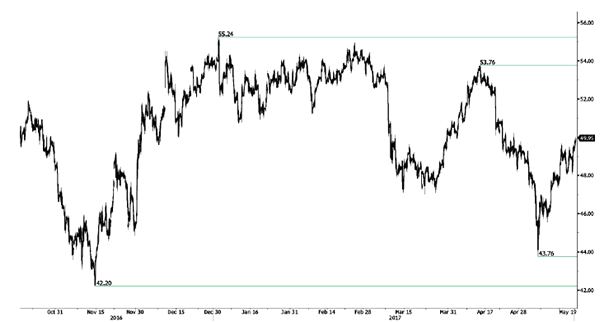
CRUDE OIL Monitoring the $50 level.
Crude oil continues to bounce on shortsqueeze move. Support is given at a distance 43.76 (05/05/2017 low). Demand is very strong and crude oil is set to be monitor again the $50 mark.
In the long-term, crude oil has recovered after its sharp decline last year. However, we consider that further weakness are very likely. Strong support lies at 24.82 (13/11/2002) while resistance can now be found at 55.24 (03/01/2017 high).
EUR/JPY Consolidating, EUR/GBP Growing Demand, EUR/CHF Continued Weakness.
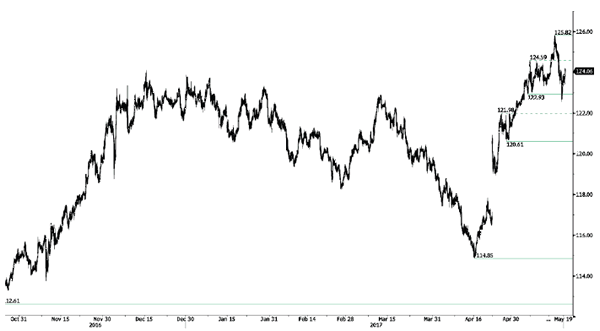
EUR/JPY Consolidating.
EUR/JPY's bullish run has ended, Hourly support is given at 122.93 (05/05/2017 low). Major support is given at 114.90 (18/04/2017low). Expected to see further renewed buying pressures towards 126.00 as long as the pair remains above 122.93.
In the longer term, the technical structure validates a medium-term succession of lower highs and lower lows. As a result, the resistance at 149.78 (08/12/2014 high) has likely marked the end of the rise that started in July 2012. Strong support at 94.12 (24/07/2012 low) looks nonetheless far away.
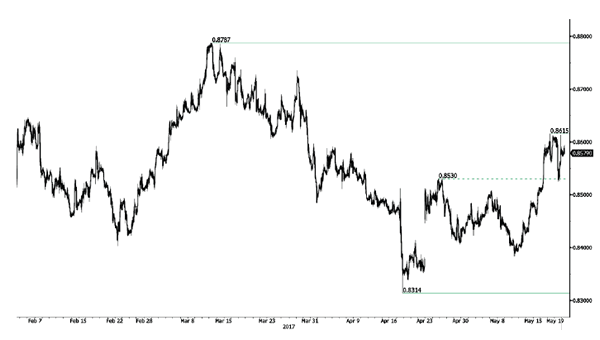
EUR/GBP Growing demand.
EUR/GBP is strengthening. The technical has turned positive since the pair has broken resistance at 0.8530 (25/04/2017 low). Support can be found at 0.8304 (05/12/2017 low). Expected to see further consolidation around 0.8600.
In the long-term, the pair has largely recovered from recent lows in 2015. The technical structure suggests a growing upside momentum. The pair is trading above from its 200 DMA. Strong resistance can be found at 0.9500 psychological level.
EUR/CHF Continued weakness.
EUR/CHF is getting lower. Despite the sharp increase and the recent bullish breakout which was very likely psychological, we believe that the medium-term pattern suggests us to see at some point renewed bearish pressures towards key support that can be found at 1.0623 (24/06/2016 low).
In the longer term, the technical structure is mixed. Resistance can be found at 1.1200 (04/02/2015 high). Yet,the ECB's QE programme is likely to cause persistent selling pressures on the euro, which should weigh on EUR/CHF. Supports can be found at 1.0184 (28/01/2015 low) and 1.0082 (27/01/2015 low).
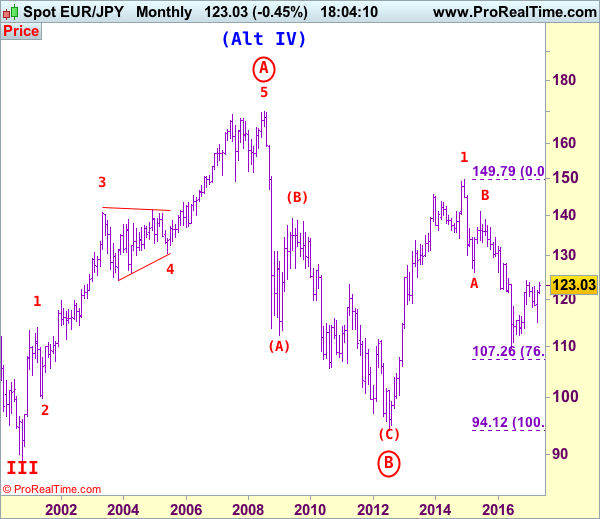
EUR/JPY Elliott Wave Analysis
EUR/JPY - 124.32
EUR/JPY: Wave v as well as larger degree wave (C) ended at 94.11 and first leg of larger degree wave C upmove has possibly ended at 149.79 and wave 2 correction has possibly ended at 109.49.
As the single currency finally met resistance at 125.82 earlier this week and has retreated, suggesting consolidation below this level would be seen and pullback to 123.00 and possibly towards support at 122.55-60 cannot be ruled out, however, reckon 121.60-65 (38.2% Fibonacci retracement of 114.85-125.82) would limit downside and bring another rise later, above said resistance at 125.82 would signal recent upmove has resumed and extend further gain to resistance at 126.47 but price should falter below 127.50-60, risk from there has increased for another retreat to take place later.
The daily chart is labeled as attached, early selloff from 169.97 (July 2008) to 112.08 is wave (A) of B instead of end of entire wave B and then the rebound from there to 139.26 is wave (B), hence, wave (C) has possibly ended at 94.12 with a diagonal triangle as labeled in the daily chart, hence upside bias is seen for further gain. Recent rally above indicated retracement level at 116.69 (50% Fibonacci retracement of the intermediate fall from 139.26-94.12) adds credence to this view and signal major reversal has commenced but first leg of this wave C has possibly ended at 149.79, hence wave 2 has commenced with wave A ended at 126.09, followed by wave B at 141.06, wave C commenced and could have ended at 109.49, above 125.00 would add credence to this view.
On the downside, whilst initial pullback to 123.00-10 and then 122.55-60 cannot be ruled out, reckon downside would be limited to 121.60-65 and bring another rise to aforesaid upside targets. Only below indicated support at 120.60 would defer and risk deeper pullback to 120.00 but downside should be limited to 119.40-50 and support at 118.90-95 should remain intact, bring another rise later.
Recommendation: Buy at 121.60 for 124.50 with stop below 120.60.
To re-cap the corrective upmove from the record low of 88.93 (18 Oct 2000), the wave A from there is subdivided as: 1:88.93-113.72, 2:99.88 (1 Jun 2001), 3:140.91 (30 May 2003), 4:124.17 (10 Nov 2003) and 5 ended at record high of 169.97 (21 Jul 2008). The brief but sharp selloff to 112.08 is viewed as a-b-c x a-b-c wave (A) of B. The subsequent rebound to 139.26 is (B) of B and (C) of (B) has possibly ended at 94.12 and in any case price should stay well above previous chart support at 88.93, bring rally in larger degree wave C towards 150.00.
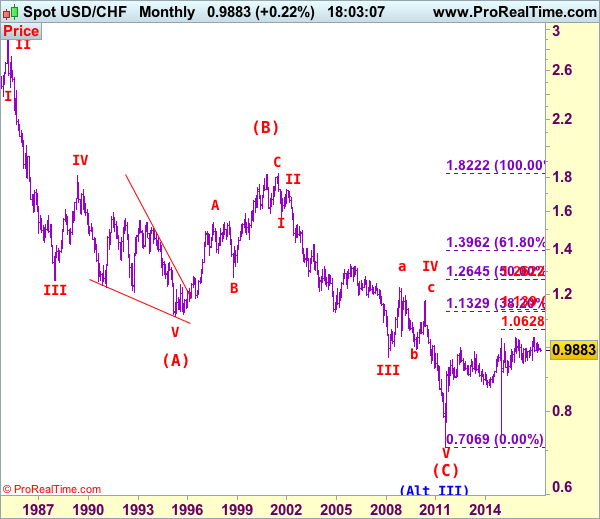
USD/CHF Elliott Wave Analysis
USD/CHF – 0.9778
USD/CHF – Wave IV ended at 1.1730 and wave V has possibly ended at 0.7068
As the greenback dropped sharply after faltering below indicated previous resistance at 1.0108 and broke below previous support at 0.9813, confirming another leg of major decline from 1.0344 top is underway and bearishness is seen for further weakness to 0.9735-40, then 0.9675-80, however, near term oversold condition should prevent sharp fall below 0.9600-10 and price should stay well above previous support at 0.9550, risk from there is seen for a rebound to take place later.
Our preferred count on the daily chart is that early selloff to 0.9630 is an end of the larger degree wave III and major correction is unfolding from there with a leg ended at 1.2298 (Nov 2008 with (a): 1.0625, (b):1.0011 and (c):1.2298), wave b ended at 0.9910 with (a): 1.0370, (b): 1.1967, (c): 0.9910. The rise from there to 1.1730 is the wave c which also marked the end of wave IV and wave V has possibly ended at 0.7068.
On the upside, whilst initial recovery to 0.9840-50 cannot be ruled out, reckon upside would be limited to 0.9900 and bring another decline later. Above 0.9955-60 would defer and risk rebound to 1.0000 but upside should still be limited and price should falter well below resistance at 1.0100-08, bring retreat later. Only a break above this level would signal the rise from 0.9813 low has resumed and extend gain to previous resistance at 1.0171. Looking ahead, once this level is penetrated, this would signal the retreat from 1.0344 has ended, bring further gain to 1.0200-10, then test of resistance at 1.0248 resistance, only above there would add credence to this view and bring resumption of early upmove for an eventual retest of 1.0344.
Recommendation: Sell at 0.9900 for 0.9700 with stop above 1.0000
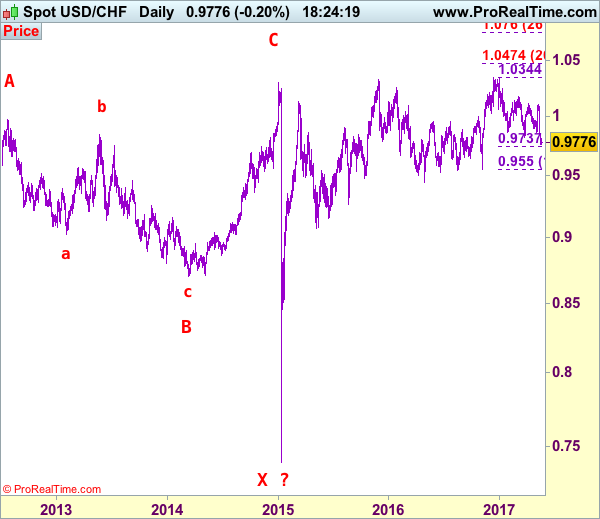
Dollar's long-term downtrend started from 2.9343 (Feb 1995) and it was unfolding as a (A)-(B)-(C) with (A): 1.1100, (B): 1.8310 (26 Oct 2000), then followed by another impulsive wave (C) with wave III ended at 0.9630 (Mar 2008). Under this count, correction in wave IV has possibly ended at 1.1730 and wave V already broke below support at 0.9630 and met indicated downside target at 0.7500 and 0.7400. The reversal from 0.7068 suggests the wave V has possibly ended and the breach of resistance at 0.9595 add credence to this view and indicated upside target at 1.0000 had been met, however, the sharp retreat from 1.0296 to 0.7401 suggests choppy trading would be seen but price should stay above said record low at 0.7068.
USD/CHF Wide-Open Towards Support At 0.9550, USD/CAD Selling Pressures Are Fading, AUD/USD Riding Symmetrical Triangle.
USD/CHF Wide-open towards support at 0.9550.
USD/CHF continues to push lower after failing to break resistance given at 1.0107 (10/04/2017 high). Support located at 0.9814 (27/03/2017 low) has been broken. Expected to continue going lower.
In the long-term, the pair is still trading in range since 2011 despite some turmoil when the SNB unpegged the CHF. Key support can be found 0.8986 (30/01/2015 low). The technical structure favours nonetheless a long term bullish bias since the unpeg in January 2015.

USD/CAD Selling pressures are fading.
USD/CAD keeps on weakening since the pair reached 1.3800. Hourly support can be found at 1.3411 (24/04/2017 high) then 1.3353 (20/01/2017 high). Expected to show continued bearish pressures.
In the longer term, there is a golden cross with the 50 dma crossing the 200 dma indicating further upside pressures. Strong resistance is given at 1.4690 (22/01/2016 high). Long-term support can be found at 1.2461 (16/03/2015 low).
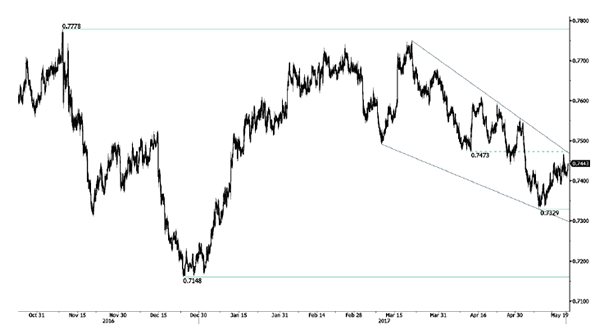
AUD/USD Riding symmetrical triangle.
AUD/USD is pushing higher since the pair monitored support at 0.7329 (09/05/2017 low). As long as prices remain below the resistance at 0.7608 (17/04/2017 high), the short-term technical structure is negative. Expected to show renewed weakness.
In the long-term, we are waiting for further signs that the current downtrend is ending. Key supports stand at 0.6009 (31/10/2008 low) . A break of the key resistance at 0.8295 (15/01/2015 high) is needed to invalidate our long-term bearish view.
EUR/USD Continued Increase, GBP/USD Breaking 1.30 Mark, USD/JPY Continued Decline.
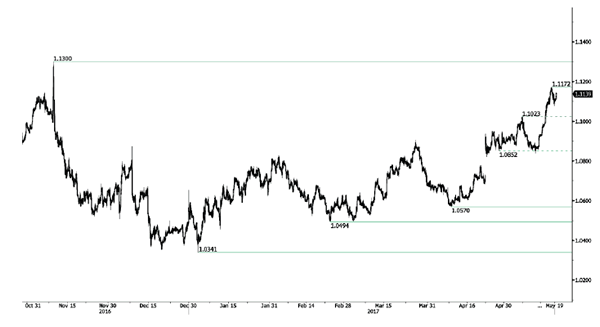
EUR/USD Continued increase.
EUR/USD is trading higher. Resistance now lies at 1.1172 (18/05/2017 high). Hourly support can be found at 1.0842 (11/05/2017 low). Strong support is now given at 1.0682 (21/04/2017 base) and key support can be found at 1.0494 (22/02/2017 low). Expected to continue growing higher.
In the longer term, the death cross late October indicated a further bearish bias. The pair has broken key support given at 1.0458 (16/03/2015 low). Key resistance holds at 1.1714 (24/08/2015 high). Expected to head towards parity.
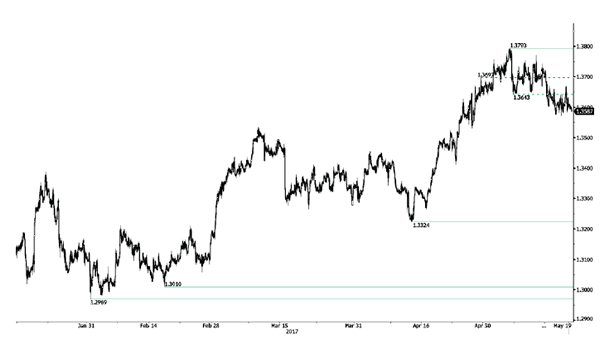
GBP/USD Breaking 1.30 mark.
GBP/USD is trading higher. Hourly resistance is given at 1.3048 (18/05/2017 high). Hourly support are given at 1.2831 (04/05/2017 low) and1.2757 (21/04/2017 low). An unlikely break of this last support would indicate further weakness. Expected to push higher.
The long-term technical pattern is even more negative since the Brexit vote has paved the way for further decline. Long-term support given at 1.0520 (01/03/85) represents a decent target. Long-term resistance is given at 1.5018 (24/06/2015) and would indicate a long-term reversal in the negative trend. Yet, it is very unlikely at the moment.
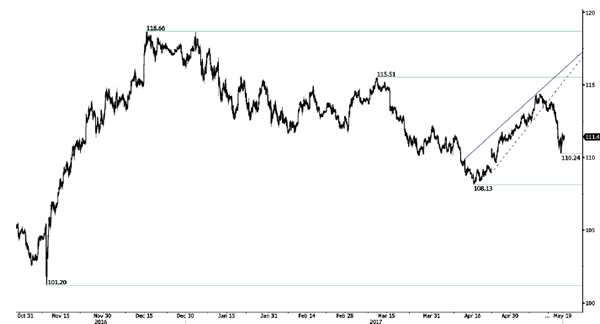
USD/JPY Continued decline.
USD/JPY has exited the symmetrical triangle and keeps pushing lower. Hourly support is given at 110.24 (18/05/2017 low). Stronger support is located at 108.13 (17/04/2017 low). Other key supports lie at a distant 106.04 (11/11/2016 low).The road is now wide-open for further decline.
We favor a long-term bearish bias. Support is now given at 96.57 (10/08/2013 low). A gradual rise towards the major resistance at 135.15 (01/02/2002 high) seems absolutely unlikely. Expected to decline further support at 93.79 (13/06/2013 low).