
Sample Category Title
EUR/GBP Candlesticks and Ichimoku Analysis
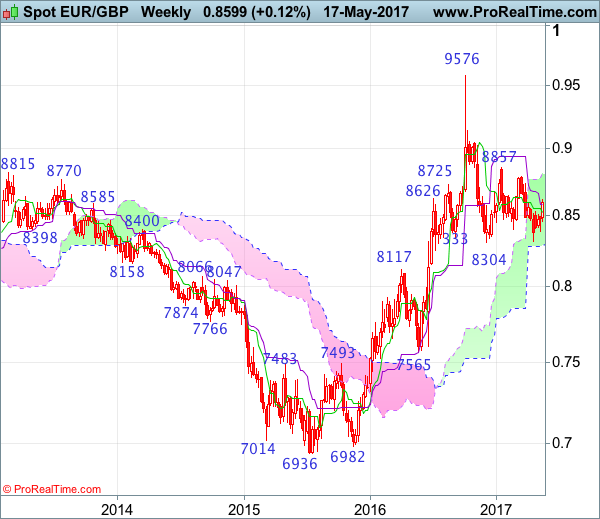
Weekly
• Last Candlesticks pattern: N/A
• ime of formation: N/A
• Trend bias: Near term up
Daily
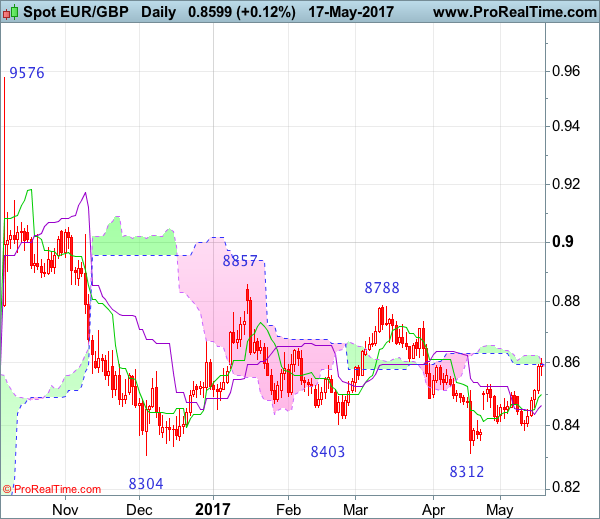
• Last Candlesticks pattern: Hammer
• Time of formation: 3 Feb 2016
• Trend bias: Up
EURGBP – 0.8583
The single currency found decent demand at 0.8384 last week and has rallied, reinforcing our bullish view that another leg of corrective rise from 0.8312 low is underway, our long position entered at 0.8400 met indicated upside target at 0.8600 with 200 points profit, this anticipated rise suggests the rebound from 0.8312 is still in progress, hence bullishness remains for this move to bring retracement of recent decline towards 0.8660-65, however, near term overbought condition should prevent sharp move beyond 0.8700 and price should falter below previous resistance at 0.8735, bring retreat later.
On the downside, whilst initial pullback to 0.8540-50 cannot be ruled out, reckon the Tenkan-Sen (now at 0.8500) would limit downside and bring another rise later to aforesaid upside targets. Below the Tenkan-Sen would risk test of the Kijun-Sen (now at 0.8464) and but only a daily close below support at 0.8457 would abort and signal top is formed instead, bring further fall to 0.8400-10 and then test of said support at 0.8384. Looking ahead, only a drop below 0.8384 would shift risk back to downside and suggest the rise from 0.8312 has ended, bring eventual retest of this level later.
Recommendation: Long entered at 0.8400 met target at 0.8600 with 200 points profit and would buy again at 0.8520 for 0.8700 with stop below 0.8420.
On the weekly chart, as the single currency found good support at 0.8384 and has rebounded, a hammer candlestick bullish pattern was formed, retaining our bullish view for the rebound from 0.8312 to bring retracement of recent decline, hence further gain to 0.8675-80 and then 0.8700-10, however, as broad outlook remains consolidative, reckon upside would be limited to 0.8750 and 0.8788 resistance should remain intact, bring retreat later.
On the downside, although initial pullback to 0.8560-70 cannot be ruled out, reckon the Tenkan-Sen (now at 0.8524) would limit downside and bring another rise later. A drop below this week’s low at 0.8457 would abort and suggest top is possibly formed, risk weakness to 0.8400-10 but only break of said support at 0.8384 would suggest the rebound from 0.8312 has ended instead, bring further fall to 0.8350-55 and eventually retest of 0.8312.
EUR/CHF Candlesticks and Ichimoku Analysis
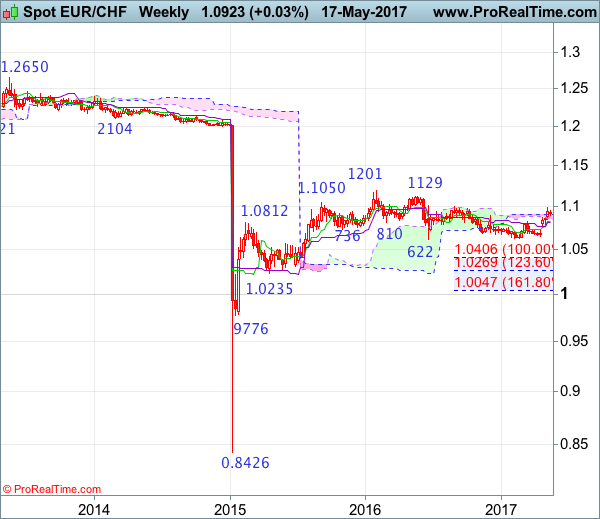
Weekly
• Last Candlesticks pattern: Doji
• Time of formation: 20 Feb 2017
• Trend bias: Up
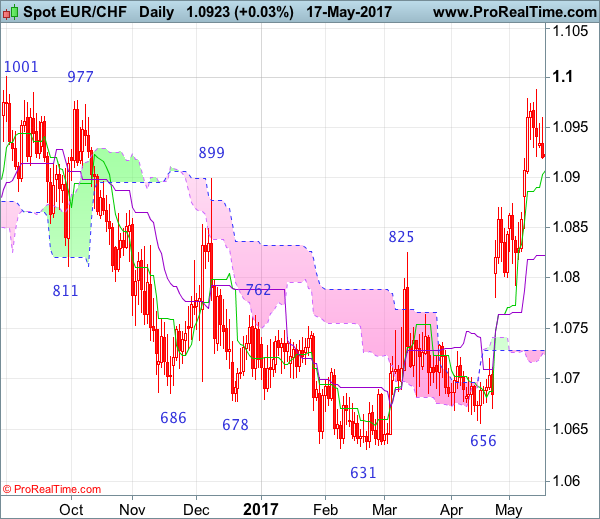
Daily
• Last Candlesticks pattern: Doji
• Time of formation: 1 Sep 2016
• Trend bias: Near term down
EUR/CHF – 1.0973
As the single currency has retreated after rising to 1.0988 late last week, suggesting consolidation below this level would be seen and pullback to 1.0860-65 cannot be ruled out, however, reckon the Kijun-Sen (now at 1.0822) would contain weakness and bring another rise later, above said resistance would extend the erratic rise from 1.0631 for at least a stronger correction of early decline to 1.1001 resistance but break there is needed to encourage for headway to 1.1050-60, then 1.1100, having said that, overbought condition should prevent sharp rise beyond 1.1150 and price should falter below previous chart resistance at 1.1201, risk from there has increased for a retreat to take place later.
On the downside, whilst initial pullback to 1.0860–65 is likely, reckon the Kijun-Sen (now at 1.0886) would limit downside and bring another rise later. Below 1.0845-50 would defer and suggest top is possibly formed, bring test of support at 1.0792 which is likely to limit downside, bring rebound later. A daily close below this support at 1.0792 would abort and signal top is formed, bring subsequent fall to the upper Kumo (now at 1.0726) but support at 1.0671 should remain intact, the single currency shall stage another rebound from there.
Recommendation: Buy at 1.0865 for 1.1065 with stop below 1.0765.
On the weekly chart, although the single currency surged to 1.0988 last week, the subsequent retreat suggests consolidation below this level is in store and pullback to 1.0860-65 cannot be ruled out, however, the Tenkan-Sen (now at 1.0822) would contain downside and bring another rise later, above said resistance at 1.0988 would extend the rise from 1.0631 low to 1.1001 resistance, a sustained breach above this level would signal the fall from 1.1201 has ended, bring further gain to 1.1100 and possibly test of resistance at 1.1129 but price should falter below said recent high at 1.1201, bring retreat later.
On the downside, expect pullback to be limited to the lower Kumo (now at 1.0852) and bring another rise later. Below the Tenkan-Sen (now at 1.0822) would risk test of the Kijun-Sen (now at 1.0810), break there would defer and suggest top is possibly formed, risk test of 1.0792 support, once this level is penetrated, this would add credence to this view, bring further fall towards 1.0725-30 but support at 1.0656 should remain intact, bring another rally later this month.
Daily Technical Analysis: EUR/USD Bullish Momentum Explained By 3rd Wave
Currency pair EUR/USD
The EUR/USD bullish momentum continued strongly yesterday breaking above 1.11 and heading towards the next round level of 1.12. The bullish push can be explained by the wave 3 pattern (purple) which is known for its strong momentum. The bullish momentum could now however reach a moment where it will be retracing for a corrective wave 4 (purple). The Fibonacci levels of wave 4 could act as support.
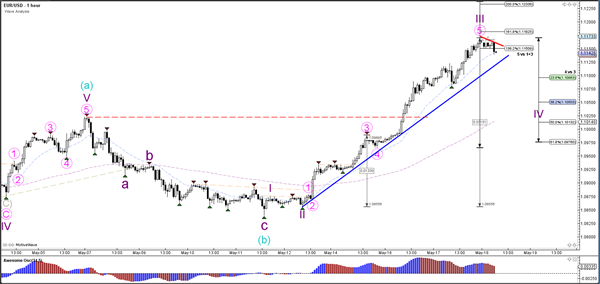
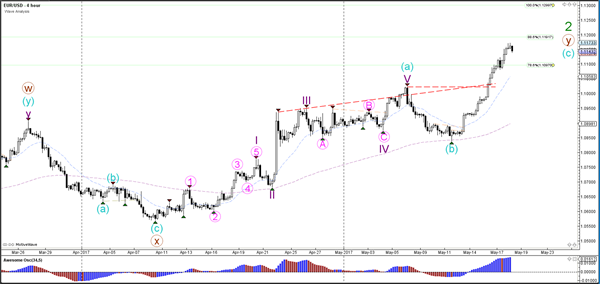
On one time frame higher the EUR/USD could be building an ABC (blue) zigzag which could face resistance at the 88.6% Fibonacci level.
Currency pair USD/JPY
The USD/JPY continued with the ABC (brown) zigzag correction yesterday, which has reached the 61.8% Fibonacci level (of the 5 waves (brown)). This could cause a retracement.
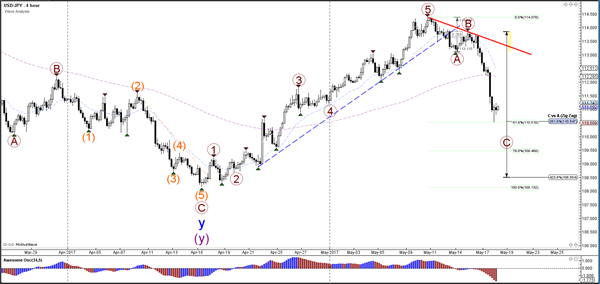
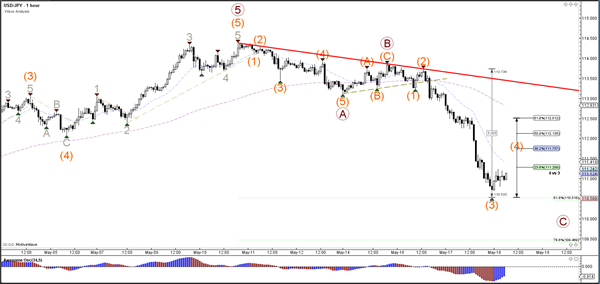
The USD/JPY bearish third wave 3 (orange) seems to have reached a support level which could cause a wave 4 (orange) correction. The Fibonacci levels of wave 4 (orange) are therefore potential resistance levels.
Currency pair GBP/USD
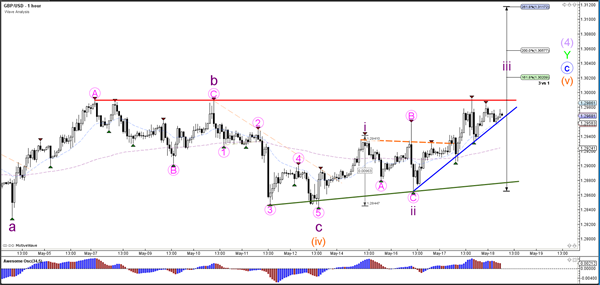
The GBP/USD remains in an uptrend channel (red/green) and price is challenging the top (red). Price poked through the previous top and hence a bullish wave 5 (orange) seems more likely at this moment.
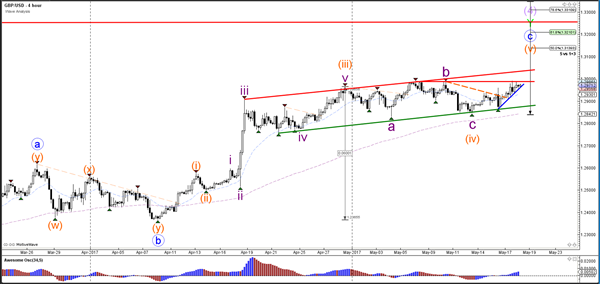
The GBP/USD break above resistance (red) could see a wave 3 (purple) develop whereas a break below support (blue) could see price continue within the correction.
Trade Idea : USD/CHF – Sell at 0.9870
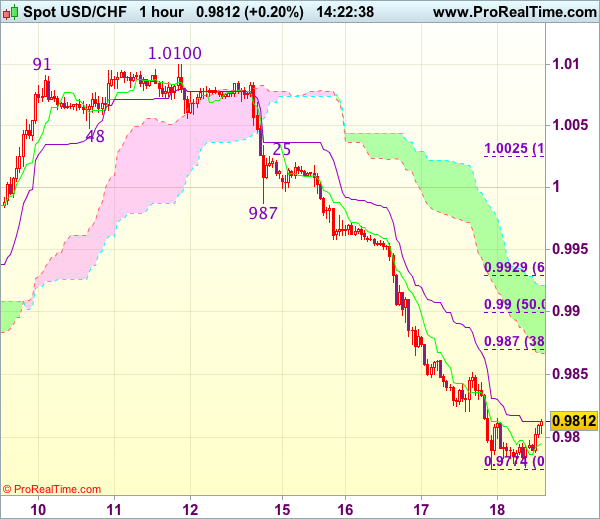
USD/CHF - 0.9818
Most recent candlesticks pattern : N/A
Trend : Near term down
Tenkan-Sen level : 0.9800
Kijun-Sen level : 0.9813
Ichimoku cloud top : 0.9921
Ichimoku cloud bottom : 0.9867
Original strategy :
Sell at 0.9870, Target: 0.9770, Stop: 0.9905
Position : -
Target : -
Stop : -
New strategy :
Sell at 0.9870, Target: 0.9770, Stop: 0.9905
Position : -
Target : -
Stop : -
As dollar has recovered after dropping to 0.9774 yesterday, suggesting minor consolidation above this level would be seen and recovery to 0.9850 cannot be ruled out, however, reckon 0.9870 (38.2% Fibonacci retracement of 1.0025-0.9774) would limit upside and bring another decline later, below said support at 0.9774 would extend early selloff from 1.0344 top towards 0.9735-40 (76.4% retracement of 0.9550-1.0344), however, near term oversold condition should prevent sharp fall below 0.9700, risk from there is seen for a rebound to take place later.
In view of this, would not chase this fall here and would be prudent to sell dollar on recovery as 0.9870 should limit upside. Above 0.9900 (50% Fibonacci retracement) would defer and risk rebound to 0.9925-30 (61.8% Fibonacci retracement) but upside should be limited to 0.9950 and price should falter well below previous support at 0.9987, bring another decline.
Trade Idea : GBP/USD – Stand aside
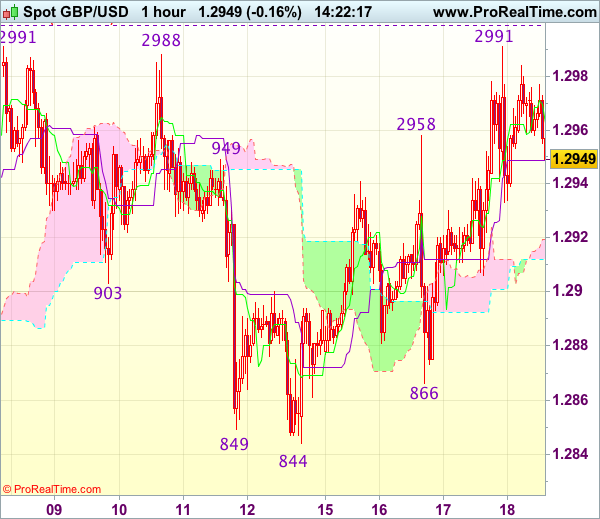
GBP/USD - 1.2940
Most recent candlesticks pattern : N/A
Trend : Near term up
Tenkan-Sen level : 1.2949
Kijun-Sen level : 1.2943
Ichimoku cloud top : 1.2912
Ichimoku cloud bottom : 1.2901
New strategy :
Stand aside
Position : -
Target : -
Stop : -
Although cable’s rally after finding renewed buying interest at 1.2866 earlier this week confirms the correction from 1.2991 has ended at 1.2844 earlier and retest of this level would be seen, however, above indicated level of 1.2999-00 (1.236 times projection of 1.2109-1.2616 measuring from 1.2365 and psychological resistance) is needed to retain bullishness and signal early upmove has resumed for headway to 1.3040-50, then 1.3075-80.
In view of this, would not chase this rise here and would be prudent to stand aside for now. Below 1.2900-10 would prolong consolidation and risk weakness towards support at 1.2866, however, price should stay above said support at 1.2844.
Trade Idea : EUR/USD – Buy at 1.1065
EUR/USD - 1.1129
Most recent candlesticks pattern : N/A
Trend : Near term up
Tenkan-Sen level : 1.1147
Kijun-Sen level : 1.1127
Ichimoku cloud top : 1.1075
Ichimoku cloud bottom : 1.1020
Original strategy :
Buy at 1.1065, Target: 1.1185, Stop: 1.1030
Position : -
Target : -
Stop : -
New strategy :
Buy at 1.1065, Target: 1.1185, Stop: 1.1030
Position : -
Target : -
Stop : -
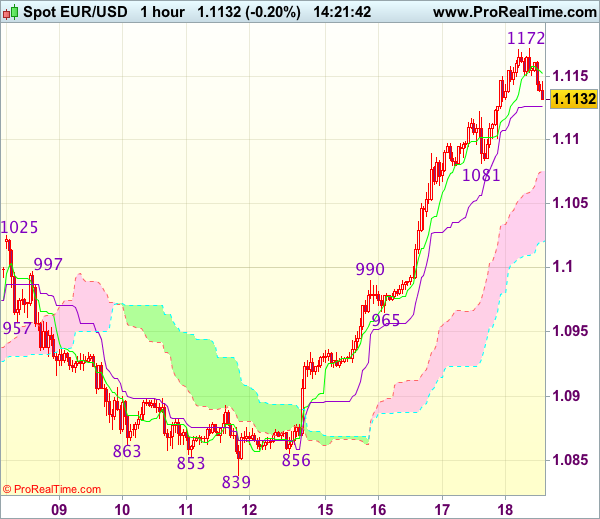
As the single currency has eased after rising to 1.1172, suggesting minor consolidation would be seen and pullback to 1.1100 and possibly support at 1.1081 cannot be ruled out, however, reckon 1.1060-65 would limit downside and bring another rise later, above said resistance at 1.1172 would extend recent rise towards 1.1205-10 (1.618 times projection) but reckon 1.1250 would hold from here, bring retreat later.
In view of this, would not chase this rise here and we are looking to buy euro on pullback as 1.1065-70 should limit downside. Below previous resistance at 1.1025 (now support) would defer and suggest top is possibly formed instead, risk test of another previous resistance at 1.0990 first.
Daily Technical Outlook And Review: EUR/USD, GBP/USD, AUD/USD, USD/JPY, USD/CAD, USD/CHF, DOW 30, GOLD
A note on lower timeframe confirming price action...
Waiting for lower timeframe confirmation is our main tool to confirm strength within higher timeframe zones, and has really been the key to our trading success. It takes a little time to understand the subtle nuances, however, as each trade is never the same, but once you master the rhythm so to speak, you will be saved from countless unnecessary losing trades. The following is a list of what we look for:
- A break/retest of supply or demand dependent on which way you're trading.
- A trendline break/retest.
- Buying/selling tails ... essentially we look for a cluster of very obvious spikes off of lower timeframe support and resistance levels within the higher timeframe zone.
- Candlestick patterns. We tend to only stick with pin bars and engulfing bars as these have proven to be the most effective.
We typically search for lower-timeframe confirmation between the M15 and H1 timeframes, since most of our higher-timeframe areas begin with the H4. Stops are usually placed 1-3 pips beyond confirming structures.
EUR/USD
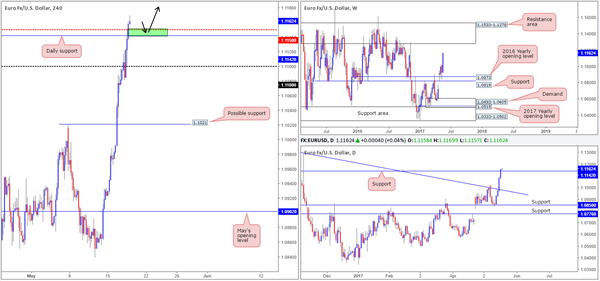
The single currency rallied for a fourth consecutive day on Wednesday, resulting in price closing beyond a daily resistance level coming in at 1.1142. With the US dollar index showing little support until we reach the 97.00ish neighborhood, and the EUR without stable resistance until the weekly resistance area at 1.1533-1.1278, we feel further upside will continue to be seen. To take advantage of this potential advance, we're watching for H4 price to retest 1.1142/1.1150: the daily support and a H4 mid-level barrier at 1.1150.
Our suggestions: Following a retest of 1.1142/1.1150, we'd be looking for a reasonably sized H4 bullish candle to take shape, preferably a full-bodied candle. This, for us, indicates buyer interest at a high-probability buy zone. The first take-profit target from here would be the 1.12 handle. Nevertheless, the ultimate take-profit zone for this trade is likely to be set around the underside of the weekly resistance area coming in at 1.1278.
Data points to consider: ECB President Draghi speaks at 6pm. US unemployment claims at 1.30pm GMT+1.
Levels to watch/live orders:
- Buys: 1.1142/1.1150 ([waiting for a reasonably sized H4 bull candle, preferably a full-bodied candle, to form before pulling the trigger is advised] stop loss: ideally beyond the candle's tail).
- Sells: Flat (stop loss: N/A).
GBP/USD
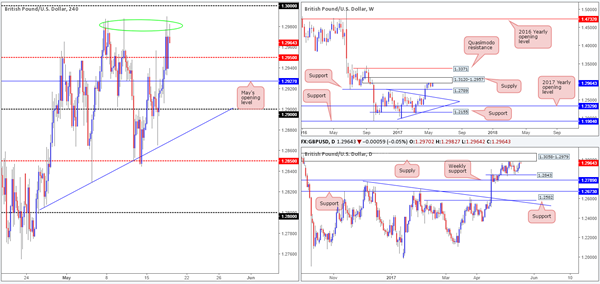
Weighed on heavily by, what seems to be, never-ending selling pressure on the dollar, the GBP advanced higher on Wednesday. This, as you can see on the bigger picture, has lifted the unit up to both a weekly supply area at 1.3120-1.2957, as well as a daily supply zone drawn from within the weekly base at 1.3058-1.2979.
Swinging over to the H4 chart, recent action has formed a rather eye-catching triple top around the 1.2980 vicinity (see the green circle). Although offers seem to be developing here, let's be mindful to the fact that there's a humongous psychological level sitting a mere 20 pips above this resistance at 1.30!
Our suggestions: On account of the above, we believe that the odds of H4 price breaking above the triple-top formation is high. There's likely a truckload of buy stops planted just above these highs, and if we know that, so do smart money. These stops will highly likely provide enough liquidity to fake price to the 1.30 level for a reasonable selling opportunity. Couple all of this with where the instrument is presently trading on the higher-timeframe structure; we believe 1.30 to be a high-probability sell zone.
Because the fakeout will likely be quick and offer little time to secure additional confirmation at 1.30, we would consider entering at market here and targeting the H4 mid-level support at 1.2950 as an initial take-profit zone.
Data points to consider: UK retail sales at 9.30am. US unemployment claims at 1.30pm GMT+1.
Levels to watch/live orders:
- Buys: 1.1142/1.1150 ([waiting for a reasonably sized H4 bull candle, preferably a full-bodied candle, to form before pulling the trigger is advised] stop loss: ideally beyond the candle's tail).
- Sells: Flat (stop loss: N/A).
GBP/USD
Weighed on heavily by, what seems to be, never-ending selling pressure on the dollar, the GBP advanced higher on Wednesday. This, as you can see on the bigger picture, has lifted the unit up to both a weekly supply area at 1.3120-1.2957, as well as a daily supply zone drawn from within the weekly base at 1.3058-1.2979.
Swinging over to the H4 chart, recent action has formed a rather eye-catching triple top around the 1.2980 vicinity (see the green circle). Although offers seem to be developing here, let's be mindful to the fact that there's a humongous psychological level sitting a mere 20 pips above this resistance at 1.30!
Our suggestions: On account of the above, we believe that the odds of H4 price breaking above the triple-top formation is high. There's likely a truckload of buy stops planted just above these highs, and if we know that, so do smart money. These stops will highly likely provide enough liquidity to fake price to the 1.30 level for a reasonable selling opportunity. Couple all of this with where the instrument is presently trading on the higher-timeframe structure; we believe 1.30 to be a high-probability sell zone.
Because the fakeout will likely be quick and offer little time to secure additional confirmation at 1.30, we would consider entering at market here and targeting the H4 mid-level support at 1.2950 as an initial take-profit zone.
Data points to consider: UK retail sales at 9.30am. US unemployment claims at 1.30pm GMT+1.
Levels to watch/live orders:
- Buys: Flat (stop loss: N/A).
- Sells: 0.7450/0.7442 ([waiting for a reasonably sized H4 bear candle, preferably a full-bodied candle, to form before pulling the trigger is advised] stop loss: ideally beyond the candle's wick). 0.7481/0.7470 ([waiting for a reasonably sized H4 bear candle, preferably a full-bodied candle, to form before pulling the trigger is advised] stop loss: ideally beyond the candle's wick).
USD/JPY
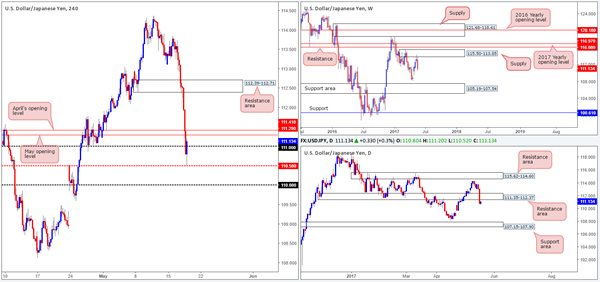
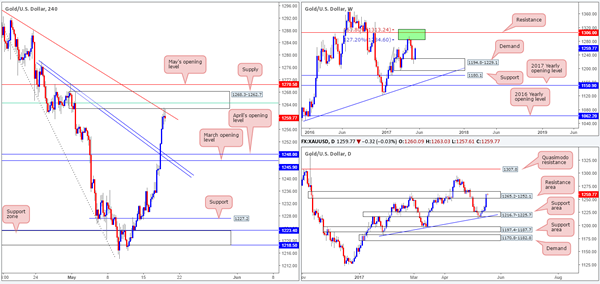
The USD/JPY, as well as US equities, underwent a serious downside correction yesterday. Several H4 tech supports were taken out during the assault, with price recently stabilizing only after reaching the H4 mid-level support at 110.50. As we write, price is seen hovering back above the 111 handle, looking poised to challenge April/May's opening levels at 111.41/111.29.
With weekly flow indicating that the next downside target, apart from the weekly low of 108.13, is the support area at 105.19-107.54, and daily action looking as though it is going to retest the underside of a resistance area at 111.35-112.37, sell trades are favored.
Our suggestions: In view of the two H4 monthly levels converging nicely with the underside of the said daily resistance area, we feel this would be an ideal base for a short today. The only grumble we have is the 111 handle seen below which could act as support and halt selling. Therefore, what we'd like to see is a H4 bearish rotation candle form from 111.41/111.29 that CLOSES below 111. This, for our team, would be a superb signal to short, targeting 110.50 as an initial take-profit area.
Data points to consider: US unemployment claims at 1.30pm GMT+1.
Levels to watch/live orders:
- Buys: Flat (stop loss: N/A).
- Sells: 111.41/111.29 region ([waiting for a reasonably sized H4 bear candle, preferably a full-bodied candle, to form that closes beyond 111 is advised] stop loss: ideally beyond the candle's wick).
USD/CAD
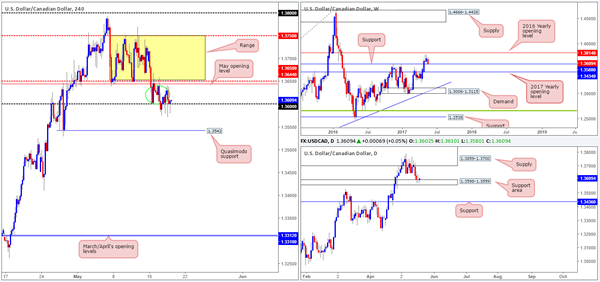
The 1.36 handle, as you can see, has been a bit of a support magnet of late, despite multiple attempts to break lower. This could have something to do with that fact that the USD/CAD is also seen testing a daily support area coming in at 1.3598-1.3559 that holds a weekly support level at 1.3588 within.
To our way of seeing things, trading long at current prices is risky. Not only is there a lot of nearby H4 traffic seen circled in green, but there's also May's opening level at 1.3644, followed closely by the lower edge of the recent H4 range at 1.3650 to contend with.
Our suggestions: The next best option we have, in our opinion, is waiting for a decisive H4 close above 1.3650 to confirm higher prices may be in order. Should this come to fruition and follow up with a retest of this number and a reasonably sized H4 bull candle, preferably a full-bodied candle, we'd look to long this market, targeting the upper edge of the H4 consolidation sited at 1.3750.
Data points to consider: US unemployment claims at 1.30pm GMT+1.
Levels to watch/live orders:
- Buys: Watch for a H4 close above 1.3650 and then look to trade any retest of this number thereafter ([waiting for a reasonably sized H4 bull candle, preferably a full-bodied candle, to form following the retest before pulling the trigger is advised] stop loss: ideally beyond the candle's tail).
- Sells: Flat (stop loss: N/A).
USD/CHF
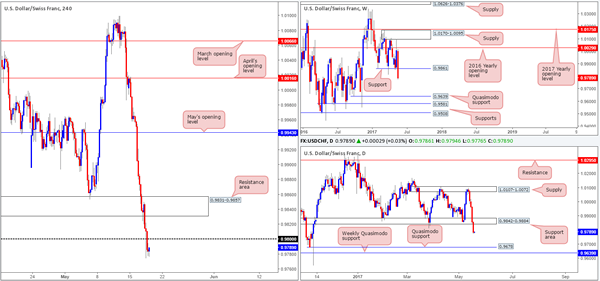
H4 demand at 0.9831-0.9857, as you can see, failed to provide support yesterday, forcing the Swissy lower. Following this, price went on to attack the 0.98 handle, which also happened to give way during the later hours of the US segment. This break lower – coupled with higher-timeframe structure could imply further downside is on the cards today. The daily support area at 0.9842-0.9884, which happens to hold the weekly support level at 0.9861 within, was taken out yesterday in strong fashion. In our estimation, this has placed the daily Quasimodo support at 0.9678 in view, followed closely by a weekly Quasimodo support penciled in at 0.9639.
Our suggestions: Given that downside is clearly favored at the moment, we have our eye on trading any retest seen at 0.98. A reasonably sized H4 bearish candle printed from this number (preferably a full-bodied candle) would be enough evidence to short, targeting the 0.97 handle, which sits just above the said daily/weekly Quasimodo support levels.
Data points to consider: US unemployment claims at 1.30pm GMT+1.
Levels to watch/live orders:
- Buys: Flat (stop loss: N/A).
- Sells: 0.98 region ([waiting for a reasonably sized H4 bear candle, preferably a full-bodied candle, to form before pulling the trigger is advised] stop loss: ideally beyond the candle's wick).
DOW 30
(Trade update: Took a loss at 20710).
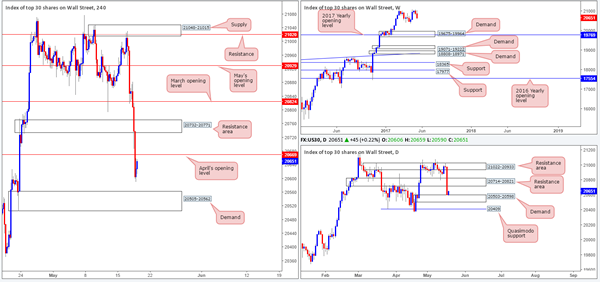
US equities aggressively tumbled lower on Wednesday, as mayhem surrounding the Trump administration shook global markets. H4 price took out several tech supports and ended bottoming just ahead of demand coming in at 20505-20562. As we write, the market is bid and looks poised to challenge the underside of April's opening level at 20669. However, on the other side of the field, daily demand at 20503-20598 was recently brought into the action, which could potentially force the index up to a resistance area drawn from 20714-20821.
Our suggestions: From our perspective, neither a long nor short seems attractive at this time. Buying into a monthly opening level from the daily demand base would not be something we'd look to accommodate. By the same token, selling from this monthly line would be just as risky given the daily demand currently in motion. With that in mind, we'll remain on the sidelines for now and wait for further developments.
Data points to consider: US unemployment claims at 1.30pm GMT+1.
Levels to watch/live orders:
- Buys: Flat (stop loss: N/A).
- Sells: 0.98 region ([waiting for a reasonably sized H4 bear candle, preferably a full-bodied candle, to form before pulling the trigger is advised] stop loss: ideally beyond the candle's wick).
DOW 30
(Trade update: Took a loss at 20710).
US equities aggressively tumbled lower on Wednesday, as mayhem surrounding the Trump administration shook global markets. H4 price took out several tech supports and ended bottoming just ahead of demand coming in at 20505-20562. As we write, the market is bid and looks poised to challenge the underside of April's opening level at 20669. However, on the other side of the field, daily demand at 20503-20598 was recently brought into the action, which could potentially force the index up to a resistance area drawn from 20714-20821.
Our suggestions: From our perspective, neither a long nor short seems attractive at this time. Buying into a monthly opening level from the daily demand base would not be something we'd look to accommodate. By the same token, selling from this monthly line would be just as risky given the daily demand currently in motion. With that in mind, we'll remain on the sidelines for now and wait for further developments.
Data points to consider: US unemployment claims at 1.30pm GMT+1.
Levels to watch/live orders:
- Buys: Flat (stop loss: N/A).
- Sells: 1268.3-1262.7 ([possible shorts from here if the current H4 candle closes on or very near its lows] stop loss: ideally beyond the candle's wick).
Trade Idea : USD/JPY – Sell at 112.05
USD/JPY - 111.37
Most recent candlesticks pattern : N/A
Trend : Near term down
Tenkan-Sen level : 111.05
Kijun-Sen level : 111.55
Ichimoku cloud top : 113.11
Ichimoku cloud bottom : 112.90
Original strategy :
Sell at 112.50, Target: 111.30, Stop: 112.85
Position : -
Target : -
Stop : -
New strategy :
Sell at 112.05, Target: 110.85, Stop: 112.40
Position : -
Target : -
Stop : -
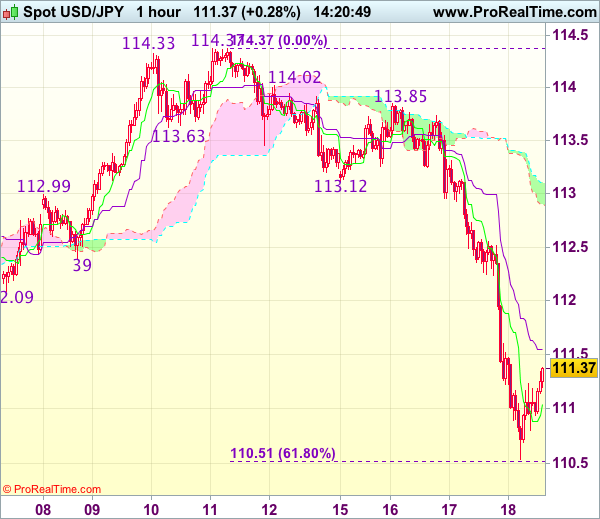
As the greenback has finally recovered after falling to 110.53 (just held above 61.8% Fibonacci retracement of 108.13-114.37 at 110.51), suggesting consolidation above this level would be seen and test of the Kijun-Sen (now at 111.55) is likely, however, reckon upside would be limited to previous support at 112.09 and bring another decline, break of said support at 110.51-53 would extend selloff from 114.37 top to 110.25-30 but reckon 110.00 would hold from here.
In view of this, would not chase this fall here and would be prudent to sell dollar on subsequent recovery as 112.05-10 should limit upside and bring another decline. Above 112.25 would defer and risk a stronger rebound to 112.55-60 first.
European Open Briefing: Another Risk-Off Session
Global Markets:
- Asian stock markets: Nikkei down 1.50 %, Hang Seng lost 0.30 %, ASX 200 down 1.40 %
- Commodities: WTI Oil at $48.90 (-0.30 %), Brent Oil at $52.00 (-0.30%), Gold at $1260 (+0.15 %), Silver at $16.86 (-0.25 %)
News & Data:
- Australia Employment Change Apr: 37.4k, Est. (5k), Prior (60.9k)
- Australia Unemployment Rate Apr 5.7%, Est. (5.90%), Prior (5.90%)
- New Zealand Consumer Confidence Index (May) 123.9, Prior (121.7)
- New Zealand Consumer Confidence (MoM) May 1.8%, Prior (-2.8%)
- Japan GDP SA (QoQ) Q1 P: 0.5%Est. (0.40%), Prior (0.30%)
- Japan GDP Annualized SA (QoQ) Q1 P: 2.2% Est. (1.80%), Prior (1.20%)
Markets Update:
Another risk-off session as the markets remain worried about the crisis within the White House. US President Trump is facing on-going criticism about his practices, and the recent allegations are the most serious ones so far. It is clear that the planned tax reform will once again have to wait. Trump has plenty of other issues that he has to deal with at the moment.
This led to profit taking in the global equity markets. The SP 500 declined more than one percent, and all the major EU indices fell too. The short-term outlook for the global stock markets has turned negative.
The risk-off sentiment was also present in the FX market. After breaking below a key support level at 113, downside momentum in USDJPY accelerated sharply and the pair declined towards 111. The next important support level now lies at 110. As there are not many near-term catalysts that could support the Dollar, the pair will likely remain under pressure.
Meanwhile, the Euro continues to show strength. Good economic data out of the Euro Zone have been supporting the currency. The outlook looks also bullish from a technical perspective. The next significant resistance level now lies at 113.
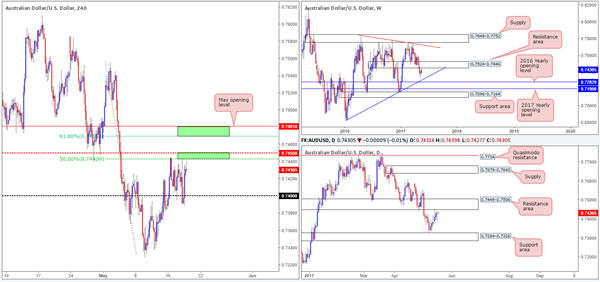
While the US Dollar is rather weak, the Australian Dollar failed to benefit much from it. The risk-off theme is weighing on the AUD as well. It would need a clear break above .7450 resistance to change that. AUDUSD could then head towards 0.76.
Upcoming Events:
- 09:30 BST – UK Retail Sales
- 13:30 BST – US Initial Jobless Claims
- 13:30 BST – US Philadelphia Manufacturing Index
Near-Term Economic And Political Divergence Fueld EURUSD Rally
USD's slump accelerated as increasing political uncertainty, accompanying disappointing inflation data, has intensified concerns over the country's growth outlook. Four consecutive days of selloff, accumulating loss of over -2%, has sent the DXY index to a 6-month low of 97.33 before recovery. Leading the rally against US dollar was the euro. With removal of one political risk after the French election, the market has turned its attention to the region's economy of which the development have been encouraging. Rebound in inflation and positive sentiment indices have raised speculations that the ECB would add some hawkish twists in its forward guidance. EURUSD has rallied as much as +2.7% over the past 4 trading days. The sustainability of the single currency's strength depends on the tone of ECB and FOMC meeting statements in June.
Former FBI Director James Comey backfired after fired by Trump. He allegedly said in a memo that Trump has asked him to drop the investigation into ex-national security advisor Michael Flynn. As Reuters noted, 'reports that US President Donald Trump had asked then-FBI Director James Comey to end a probe into his former national security adviser have raised questions over whether obstruction of justice charges could be laid against the president”. The case has heightened concerns that political issues might postpone, and raise the difficulty of, the implantation of Trump's economic plan, a theme underpinning the reflation trade of US stocks following Trump's victory in the presidency. Such concern is not without ground. Indeed, Trump's withdrawal of his healthcare plan, after repealing Obamacare, evidenced the internal conflict amongst the Republicans. It is not an easy task to over the dispute and get a bill passed despite its majority in both the House of Representatives and the Senate.
US' inflation has shown signs slowing down. Headline CPI moderated to +2.2% y/y in April, down from +2.4% and +2.8% in March and +2.8% in February, respectively. Core CPI eased for a third consecutive month to +1.9% y/y in April. Yet, it would unlikely alter the Fed's schedule of two more rate hikes this year (market consensus: one in June).
In the Eurozone, euro's rally after the French presidential election was recharged by upbeat economic data. Headline CPI was confirmed at 1.9% y/y in April, marking acceleration from +1.5% a month ago. Core inflation, which excludes energy and seasonal food products, accelerated to +1.2% y/y from +0.8% y/y in March. The economic sentiment strengthened. The ZEW economic sentiment index for the Eurozone jumped +8.8 points to 35.1. For Germany, the biggest economy in the bloc, the reading climbed +1.1 point to 20.6 in May. Yet, the market had anticipated a strong increase to 22. The current situation index soared +3.8 points to 83.9.
The bloc's trade surplus to 23.1B euro in March, beating expectations of, and February's, 18.8B euro. Upbeat macroeconomic data have raised speculations that the ECB might adjust guidance, while maintaining the monetary policy and QE program unchanged, as growth risks are more balanced.
The scenario has presented a policy divergence in favor of the euro in the near-term. With the Fed's two more rate hike almost priced in (bet for a June rate hike dropped), improving economic developments in the Eurozone has narrowed the negative German-US yield spread to a level not seen since November. This has supported the recent euro rally against US dollar.
Yet, whether such support can sustain depends on the June meetings (ECB and FOMC) and upcoming dataflow.