Sample Category Title
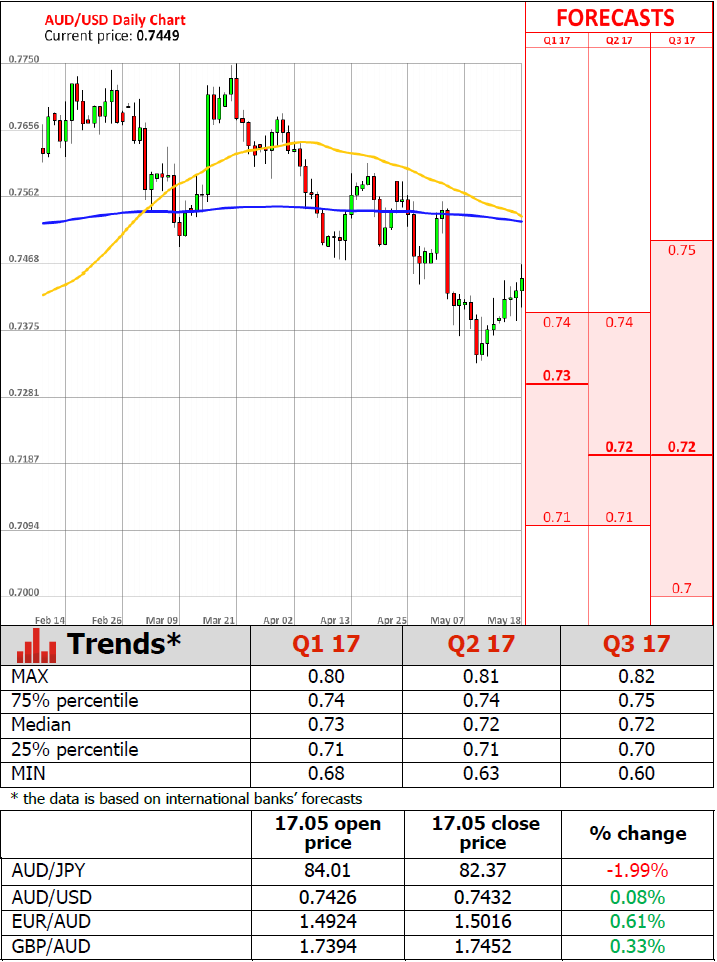
Australian Jobless Rate Falls To 5.7% In April
'For almost 18 months, the trend unemployment rate has been relatively stable, at around 5.7 to 5.8 per cent. We haven't seen this stability since the May 2007 to October 2008 period, when it remained around 4.2 to 4.3 per cent.' - Bruce Hockman, ABS Macroeconomic Statistics Division
The Australian unemployment rate dropped unexpectedly last month as companies created more new jobs. The Australian Bureau of Statistics reported on Thursday that companies added 37.4K new jobs to the economy in April, following a downwardly revised gain of 60K in the previous month and surpassing forecasts for an increase of 5,000 jobs. However, they were all part-time, while full-time employment lost 11.6K jobs in the reported month. Thus, the unemployment rate fell to 5.7% in April, whereas analysts expected the jobless rate to remain unchanged at 5.9%. The number of people looking for a full-time job dropped 12.3K to 514.2K, whereas the number of people looking for a part-time job fell 6,8000 to 218,000. Moreover, the participation rate remained unchanged at 64.8% in April, beating expectations for a decrease to 64.7%. Other data released by the Melbourne Institute showed that consumer inflation would probably climb 4.0% year-over-year in May, following the prior month's 4.1%. Back in the Q1 of 2017, the Bureau Statistics reported that its CPI advanced 2.1% on an annual basis.
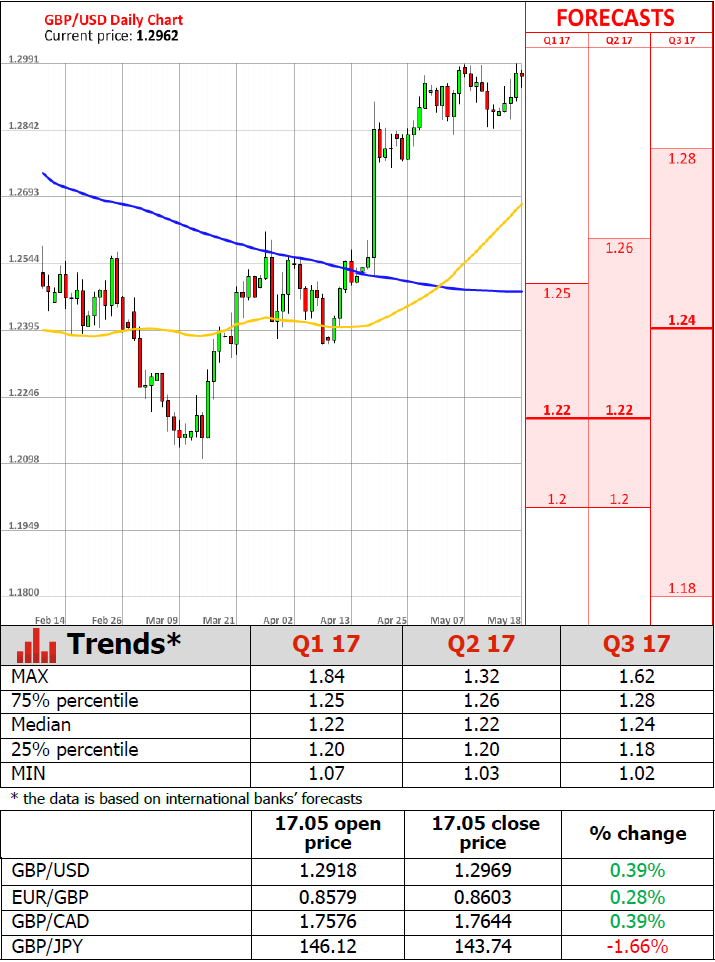
British Inflation-Adjusted Wage Growth Slows While Jobless Rate Drops To Four-Decade Lows
'It is now hard to see where a pay revival in Britain will come from.' - Martin Beck, Oxford Economics
Pay growth in the United Kingdom dropped below inflation for the first time in more than two years, official figures revealed on Wednesday. The Office for National Statistics reported that wage growth, excluding bonuses, advanced 2.1% on an annual basis in the March quarter, the weakest gain since the three-month period to July 2016. Thus, pay growth adjusted for inflation dropped 0.2%, the first decline since the Q3 of 2014. Including bonuses, average hourly earnings increased 2.4% in the Q1 of 2017, after rising 2.3% in the three-month period to February. Nevertheless, the unemployment rate fell to 4.6%, the lowest in more than forty years, suggesting that the British labour market remained strong despite weak wage growth. Meanwhile, market analysts expected the jobless rate to remain unchanged at 4.5% during the reported month. However, the claimant count change rose a seasonally adjusted 19.4K in April, following an upwardly revised climb of 33.5K in the preceding month. If pay growth remains below inflation growth consumer spending will likely stop supporting economic growth in Britain.
Crude Oil Inventories Drop 1.8M Barrels Last Week
'The numbers beneath the surface were rather mixed with gasoline stocks falling only slightly on weaker demand and sharply higher imports suggesting sufficient availability of crude oil internationally despite OPEC cuts.' - Carsten Fritsch, Commerzbank AG
Crude oil inventories in the United States dropped less than expected last week, a weekly report showed on Wednesday. The Energy Information Administration reported US crude stockpiles fell 1.8M barrels in the week ending May 12, following the preceding week's drop of 5.2M barrels and falling behind expectations for a 2.5M-barrel decline. US production fell 9K barrels per day to 9.305M barrels per day, the first drop in 13 weeks. Nevertheless, the production levels remained below the EIA's 2017 production target of 9.31M barrels per day. Wednesday's report also showed that US crude imports climbed 577K barrels per day last week, whereas exports advanced 400K barrels per day. Total US inventories decreased 3% to 520.8M barrels last week. The data suggested that the OPEC production cut deal started bearing fruit at last. Thus, oil prices jumped shortly after the release, with Brent futures hitting $52.45 per barrel and WTI futures climbing to $49.50 per barrel. In the meantime, gasoline inventories declined 413K barrels during the same week, while analysts held forests for a 731K-berrel plunge.
Canadian Manufacturing Rebound Amid Higher Food And Motor Vehicle Sales
'The data overall should maintain confidence in the manufacturing sector, especially with a solid increase in new and unfilled orders.' - Tim Clayton, Economic Calendar
Canadian manufacturing sales rebounded in March but less than expected amid higher demand for motor vehicles and higher sales in the food industry. Statistics Canada reported on Wednesday that manufacturing sales rose 1.0% in March, following the preceding month's downwardly-revised fall of 0.6% and slightly missing analysts' expectations for a 1.1% gain. In volume terms, sales were up 0.2%. Data showed that sales rose in 16 out of 21 industries in the reported month, representing 71% of the total manufacturing sector output. The largest gain of 2.1% was posted by the transportation sector. The following increase of 2.1% was mainly driven by highest sales of vehicles and vehicle part. Furthermore, food sales climbed for the second straight time, rising 2.6% to a record high of C$8.9B. Sales of meat and dairy products contributed the most to the rise. New orders rose 2.6%, marking the fourth consecutive increase. Wednesday's data also showed that inventories advanced 1.2% to a record high of C$72.7B, with the inventory-to-sales ratio remaining unchanged at 1.35.
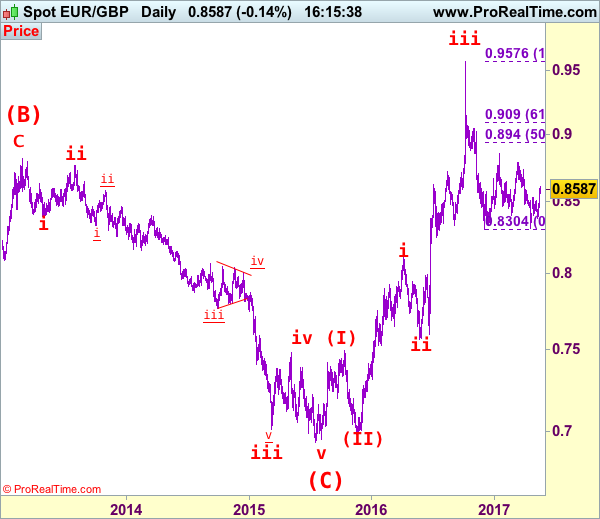
EUR/GBP Elliott Wave Analysis
EUR/GBP – 0.8540
EUR/GBP – The major (A)(B)(C)-(X)-(A)(B)(C) correction from 0.9805 is unfolding and 2nd (A) has possibly ended at 0.6936.
This week’s rally above indicated previous resistance at 0.8531 adds credence to our view that another leg of corrective rise from 0.8312 is underway and above this week’s high at 0.8615 would extend gain to 0.8650-60 and possibly towards 0.8700, however, as broad outlook remains consolidative, reckon upside would be limited and resistance at 0.8735 should cap upside, bring further choppy trading later.
Our latest preferred count is that the wave V of a 5-wave series from 0.5682 ended at 0.9805 earlier and major from there has possibly ended at 0.8067 as A-B-C-X-A-B-C. We are keeping our view that the entire correction from 0.9805 has possibly ended at 0.7756 and as labeled as the attached daily chart and impulsive move from 0.9084 has ended at 0.7756 as a 5-waver which marked either the (C) wave or the A leg of (C), a daily close above resistance at 0.8831 would suggest (C) leg has ended and headway towards 0.9084.
On the downside, whilst initial pullback to 0.8500-05 cannot be rule out, reckon 0.8455-60 would limit downside and bring another rise later. Below 0.8425-30 would abort and signal top is formed instead, bring test of indicated support at 0.8384 (last week’s low), however, only a daily close below there would shift risk back to downside and signal the rebound from 0.8312 has ended, then further fall to 0.8350-60 would follow.
Recommendation: Buy at 0.8500 for 0.8650 with stop below 0.8400
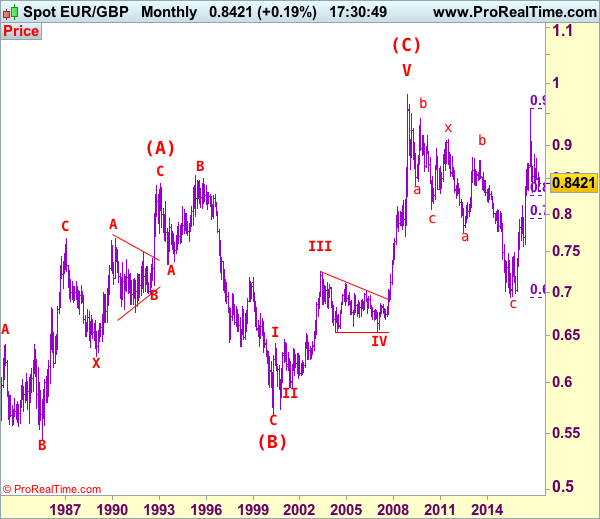
Euro's long term uptrend started in Feb 1981 at 0.5039 and is unfolding as a (A)-(B)-(C) move with (A): 0.8433 (Feb 1993), (B): 0.5682 (May 2000) and impulsive wave (C) should have ended at 0.9805 with wave III ended at 0.7254 (May 2003), triangle wave IV at 0.6536 (23 Jan 2007) and wave V as well as wave (C) has ended at 0.9805.
We are keeping an alternate count that only wave III ended at 0.9805 and the correction from there is the wave IV and may extend weakness to 0.7700, however, it is necessary to see a daily close above resistance at 0.9143 would change this to be the preferred count.
Trump Faces Biggest Political Crisis Since Taking Office
The Department of Justice has appointed former FBI head Robert Mueller to investigate whether Russia intervened during the 2016 presidential election. Recent reports from the US are indicating that the probability that Trump's presidency will end this year is around 29% following the Russia leak scandal. Trump is now facing his biggest political crisis since taking office.
Opinion polls, conducted by Politico and Morning Consult, that were released on Wednesday showed that Trump's approval rating has hit a new low of 42% with half of the registered voters disapproving of Trump's performance as a president. Polls, conducted by Public Policy Polling, are showing 48% of All Americans and 81% of Hilary's voters hope to see Trump's presidency to end. With the lack of support from his own Republican Party, Trump's political career and USD prospects become even more gloomy.
Following the firing of FBI director James Comey it was reported that the two candidates to replace him, Judge Merrick Garland and Senate John Cornyn, both showed no interests to take over the position.
The leak scandal hit USD and US stock markets, pushing safe havens up. The VIX index (volatility index) rallied more than 20% on Wednesday.
On Wednesday, the dollar index saw its fourth straight loss hitting a low of 97.30 (last seen November 9 2016). The Index has retraced around 2.22% from May 12 to 17. USD/JPY saw its biggest intra-day loss this year hitting a 3-week low of 110.51. EUR/USD saw its fourth straight gain hitting a high of 1.1171 (again last seen November 9 2016). Spot gold surged hitting a 2-and-a-half week high of $1263.
The Dow Jones index fell by 1.76%, hitting a low of 20591.80 & the S & P 500 index fell by 1.82%, hitting a low of 2353.33 (both lows not seen since April 21).
During the early European session, on Thursday, the dollar index saw a moderate rebound with bulls attempting to recover the 97.50 level. The disappointment with Trump's administration, some soft economic data and profit-taking has resulted in USD has giving up almost all its post presidential gain.
Since Trump took office in January, apart from passing the new healthcare bill, there are hardly any other worthy achievements. Instead, most of his policies have caused substantial controversy and turmoil. In addition, lack of enough support from the Republican Party makes Trump's political career and USD prospects even more gloomy.
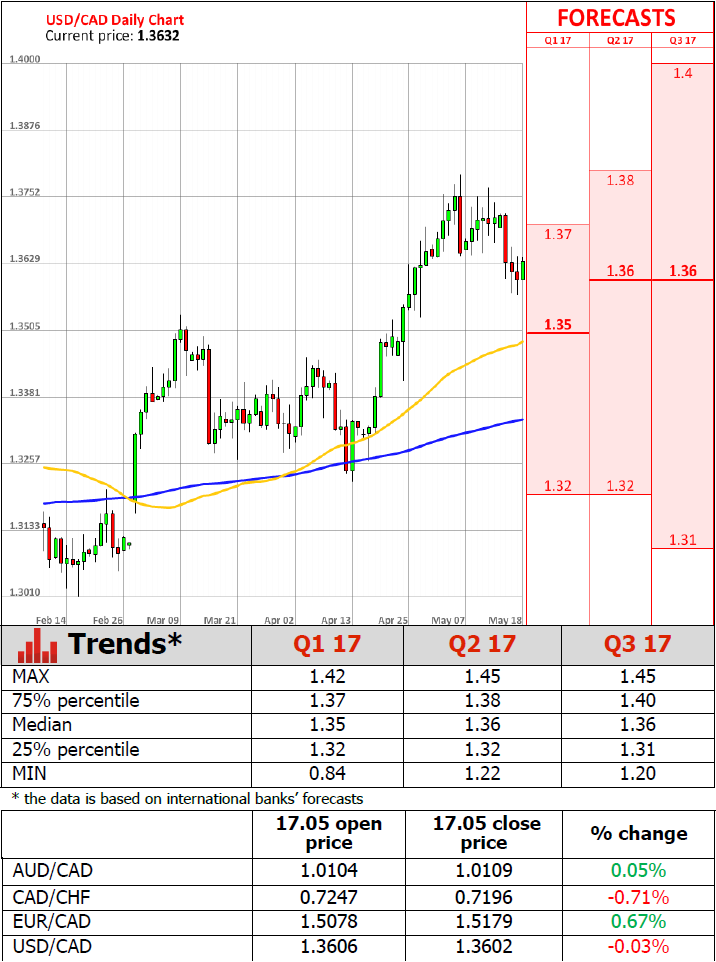
USD/CAD Elliott Wave Analysis
USD/CAD – 1.3643
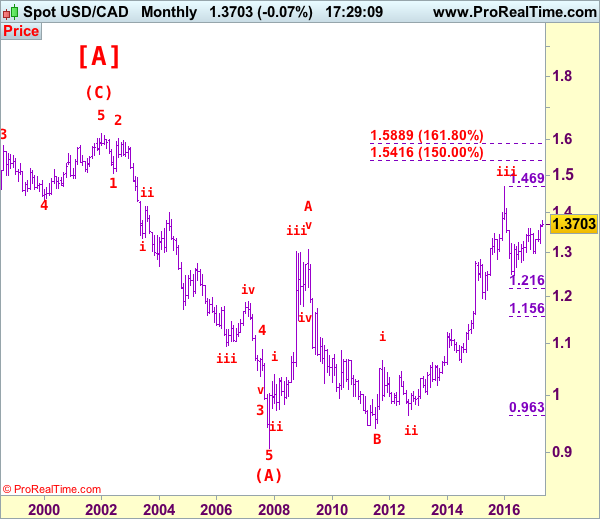
USD/CAD – Wave v ended at 0.9407 and a-b-c correction may extend gain to 1.4700
As the greenback has retreated after rising to 1.3794, suggesting consolidation below this level would take take place and initial downside risk is for pullback to 1.3570 and possibly towards 1.3520-25, however, reckon downside would be limited from there and bring rebound later, above 1.3720-25 would suggest the pullback from 1.3794 has ended, bring test of 1.3770 resistance but break there is needed to signal recent upmove has resumed for retest of 1.3794, break there would extend the erratic rise from 1.2461 low for at least a strong correction of the fall from 1.4690 (2016 high) to 1.3800 and later 1.3835-40 (61.8% Fibonacci retracement of 1.4690-1.2461), however, overbought condition would limit upside to 1.3890-00 and price should falter well below psychological resistance at 1.4000, bring retreat later.
We are keeping our view that the wave b from 1.0657 (a leg top) has possibly ended at 0.9633 with (a): 0.9800, wave (b): 1.0447 and wave c at 0.9633, the subsequent rise from there is now treated as wave c exceeded indicated upside target at 1.3770-80 and 1.4000 and wave (3) has possibly ended at 1.4690 and wave (4) correction has commenced for retracement back to 1.2832 support, then 1.2410-20.
On the daily chart, our latest preferred count remains that the A of (B) rally from 0.9059 low (7 Nov 2007) unfolded into an impulsive wave with i: 0.9059-1.0380, ii ended at 0.9819, iii at 1.3019 followed by triangle wave iv at 1.2026 , then wave v formed a top at 1.3066 and also ended the wave A. The wave B is unfolding as an double three a-b-c-x-a-b-c and is sub-divided as a: 1.2192, b: 1.2716 and wave c at 1.0784, followed by wave x at 1.1725, another set of a-b-c unfolded with 2nd a at 0.9931, 2nd b at 1.0674. the 2nd c has possibly ended at 0.9407, therefore, consolidation with upside bias is seen for major correction, indicated target at 1.3900 had been met and gain to 1.4700 would follow.
On the downside, whilst pullback to 1.3570 cannot be ruled out, reckon downside would be limited and support at 1.3530 should remain intact, bring another rise later. A daily close below 1.3530 would defer and suggest top is possibly formed, risk weakness to 1.3450-60 but break of indicated support at 1.3411 is needed to add credence to this view, bring further fall to 1.3380-85, then 1.3335-40.
Recommendation: Exit long entered at 1.3650 and stand aside for this week.
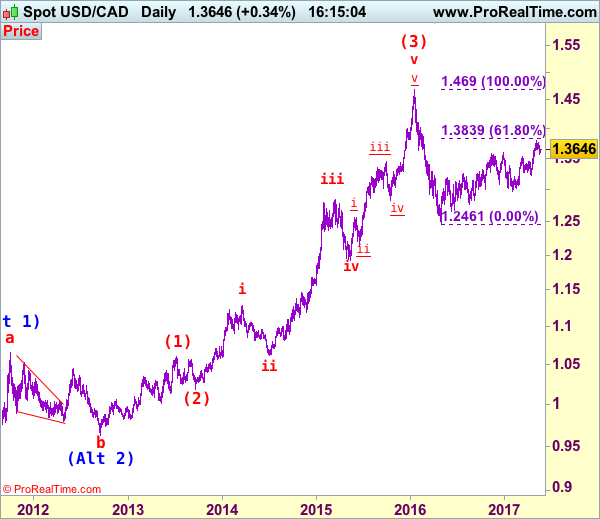
Longer term - The selloff from 1.6194 (21 Jan 2002) to 0.9059 (07 Nov 2007) is viewed as (A) wave which is a 5-waver as labeled on the monthly chart as below, the subsequently rally is labeled as (B) with impulsive A leg of (B) ended at 1.3066, wave B of (B) is unfolding which has either ended at 0.9407 or would extend one more fall but downside should be limited to 0.9200 and 0.9000 should hold.
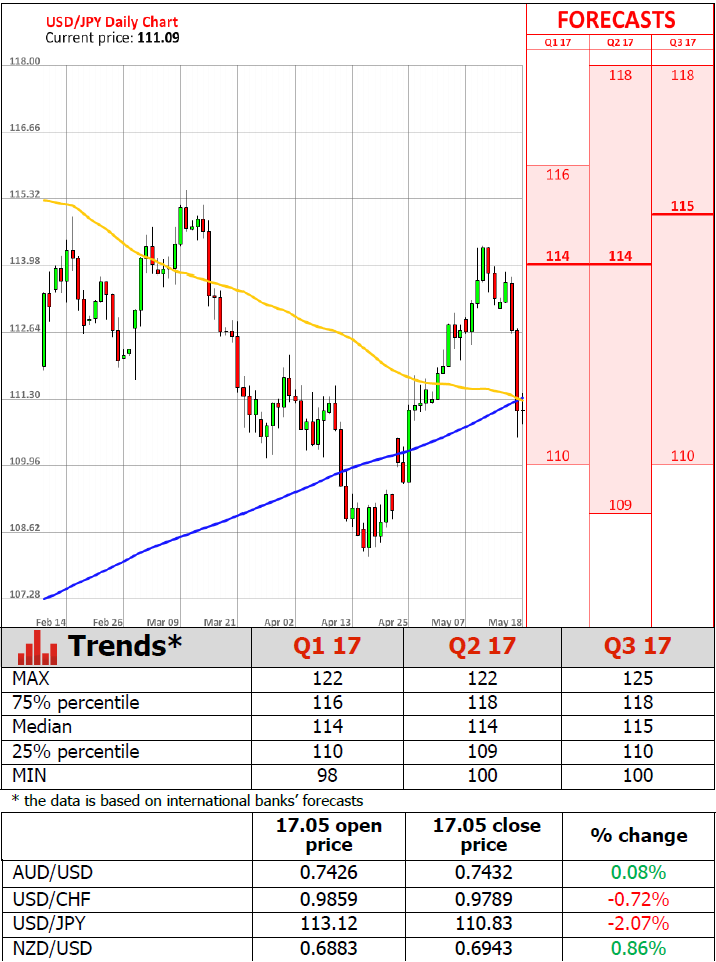
Technical Outlook: USDJPY Is Consolidating After Wednesday’s Sharp Fall, Pivotal Support At 110.50 Remains At Risk
The pair is consolidating on Thursday after falling 2.02% the previous day, on the biggest one-day fall since 29 July 2016.
Strong pressure on the dollar from political situation in the US that also strongly increased demand for safe-haven instruments, resulted in yesterday's crash of USDJPY pair.
Technical studies are turning into bearish setup after fall and shift near-term risk lower.
Solid support lies at 110.50 (Fibo 61.8% of 108.11/114.36 rally) where the pair found temporary footstep, however, today's consolidation remains capped by broken base of falling daily cloud at 111.39 and risk on retest of 110.50 handle remains in play.
Break below here would trigger large stops below and spark further weakness towards psychological 110.00 support and 200SMA at 109.70.
On the other side, strongly oversold slow stochastic on daily chart suggests correction, but no firmer bullish signal seen so far as the indicator continues to point south.
Stronger bullish signals could be expected on violation of daily cloud base which would sideline persisting downside threats.
Extended consolidation between 110.50 support and cloud base would be likely near-term scenario.
Res: 111.00, 111.23, 111.39, 111.77
Sup: 110.50, 110.00, 109.85, 109.70
Technical Outlook: Cable Is Holding Near S/T Range Highs, UK Retail Sales Data Eyed For Fresh Signals
Cable is holding at the upper side of multi-day 1.2830/1.2986 congestion and remains biased higher after upbeat UK CPI data on Tuesday and mixed jobs numbers on Wednesday supported the pair. Yesterday's acceleration higher that retested recent highs at 1.2986 and ended day in long bullish candle is positive signal. Also, daily studies in full bullish setup are supportive for final attack at psychological 1.3000 barrier, below which cable showed strong hesitation during past two weeks. On the other side, falling thick weekly cloud heavily weighs on market (cloud base lies at 1.3032) with repeated rejection under 1.3000 barrier to start generating negative signals. However, deeper pullback below 10 and 20SMA's at 1.2927/00 is needed to increase downside pressure and risk retest of lower pivots at 1.2843/30. Release of UK Retail Sales data is expected to give more clues about pair's near-term action. Forecasts are positive for Apr Retail Sales (m/m is forecasted at 1.0% vs -1.8% in Mar, while y/y forecast stands at 2.1% vs 1.7% in Mar).
Res: 1.2988, 1.3000, 1.3032, 1.3074
Sup: 1.2927, 1.2916, 1.2900, 1.2864
Technical Outlook: EURUSD – Limited Correction To Precede Fresh Upside
The Euro is taking a breather on Thursday and eases from fresh six-month high at 1.1171, posted after strong four-day rally.
The move could be described as corrective on overextended daily studies and reduced pressure on US dollar amid the latest political turmoil in the US. Also, investors are looking to take profits on recent strong rally that may push the pair lower.
In absence of data from the Eurozone today, the pair is expected to be driven by technicals and development of the political situation in the US.
Reversal signal is developing on 4-hr chart as strongly overbought RSI and slow stochastic are turning lower.
Also, slow stochastic is overbought on daily chart and is expected to generate bearish signal.
However, Euro’s strong bullish sentiment suggests that correction should be limited.
Broken Fibo 61.8% of larger 1.1614/1.0338 descend at 1.1127 is so far acting as initial support and is holding today’s action.
Extended pullback should be ideally contained by broken weekly cloud top at 1.1065, however, deeper dips may extend towards former high at 1.1020 (08 May) and psychological 1.1000 support (reinforced by rising daily Tenkan-sen) which mark lower pivots, loss of which would trigger stronger correction and sideline immediate bulls.
Res: 1.1171, 1.1201, 1.1250, 1.1300
Sup: 1.1127, 1.1078, 1.1065, 1.1020