Sample Category Title
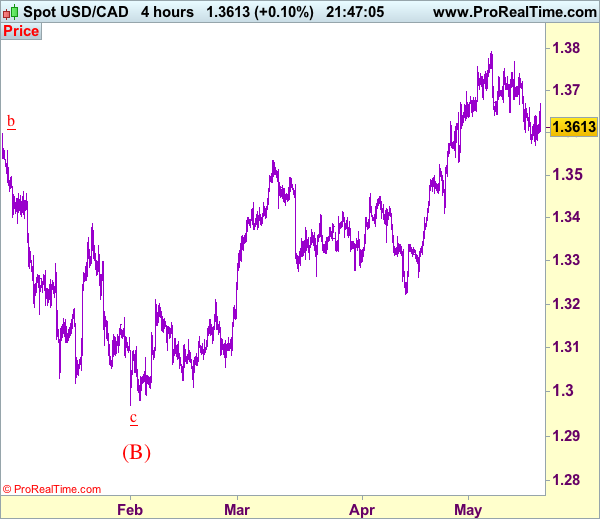
Trade Idea: USD/CAD – Buy at 1.3535
USD/CAD - 1.3615
Recent wave: Only wave v of c has ended at 0.9407 and wave C of major A-B-C correction is underway for headway to 1.4700
Trend: Near term up
Original strategy :
Buy at 1.3535, Target: 1.3735, Stop: 1.3475
Position: -
Target: -
Stop: -
New strategy :
Buy at 1.3535, Target: 1.3735, Stop: 1.3475
Position: -
Target: -
Stop:-
As the greenback has retreated after meeting resistance at 1.3670, retaining our view that further sideways trading would be seen and near term downside risk remains for the fall from 1.3794 top to bring retracement of recent rise, hence weakness to 1.3570 is likely, however, reckon downside would be limited to support at 1.3530 and bring rebound later, above 1.3670 would bring another bounce to 1.3700 but break of 1.3740-45 is needed to signal the pullback from recent high at 1.3794 has ended, bring test of 1.3770 resistance first, then towards 1.3794. Looking ahead, only a break above there would confirm recent upmove has resumed and extend further gain to 1.3840-50, then towards 1.3900.
In view of this, would not chase this rise here and would be prudent to buy again on pullback as 1.3530-35 should limit downside and bring another rise later. A firm break below 1.3530 would abort and suggest a temporary top is formed, bring retracement of recent upmove to 1.3500 and later towards 1.3450-60 but support at 1.3411 should remain intact, bring another upmove later.
To recap, wave B from 1.3066 is unfolding as an a-b-c and is sub-divided as a: 1.2192, b: 1.2716 and wave c is a 5-waver with i: 1.1983, ii: 1.2506, extended wave iii with minor iii at 1.0206, wave iv ended at 1.0781 and wave v as well as wave iii has ended at 0.9931, hence the subsequent choppy trading is the wave iv which is unfolding as (a)-(b)-(c) with (a) leg of iv ended at 1.0854, followed by (b) leg at 1.0108 and (c) leg as well as the wave iv ended at 1.0674. The wave v is sub-divided by minor wave (i): 0.9980, (ii): 1.0374, (iii): 0.9446, (iv): 0.9913 and (v) as well as v has possibly ended at 0.9407, therefore, consolidation with upside bias is seen for major correction, indicated target at 1.3700 and 1.4000 had been met and further gain to 1.4700 would be seen later.
NZD/USD Tests Downtrend Line Resistance
NZD/USD has seen a substantial 6.22% retracement since February 7.
Since the end of April, the downtrend has held above a significant support line at 0.6800, suggesting the bearish momentum has been waning.
The price further broke the next psychological level at 0.6900 on Wednesday, as a result of the weakening of USD caused by Trump's Russia leak scandal.
On the daily chart, NZD/USD bulls are currently testing the mid-term major downtrend line resistance.
If the trend line is broken, we can expect that the price will go further up.
Conversely, if the bulls fail to break the resistance, we will likely see a pullback.
The resistance level is at 0.6950, followed by 0.6970 and 0.7000.
The support line is at 0.6900, followed by 0.6870 and 0.6840.
CAC Slips as Trump’s Troubles Cast Pall on Markets
The CAC index has headed lower in the Thursday session. Currently, the CAC is trading at 5264.50, down 1.11 percent. It's a quiet day on the release front, with no French or eurozone events on the schedule. The president of the ECB, Mario Draghi, will speak at an event at the University of Tel Aviv. On Friday, the eurozone publishes current account and consumer confidence.
The political uncertainty which has gripped Washington seems to be growing by the hour, and predictably, global stock markets have responded to the crisis with losses. Faced with mounting criticism from Democrats and even some Republicans, the Justice Department has agreed to appoint a former FBI director as independent counsel to investigate possible Russian involvement in the US presidential election as well as any connection between Trump and the Russians during the election campaign. The Trump administration is in damage control mode, as the media is having a field day with bombshell reports. On Tuesday, reports surfaced that Trump had asked former FBI director James Comey to close an investigation into ties between Russia and Trump's former security adviser, Michael Flynn, leading some lawmakers to question whether Trump had committed obstruction of justice. As if this wasn't enough for Trump's aides to deal with, the president is under fire for passing classified intelligence to the Russian foreign minister. Trump initially denied the claim, but has since admitted that he did share intelligence with the Russians, arguing that he had acted within his rights. With the Trump administration frantically trying to douse political fires, investors are concerned that Trump will have more difficulty passing into law his plans for increased stimulus and tax reform.
The markets were on the money in their predictions of Eurozone GDP and and CPI data. Final CPI matched the forecast with a strong gain of 1.9% in April, considerably higher than last month's gain of 1.5%. Eurozone inflation is closing in on the ECB's target of 2.0%, which could increase pressure on the ECB to consider tapering its ultra-loose monetary policy. Germany, for one, is not pleased with the ECB's ultra-loose monetary stance, which it says is not suited to the strong economic conditions in the country. On Tuesday, Eurozone Flash GDP was unrevised from the April forecast, posting a gain of 0.5% in the first quarter. The eurozone continues to show improved numbers in 2017, boosted in no small part by the German economy, which expanded 0.6% in the first quarter.
Technical Outlook: Dow Jones Stays Under Strong Pressure
Dow Jones stays under strong pressure on Thursday and extended sharp fall from the previous day to fresh nearly one month low at 20477. The index fell 1.62% on Wednesday, marking the biggest one-day loss since 09 Sep 2016, driven by political turmoil in the US after the story about US president Trump's advisors ties with Russian officials during the campaign broke out. Strong negative sentiment hit stock markets and US benchmarks registered heavy losses. Dow penetrated deeply into thick daily cloud that was acting as good support and retraced 76.4% of 20310/21007 rally at 20477. Near-term focus turned focus lower after yesterday's strong bearish acceleration broke below 20760/21007 consolidation range, formed after repeated failures at psychological 21000 barrier. Daily studies are turning into bearish setup, with today's close below 20576 (broken Fibo 61.8% of 20310/21007) needed to signal further downside, for test of 100SMA/daily cloud base supports at 20455/20437 and possible return to key support at 20310 (19 Apr low) in extension. Some corrective action could be expected as 4-hr studies are strongly oversold and from profit-taking, however, upside attempts were so far very limited, as overall negative sentiment continues to weigh.
Res: 20576; 20660; 20742; 20839
Sup: 20477; 20455; 20400; 20310
EUR/USD Mid-Day Outlook
Daily Pivots: (S1) 1.1104; (P) 1.1133 (R1) 1.1187; More....
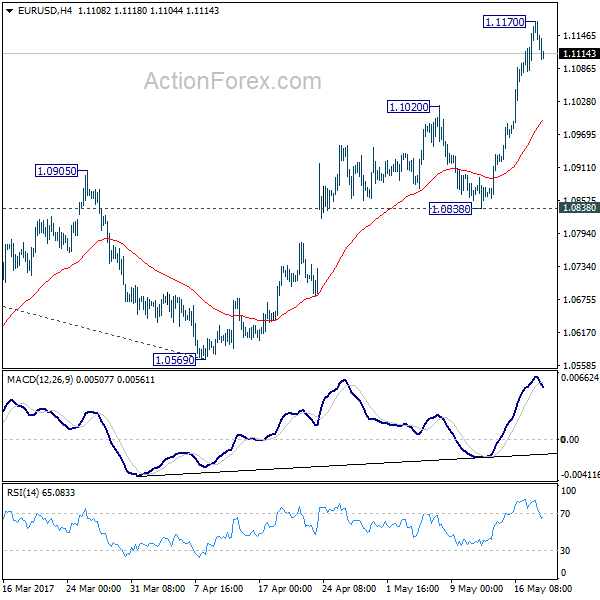
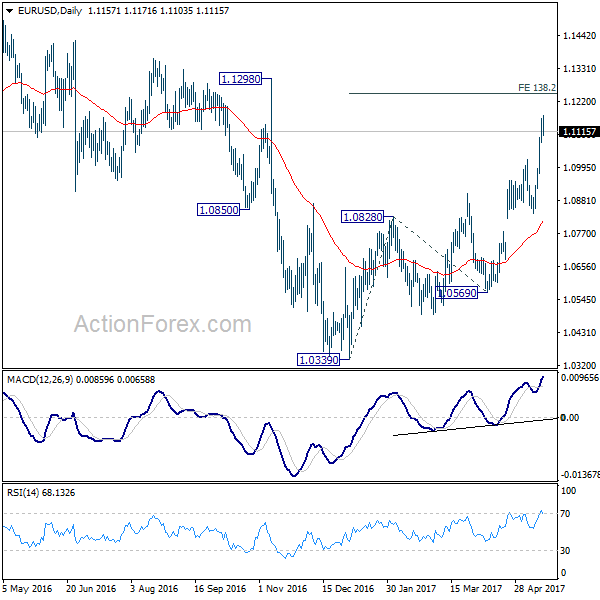
With 4 hour MACD crossed below signal line, a temporary top is formed at 1.1170 in EUR/USD. Intraday bias is turned neutral for consolidation. Downside of retreat should be contained by 1.1020 resistance turned support and bring another rise. Above 1.1170 will extend recent rally to 138.2% projection of 1.0339 to 1.0828 from 1.0569 at 1.1245, which is close to 1.1298 key resistance. For now, we'd be cautious on strong resistance between 1.1245/1298 to limit upside and bring reversal.
In the bigger picture, as long as 1.1298 key resistance holds, whole down trend from 1.6039 (2008 high) is still expected to continue. Break of 1.0339 low will send EUR/USD through parity. However, considering bullish convergence condition in weekly MACD, break of 1.1298 will indicate long term reversal. In such case, further rally would be seen back to 1.2042 support turned resistance next.
USD/CHF Mid-Day Outlook
Daily Pivots: (S1) 0.9942; (P) 0.9980; (R1) 1.0003; More.....
Intraday bias in USD/CHF remains on the downside for the moment. Current fall from 1.0342 would extend to 100% projection of 1.0342 to 0.9860 from 1.0099 at 0.9617 on breaking of lower trend line support. On the upside, above 0.9849 minor resistance will turn bias neutral and bring consolidation before staging another decline.
In the bigger picture, USD/CHF is bounded in medium term range of 0.9443/1.0342 for the moment. Consolidative trading would likely continue and medium term outlook remains neutral. Break of 1.0342 key resistance is needed to confirm underlying bullish momentum in the pair. Meanwhile, downside attempts should be contained by 0.9443 key support level.


USD/JPY Mid-Day Outlook
Daily Pivots: (S1) 110.02; (P) 111.57; (R1) 112.37; More...
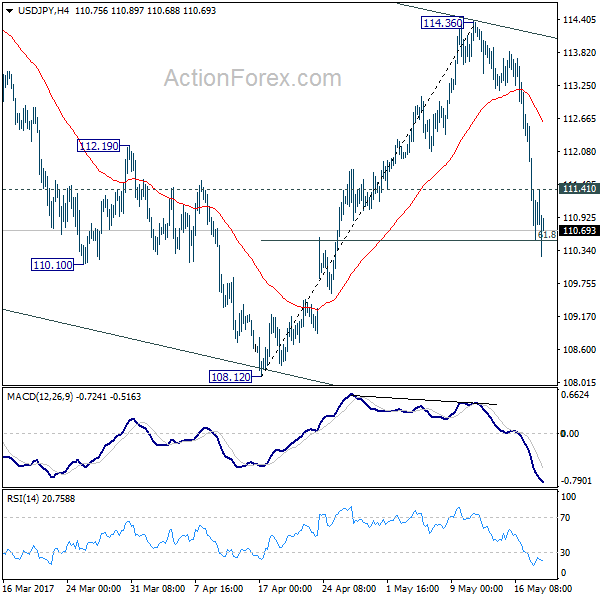
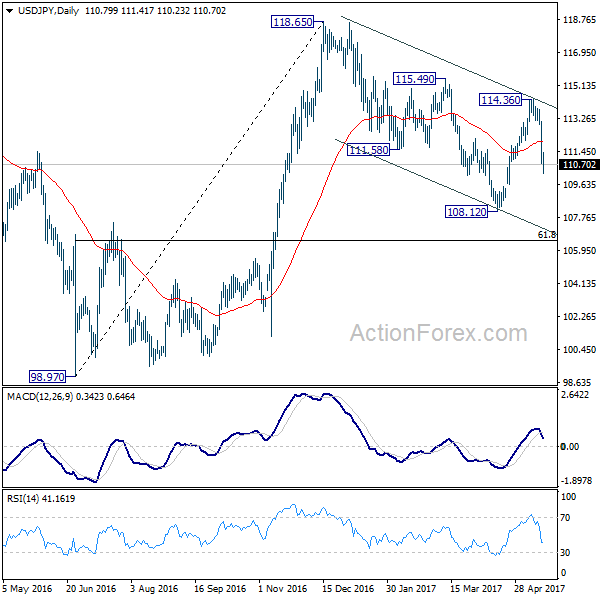
Intraday bias in USD/JPY remain son the downside for the moment. Firm break of 61.8% retracement of 108.12 to 114.36 at 110.50 will bring deeper fall to 108.12 low. In that case, the whole decline from 118.65 would likely extend through 108.12 to 61.8% retracement of 98.97 to 118.65 at 106.48. On the upside, above 111.41 minor resistance will turn intraday bias neutral first. We'll assess the structure of subsequent rebound to decide whether fall from 114.36 is completed in that case.
In the bigger picture, price actions from 125.85 high are seen as a corrective pattern. It's uncertain whether it's completed yet. But in case of another fall, downside should be contained by 61.8% retracement of 75.56 to 125.85 at 94.77 to bring rebound. Overall, rise from 75.56 is still expected to resume later after the correction from 125.85 completes.
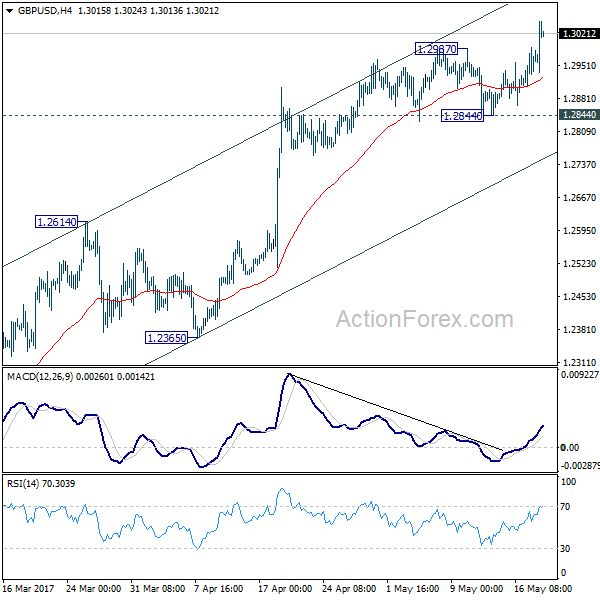
GBP/USD Mid-Day Outlook
Daily Pivots: (S1) 1.2919; (P) 1.2955; (R1) 1.3004; More...
GBP/USD's soars to as high as 1.3047 so far today. Intraday bias remains on the upside as current rise would target 1.3444 key resistance. At this point, price actions from 1.1946 are still viewed as a corrective pattern. Hence, we'd expect upside to be limited below 1.3444 to complete the correction. Though, break of 1.2844 support is needed to indicate short term topping. Otherwise, further rise would be in favor in case of retreat.
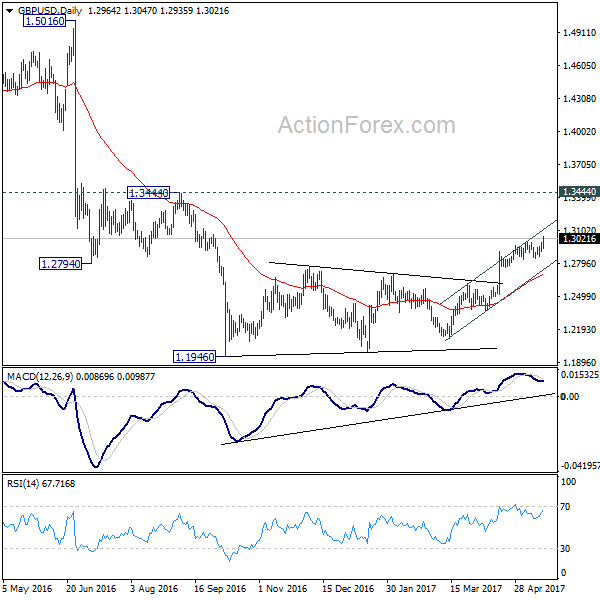
In the bigger picture, fall from 1.7190 is seen as part of the down trend from 2.1161. There is no sign of medium term reversal yet. Sustained trading below 61.8% projection of 2.1161 to 1.3503 from 1.7190 at 1.2457 will target 100% projection at 0.9532. Overall, break of 1.3444 resistance is needed to confirm medium term bottoming. Otherwise, outlook will remain bearish.
Dollar Lacks Momentum for Rebound Despite Jobless Claims Dropped to 28 Year Low
Dollar is attempting a recovery today but stays weak against Japanese Yen. Risk aversion remains the main theme in the global financial markets with all major European indices trading in red at the time of writing. US futures also point to lower open. Upbeat economic data from US provide little support to the greenback as traders stay deeply concerned with US President Donald Trump's political turmoil. Initial jobless claims dropped 4k to 232k in the week ended May 13, better than expectation of 240k. That's also the lowest level in more than 28 years since 1973. Claims has now stayed below 300k handle for 115 straight week, longest stretch since 1970. Continuing claims dropped 22k to 1.9m in the week ended May, lowest since 1988. Continuing claims also stayed below 2m level for the fifth straight week. Philly Fed survey rose to 38.8 in May, beating expectation of 18.5.
Sterling jumps after retail sales
Sterling surges today after much better than expected sales data. Headline sales rose 2.3% mom in April, beating expectation of 1.10% mom. That's also a notable improve over March's figure of -1.4%. GBP/USD finally gathers momentum to resume recent rally and surges past 1.3 handle. Nonetheless the Pound is still trading down against Euro, Swiss Franc and Japanese Yen for the week. A key to outlook of Sterling remains on BoE expectations. It's now rather clear that the central bank would tolerate overshooting inflation before having a clear picture on the result of Brexit negotiation.
Also, there are criticism that BoE's forecasts of 1.9%, 1.7% and 1.8% growth in 2017, 2018 and 2019 are too optimistic. The projections were based on the assumption of a very smooth Brexit, which is seen as unlikely. According to a Reuters Poll, 50 out of 60 economists surveyed are less optimistic than BoE about growth prospect for this year. And for 2018, 47 out of 58 economists are less upbeat.
ECB: June a good time to start considering exit
As indicated in the accounts of April 27 ECB monetary policy meeting, officials have indicated that June would be a good timing to start considering exit from stimulus. The accounts noted that "it was felt that the Governing Council's communication should be adjusted in a very gradual and cautious manner as, the current juncture, monetary and financial conditions were particularly sensitive to changes in communication." And, "after a long period of very accommodative monetary conditions, even small and incremental changes in communication could have strong signalling effects when interpreted as heralding a change in the monetary policy stance."
Nonetheless, ECB governing council member Bostjan Jazbec warned that "none of us dares to declare the victory yet." He used an analogy that "you don't go skiing immediately after you took off the cast of your last skiing accident." Also, he mentioned the so called "taper tantrum" in US back in mid-2013 when the talk of Fed tapering triggered violent market reactions. And he noted that "any abrupt changes to our measures, which all work in combination, would not be welcomed by the European economy".
Elsewhere...
Japan GDP rose 0.5% qoq in Q1, above expectation of 0.4% qoq. GDP deflator dropped -0.8% yoy, below expectation of -0.7% yoy. Australia employment grew 37.4k in April, above expectation of 5.0k. Unemployment rate dropped to 5.7%, below expectation of 5.9%. Consumer inflation expectation rose 4.0% in May.
GBP/USD Mid-Day Outlook
Daily Pivots: (S1) 1.2919; (P) 1.2955; (R1) 1.3004; More...
GBP/USD's soars to as high as 1.3047 so far today. Intraday bias remains on the upside as current rise would target 1.3444 key resistance. At this point, price actions from 1.1946 are still viewed as a corrective pattern. Hence, we'd expect upside to be limited below 1.3444 to complete the correction. Though, break of 1.2844 support is needed to indicate short term topping. Otherwise, further rise would be in favor in case of retreat.
In the bigger picture, fall from 1.7190 is seen as part of the down trend from 2.1161. There is no sign of medium term reversal yet. Sustained trading below 61.8% projection of 2.1161 to 1.3503 from 1.7190 at 1.2457 will target 100% projection at 0.9532. Overall, break of 1.3444 resistance is needed to confirm medium term bottoming. Otherwise, outlook will remain bearish.
Economic Indicators Update
| GMT | Ccy | Events | Actual | Forecast | Previous | Revised |
|---|---|---|---|---|---|---|
| 23:50 | JPY | GDP Q/Q Q1 P | 0.50% | 0.40% | 0.30% | |
| 23:50 | JPY | GDP Deflator Y/Y Q1 P | -0.80% | -0.70% | -0.10% | |
| 01:00 | AUD | Consumer Inflation Expectation May | 4.00% | 4.10% | ||
| 01:30 | AUD | Employment Change Apr | 37.4k | 5.0k | 60.9k | 60.0k |
| 01:30 | AUD | Unemployment Rate Apr | 5.70% | 5.90% | 5.90% | |
| 08:30 | GBP | Retail Sales M/M Apr | 2.30% | 1.10% | -1.80% | -1.40% |
| 12:30 | CAD | International Securities Transactions (CAD) Mar | 15.13B | 17.23B | 38.84B | 39.16B |
| 12:30 | USD | Initial Jobless Claims (MAY 13) | 232K | 240k | 236k | |
| 12:30 | USD | Philly Fed Manufacturing Index May | 38.8 | 18.5 | 22 | |
| 14:00 | USD | Leading Indicators Apr | 0.40% | 0.40% | ||
| 14:30 | USD | Natural Gas Storage | 45B |
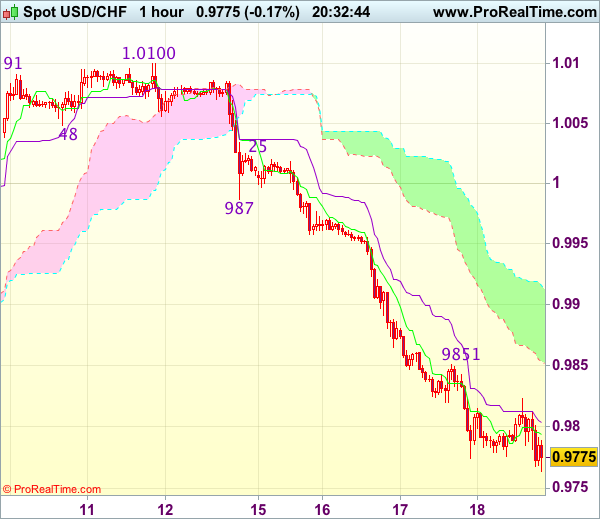
Trade Idea Update: USD/CHF – Sell at 0.9870
USD/CHF - 0.9793
Original strategy :
Sell at 0.9870, Target: 0.9770, Stop: 0.9905
Position : -
Target : -
Stop : -
New strategy :
Sell at 0.9870, Target: 0.9770, Stop: 0.9905
Position : -
Target : -
Stop : -
As dollar has recovered after intra-day marginal fall to 0.9764, suggesting minor consolidation above this level would be seen and recovery to 0.9850 cannot be ruled out, however, reckon 0.9870 would limit upside and bring another decline later, below said support at 0.9774 would extend early selloff from 1.0344 top towards 0.9735-40 (76.4% retracement of 0.9550-1.0344), however, near term oversold condition should prevent sharp fall below 0.9700, risk from there is seen for a rebound to take place later.
In view of this, would not chase this fall here and would be prudent to sell dollar on recovery as 0.9870 should limit upside. Above 0.9900 would defer and risk rebound to 0.9925-30 but upside should be limited to 0.9950 and price should falter well below previous support at 0.9987, bring another decline.