Sample Category Title
EUR/JPY Consolidating, EUR/GBP Growing Demand, EUR/CHF Slowly Declining.
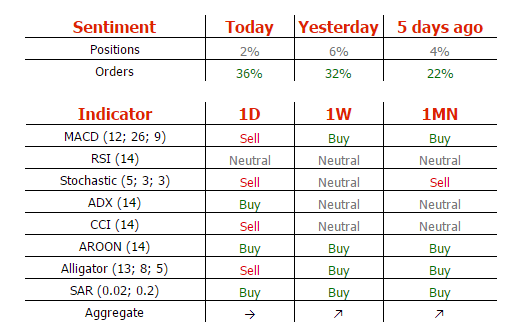
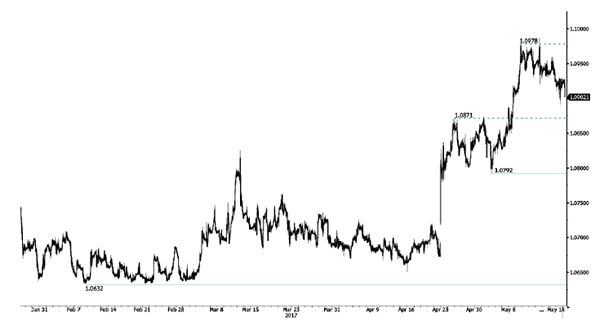
EUR/JPY Consolidating.
EUR/JPY's bullish run has ended, Hourly support is given at 122.93 (05/05/2017 low). Major support is given at 114.90 (18/04/2017low). Expected to see further renewed buying pressures towards 126.00 as long as the pair remains above 122.93.
In the longer term, the technical structure validates a medium-term succession of lower highs and lower lows. As a result, the resistance at 149.78 (08/12/2014 high) has likely marked the end of the rise that started in July 2012. Strong support at 94.12 (24/07/2012 low) looks nonetheless far away.
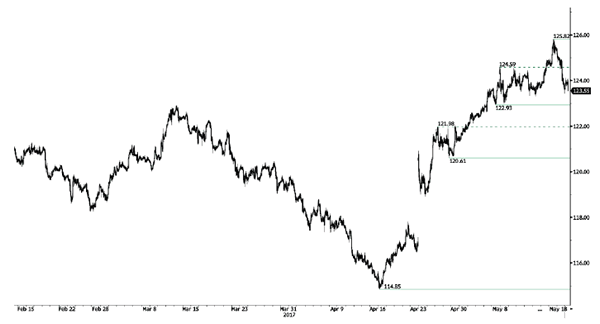
EUR/GBP Growing demand.
EUR/GBP is strengthening. The technical has turned positive since the pair has broken resistance at 0.8530 (25/04/2017 low). Support can be found at 0.8304 (05/12/2017 low). Expected to see further consolidation around 0.8600.
In the long-term, the pair has largely recovered from recent lows in 2015. The technical structure suggests a growing upside momentum. The pair is trading above from its 200 DMA. Strong resistance can be found at 0.9500 psychological level.
EUR/CHF Slowly declining.
EUR/CHF is getting lower. Despite the sharp increase and the recent bullish breakout which was very likely psychological, we believe that the medium-term pattern suggests us to see at some point renewed bearish pressures towards key support that can be found at 1.0623 (24/06/2016 low).
In the longer term, the technical structure is mixed. Resistance can be found at 1.1200 (04/02/2015 high). Yet,the ECB's QE programme is likely to cause persistent selling pressures on the euro, which should weigh on EUR/CHF. Supports can be found at 1.0184 (28/01/2015 low) and 1.0082 (27/01/2015 low).
USD/CHF False Breakout Of Support At 0.9814, USD/CAD Continued Weakness, AUD/USD Riding Symmetrical Triangle.
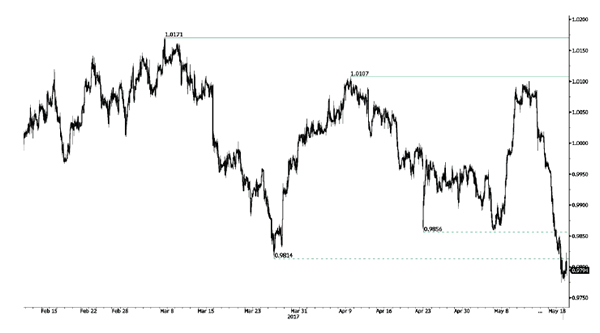
USD/CHF False breakout of support at 0.9814.
USD/CHF continues to push lower after failing to break resistance given at 1.0107 (10/04/2017 high). Support located at 0.9814 (27/03/2017 low) has been broken but the pair has failed to hold below it. Expected to continue going lower.
In the long-term, the pair is still trading in range since 2011 despite some turmoil when the SNB unpegged the CHF. Key support can be found 0.8986 (30/01/2015 low). The technical structure favours nonetheless a long term bullish bias since the unpeg in January 2015.
USD/CAD Continued weakness.
USD/CAD is declining declined after failing to reach 1.3800 before bouncing back. Hourly support can be found at 1.3411 (24/04/2017 high) then 1.3353 (20/01/2017 high). Expected to show continued bearish pressures.
In the longer term, there is a golden cross with the 50 dma crossing the 200 dma indicating further upside pressures. Strong resistance is given at 1.4690 (22/01/2016 high). Long-term support can be found at 1.2461 (16/03/2015 low).
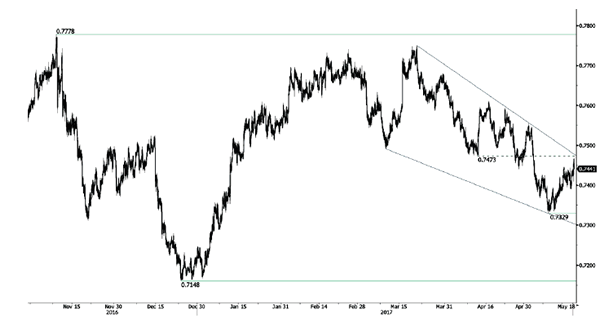
AUD/USD Riding symmetrical triangle.
AUD/USD is pushing higher since the pair monitored support at 0.7329 (09/05/2017 low). As long as prices remain below the resistance at 0.7608 (17/04/2017 high), the short-term technical structure is negative. Expected to show renewed weakness.
In the long-term, we are waiting for further signs that the current downtrend is ending. Key supports stand at 0.6009 (31/10/2008 low) . A break of the key resistance at 0.8295 (15/01/2015 high) is needed to invalidate our long-term bearish view.
EUR/USD Strong Demand, GBP/USD Monitoring Resistance At 1.3000, USD/JPY Continued Decline.
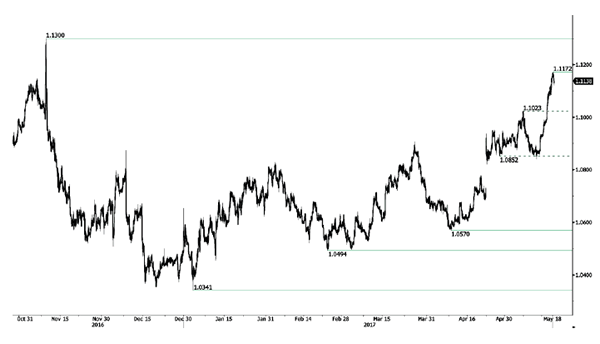
EUR/USD Strong demand.
EUR/USD is trading higher. Resistance now lies at 1.1172 (18/05/2017 high). Hourly support can be found at 1.0842 (11/05/2017 low). Strong support is now given at 1.0682 (21/04/2017 base) and key support can be found at 1.0494 (22/02/2017 low). Expected to continue growing higher.
In the longer term, the death cross late October indicated a further bearish bias. The pair has broken key support given at 1.0458 (16/03/2015 low). Key resistance holds at 1.1714 (24/08/2015 high). Expected to head towards parity.
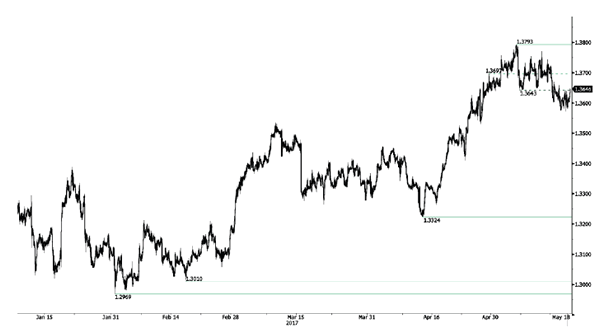
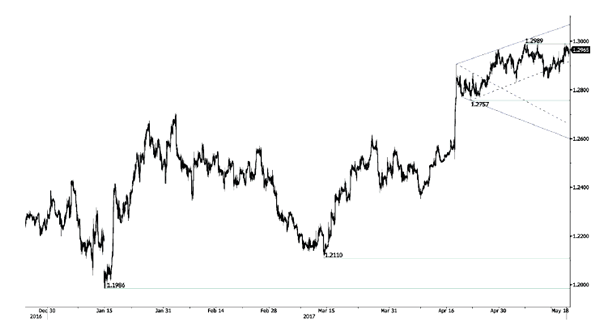
GBP/USD Monitoring resistance at 1.3000.
GBP/USD is trading higher. Hourly resistance is given at 1.2989 (07/05/2017 high). Hourly support are given at 1.2831 (04/05/2017 low) and1.2757 (21/04/2017 low). An unlikely break of this last support would indicate further weakness. Expected to push higher.
The long-term technical pattern is even more negative since the Brexit vote has paved the way for further decline. Long-term support given at 1.0520 (01/03/85) represents a decent target. Long-term resistance is given at 1.5018 (24/06/2015) and would indicate a long-term reversal in the negative trend. Yet, it is very unlikely at the moment.
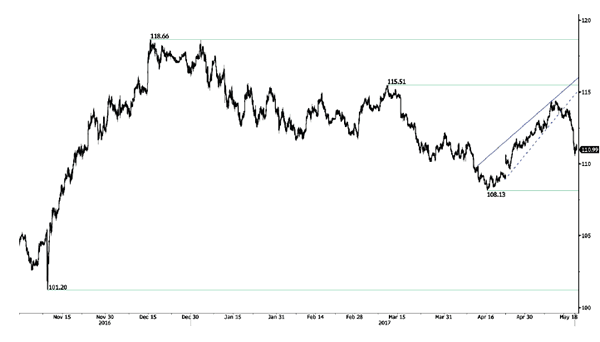
USD/JPY Continued decline.
USD/JPY has exited the symmetrical triangle and keeps pushing lower. Stronger support is located at 108.13 (17/04/2017 low). Other key supports lie at a distant 106.04 (11/11/2016 low).The road is now wide-open for further decline.
We favor a long-term bearish bias. Support is now given at 96.57 (10/08/2013 low). A gradual rise towards the major resistance at 135.15 (01/02/2002 high) seems absolutely unlikely. Expected to decline further support at 93.79 (13/06/2013 low).
USD Reverses Losses As Markets Settle Down
AUD extends gains amid solid job report
Among the G10 complex, the Australian dollar was the sole currency in positive territory this morning after the publication of the last job report from the Australian Bureau of Statistics.
The Aussie was up 0.26% against the greenback on Thursday, up to $0.7451, while most of currencies partially reversed yesterday's sharp gains against the USD.
In April, the unemployment rate inched lower for the second month in a row, down to 5.7% from 5.9%, as the economy added 37.4k jobs (seasonally adjusted). The participation rate held steady at 64.8%. However, the details of the report are not that rosy as full-time employment decreased by 11.6k jobs, while part-time employment rose by 49k, suggesting that the job market is not as healthy as the headline figure suggests.
We reiterate our view that the picture is not that bright for the Australian, particularly in view of growing concerns about China's economic outlook, which sent iron ore prices into free-fall. Therefore, we do not rule out further AUD weakness, even though a stabilisation of the Aussie is the most likely narrative at the moment.
As explained last week, investors are still heavily positioned for further appreciation of the Aussie. The unwinding of the long speculative positions - net long non-commercial positions currently stand at around 21% of total open interest as reported by the CFTC - should continue, which could potentially only accelerate the AUD debasement.
Gold supported thanks to Trump and political uncertainties
It seemed very unlikely that global political uncertainties would rekindle so fast after the French election, in which the second round between Emmanuel Macron and Marine Le Pen was a non-event.
Yet, as often in financial markets, uncertainties are coming from where it was not really expected. And those uncertainties are now coming from the US and more precisely, from the Oval Office.
The President Trump issue regarding the FBI investigation are weighing on credibility while rumours are growing that an impeachment procedure may at some point take place. Yet, we remain suspicious of that at this point but can see the dollar is getting weaker. This year was expected to be calmer for financial markets, but it may yet be complicated for Western countries.
On top of that, the equity markets had their worst day yesterday since Brexit. The S&P lost almost 44 points. This also supports the bearish move on the dollar. Anyway our view remains the same as we believe the economy is underestimated. We now consider that we are still at the start of a risk-off move and that gold is set to to strengthen further.
Trade Idea: GBP/USD – Buy at 1.2995
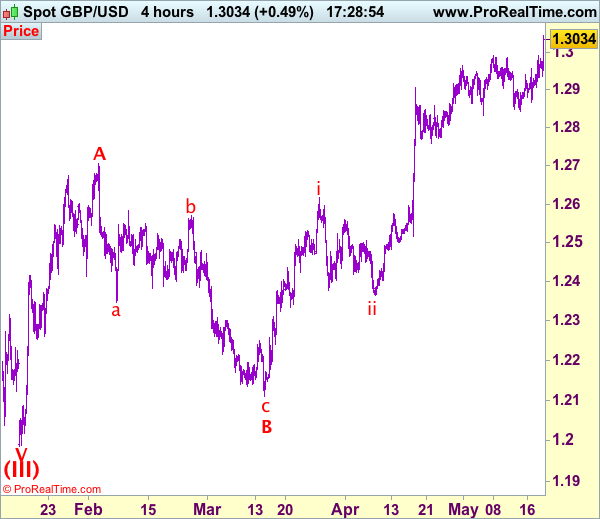
GBP/USD – 1.3027
Recent wave: Wave V of larger degree wave (III) has ended at 1.1986 and major correction has commenced from there for gain to 1.3000 and 1.3140-50
Trend: Near term up
Original strategy :
Sold at 1.2920, stopped at 1.2970
Position: - Short at 1.2920
Target: -
Stop: - 1.2970
New strategy :
Buy at 1.2995, Target: 1.3150, Stop: 1.2935
Position: -
Target: -
Stop:-
Current rally above indicated psychological level of 1.3000 confirms recent upmove has resumed and bullishness is seen for further gain to 1.3075-80, then 1.3100-10, however, near term overbought condition should limit upside to 1.3050-60 and price should falter well below 1.3100-10 today, risk from there is seen for a retreat to take place later.
Our preferred count on the daily chart is that cable's rebound from 1.3500 (wave (A) trough) is unfolding as a wave (B) with A ended at 1.7043, followed by triangle wave B and wave C as well as wave (B) has ended at 1.7192, the subsequent selloff is the larger degree wave (C) which is still unfolding with minor wave (III) of larger degree wave 3 ended at 1.1986, hence wave (IV) correction is in progress which could either be a triangle wave (IV) of a complex formation but upside should be limited to 1.3500 and price should falter well below 1.4000, bring another decline in wave (V) of 3 for weakness to 1.1500, then 1.1200.
On the downside, whilst pullback to 1.2991 (previous resistance turned support) cannot be ruled out, reckon 1.2935-40 would contain downside and bring another uqmove later. Below 1.2935-40 would abort and suggest top is possibly formed, risk weakness to 1.2905-10, break there would confirm and bring subsequent fall to indicated support at 1.2866 but last week’s low at 1.2844 should remain intact.
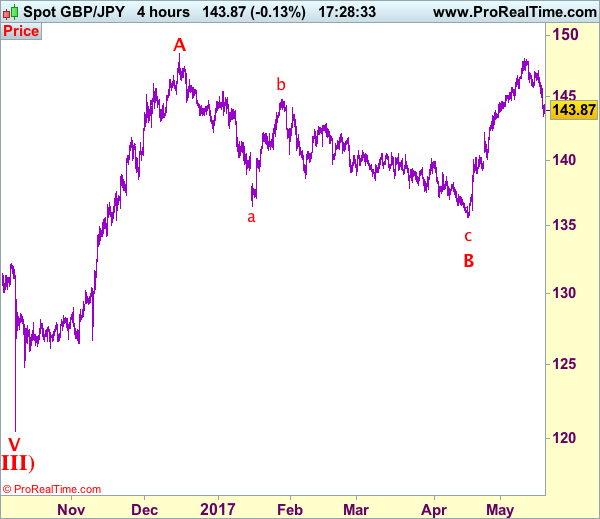
Trade Idea: GBP/JPY – Stand aside
GBP/JPY - 143.90
Recent wave: Medium term low formed at 120.50 and (A)-(B)-(C) major correction has commenced with (A) leg ended at 148.45, hence wave (B) is unfolding for retreat to 131.00-10.
Trend: Near term up
Original strategy:
Bought at 144.50, stopped at 143.90
Position: - Long at 144.50
Target: -
Stop: - 143.90
New strategy :
Stand aside
Position: -
Target: -
Stop:-
Sterling’s retreat from 148.10 turned out to be stronger-than-expected, dampening our bullishness and suggesting a temporary top has been formed there, hence downside risk is seen for the corrective fall from there to bring retracement of recent upmove, hence weakness to 143.20-30 and then 142.90-00 cannot be ruled out, however, reckon downside would be limited to 142.50 and price should stay above 142.00, bring another rise later.
In view of this, would be prudent to stand aside for now. Above 144.80-85 would bring recovery to 145.50 but only break of resistance at 145.90-95 would signal low is formed, then gain to 146.40-50 would follow, having said that, sterling needs to penetrate resistance at 147.10 to revive bullishness and signal correction from 148.10 has ended, bring eventual retest of this level.
Our preferred count is that larger degree wave V with circle is unfolding from 251.12 with wave (I) 219.34, (II): 241.38 and wave (III) is subdivided into 1: 192.60, 2: 215.89 (23 Jul 2008) and wave 3 ended at 118.87 earlier in 2009. The correction from there to 162.60 is wave 4 which itself is a double three and is labeled as first a-b-c ended at 151.53, followed by wave x at 139.03, 2nd a ended at 162.60, 2nd b at 146.75 and 2nd c leg of wave 4 ended at 163.00. Therefore, the decline from 163.00 to 116.85 is now treated as wave 5 which also marked the end of larger degree wave (III), hence wave (IV) major correction has commenced for retracement of the wave (III) from 241.38 and upside target at 183.95-00 (50% Fibonacci retracement of the wave (II) from 241.38) had been met, a drop below 160.00 would suggest wave (IV) has ended at 195.85, bring decline in wave (V) for initial weakness to 130 (already met) and 120.
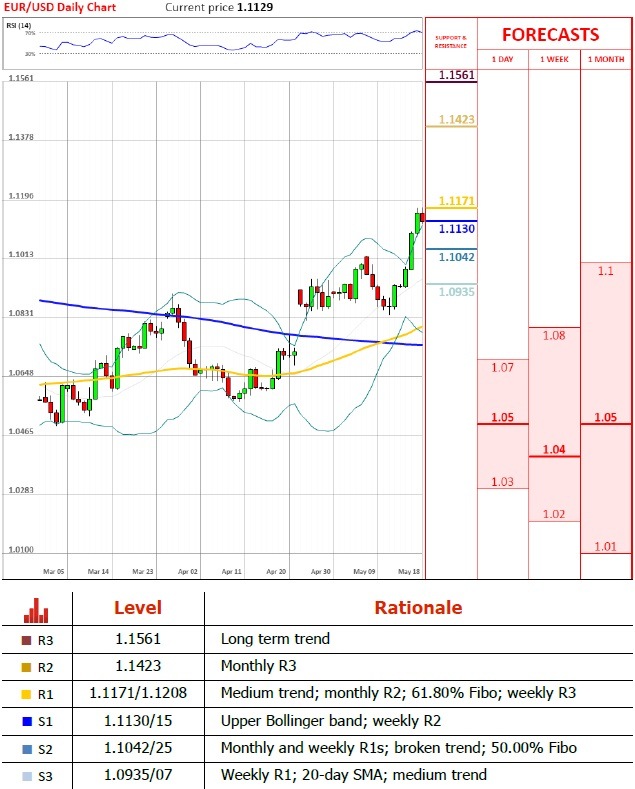
EUR/USD Analysis: Encounters Resistance
'The dollar fell a sixth day.' – Bloomberg
Pair's outlook
The EUR/USD currency pair seems to have encountered the resistance of a medium term ascending channel pattern, which broke through the previously active long term channel up. It is most likely that the pair will retreat down to the support of the weekly R2, which is located at the 1.1115 mark. However, it is yet to be seen whether that support is passed. Although, if that occurs the currency pair could retreat back to the support cluster near the 1.1050 mark. On the other hand the pair might make an attempt to break the resistance cluster near the 1.1190 level.
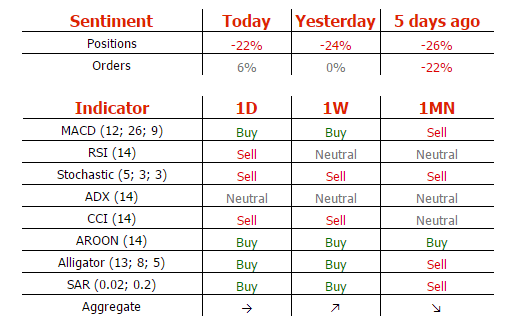
Traders' sentiment
SWFX traders continue to short the pair, as 61% of open positions are bearish. However, 53% of trader set up orders are to buy the Euro.
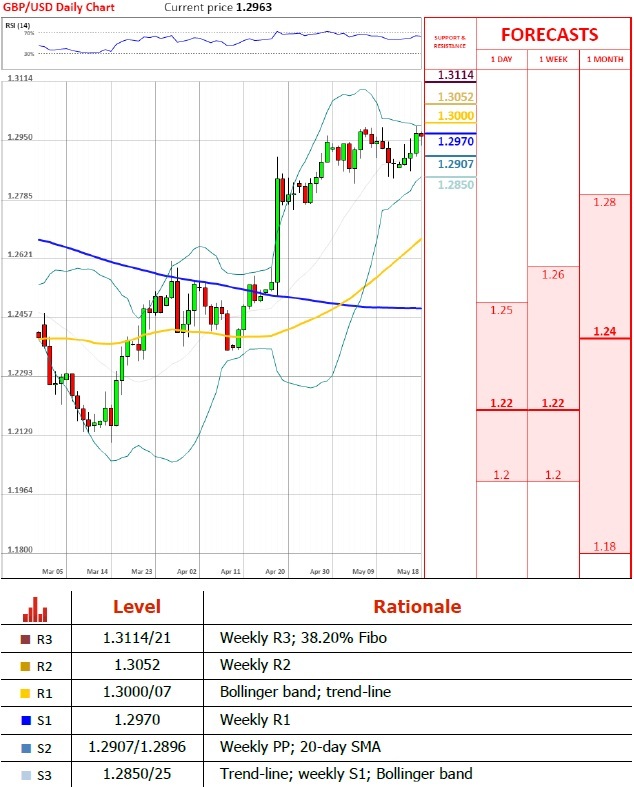
GBP/USD Analysis: U-Turn In Sight
'If you get a poorer retail sales number and worry about what unemployment will do, you might see some of these gains reversed and take us back down toward $1.28, maybe even toward $1.27 in the shorter-term.' – Chris Beauchamp, IG (based on MarketWatch)
Pair's outlook
For the third consecutive day this week the British Pound was able to outperform the US Dollar yesterday, approaching dangerously close to the 1.30 mark. The goal remains unchanged, as the Sterling is required to pierce the consolidation trend's upper border in order to continue posting gains. As a result, risks of the pair shifting polarity persist, which would trigger another spark of bearish momentum and would eventually lead to a drop under 1.29, with the consolidation trend's lower border then in focus. Technical indicators keep giving mixed signals, unable to confirm this outlook.
Traders' sentiment
Once again market sentiment reached a perfect equilibrium, but the portion of orders to buy the Pound inched slightly higher in the last 24 hours, namely from 53 to 55%.
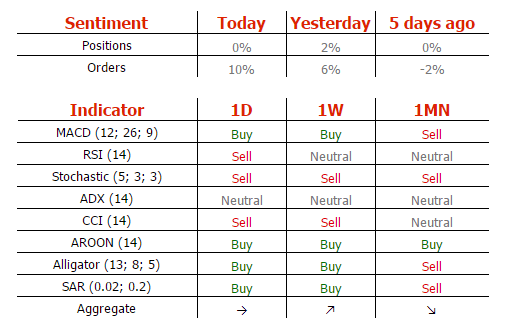
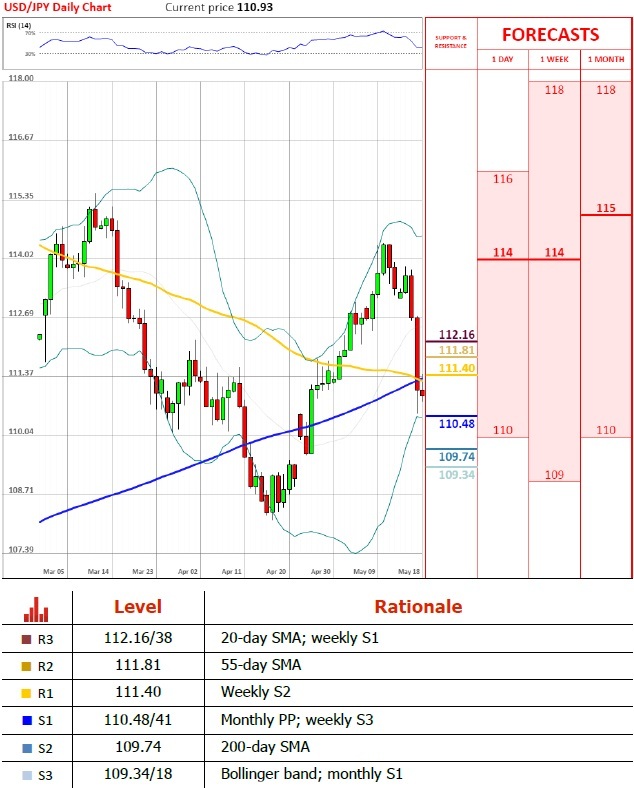
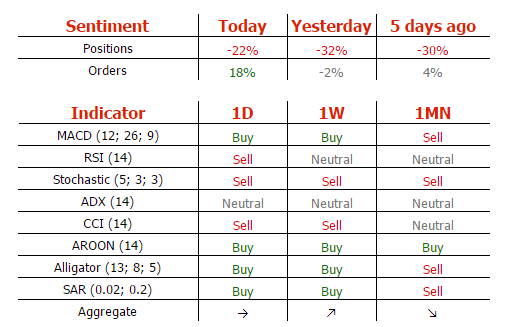
USD/JPY Analysis: Attempts To Undergo A Correction
'At the very least the view is that Trump's economic policies will be delayed over this [latest US political turmoil], and the dollar is being sold.' – Matsui Securities (based on The Business Times)
Pair's outlook
The USD/JPY pair experienced a rather devastating blow on Wednesday, losing more than 200 pips amid continued political turmoil in the US. After such a large slump the Buck is likely to undergo a bullish correction, unless political pressure keeps weakening the Greenback. Moreover, the monthly PP and the weekly S3 around 110.45 are providing rather strong support, which could be sufficient for a recovery to prevail. The nearest resistance rests at 111.40, namely the weekly S2, most likely marking the intraday high. The base case scenario is a close somewhere between 110.50 and 111.50.
Traders' sentiment
There are 61% of traders holding short positions today (previously 66%), while the share of buy orders added 10% points, having risen to a total of 59%.
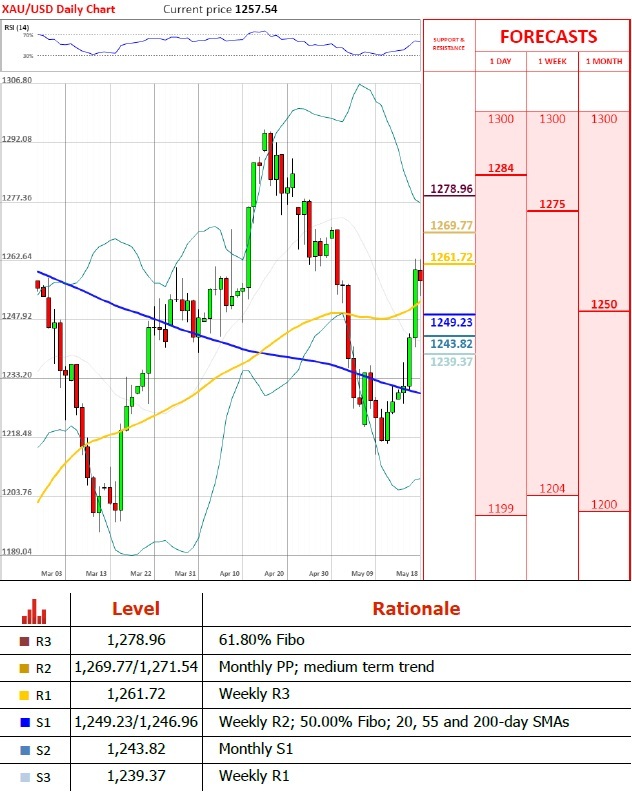
Gold Analysis: Retreats After Massive Gains
'Spot gold may retrace moderately to a support at $1,252 per ounce, before retesting a resistance at $1,264.' – Wang Tao, Reuters
Pair's outlook
On Thursday morning the yellow metal's price was in a retreat, as it had failed to break the resistance put up by the weekly R3, which is located at the 1,261.72 level. However, this retreat comes after scoring massive gains. During Wednesday's trading the bullion gained more than 2% and 2500 base points. Due to that it is normal that a period of consolidation is occurring. However, from a technical perspective on the daily chart gold is still set to gain additional ground in the near future, as the weekly R3 is a lone resistance.
Traders' sentiment
Traders are almost neutral in regard to the metal, as 51% of open positions are long. However, 68% of trader set up orders are to buy.