Sample Category Title
USD/JPY Elliott Wave Analysis
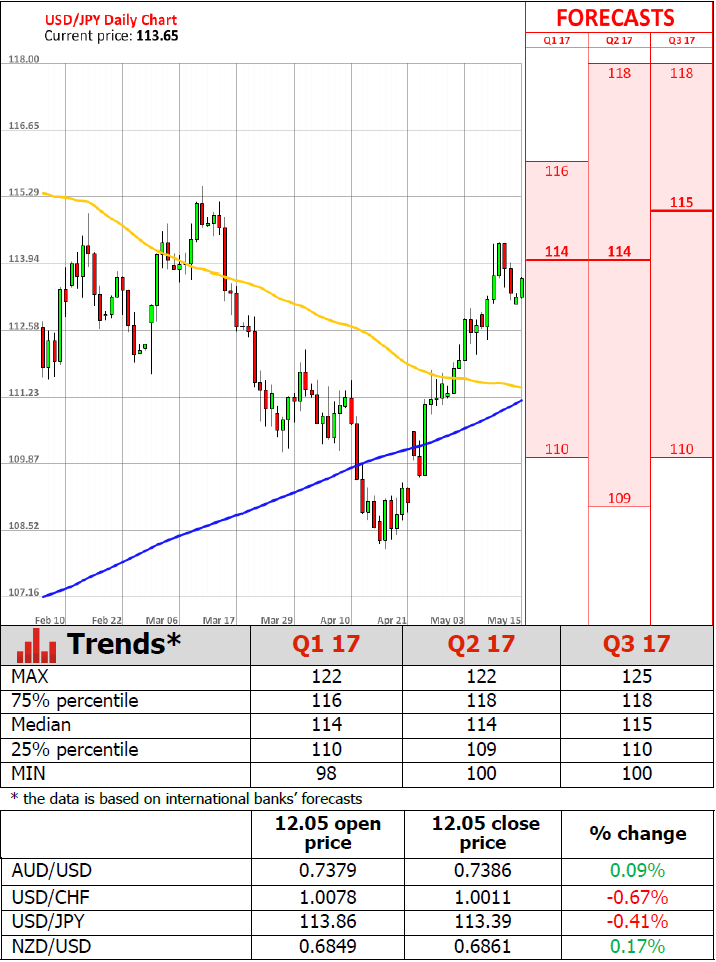
USD/JPY - 113.58
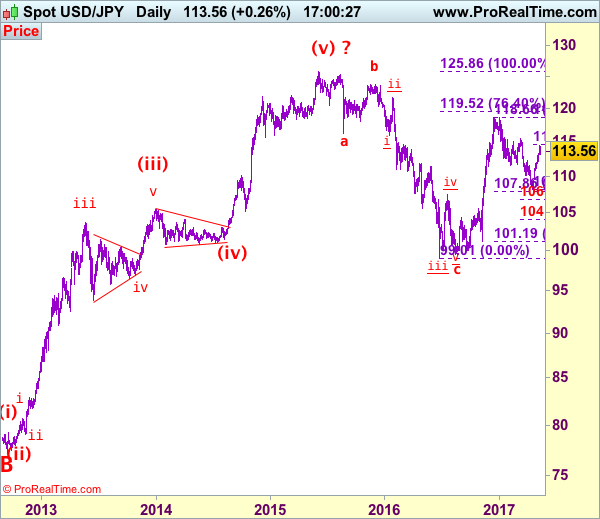
USD/JPY – Wave V of larger degree circle V has possibly ended at 75.31 and major correction has commenced and already met indicated target at 125.00.
The greenback met resistance at 114.37 and has eased, suggesting consolidation below this level would be seen and pullback to 112.90-00 cannot be ruled out, however, reckon downside would be limited to support at 112.09 and bring another rise later, above said resistance at 114.37 would extend the rise from 108.13 low to 114.60-65 (61.8% Fibonacci retracement of 118.66-108.13). Having said that, a daily close above there is needed to retain bullishness and suggest the entire fall from 118.66 has ended at 108.13, then further gain to 115.00 and later test of key resistance at 115.51 which is likely to hold on first testing.
Our preferred count is that, triangle wave IV (with circle) ended at 101.45 and the circle wave V brought dollar down to the record low of 75.31 in 2011 and the subsequent rebound signal major correction has commenced with A leg ended at 84.19, followed by wave B at 77.14 and impulsive wave C is now unfolding (indicated upside target at 125.00 had been met) for gain towards 127.00 level. In the event dollar drops below support at 99.01, this would confirm medium term decline from 125.86 top (2015 high) has resumed for subsequent weakness to 98.00 and possibly 97.00.
Under this count, this wave C is unfolding as impulsive waves with (1) (2), 1 2 ended at 80.67, 79.07, 82.84 and 81.69 respectively, hence the extended wave 3 has ended at 103.74 and wave 4 correction of recent upmove should bring weakness to 92.57, then towards 90.88 but psychological support at 90.00 should limit downside and bring another rally later in wave 5, indicated target at 125.00 had been met and gain to 127.00 cannot be ruled out but reckon price would falter below 130.00.
On the downside, whilst initial pullback to 113.00 cannot be ruled out, reckon downside would be limited to 112.09 support and bring another rise later. Below previous resistance at 111.78 would defer and signal top is formed, bring further fall to 111.00-05 but price should stay above previous resistance at 110.60 (now support) and bring another rise later.
Recommendation: Buy at 112.10 for 114.10 with stop below 111.10.
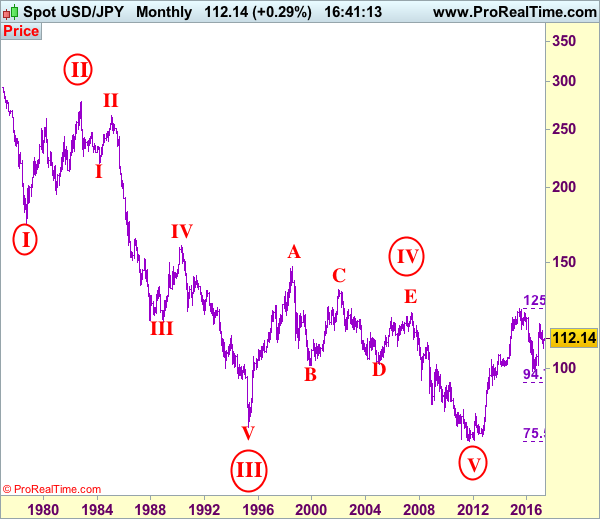
On the monthly chart, we have changed our preferred count that an impulsive wave is unfolding with major wave III with circle ended at 79.75, then followed by wave IV with circle and is labeled as a triangle with A: 147.64 (11 August, 1998), B: 101.25, C: 135.20, D: 101.67 and E leg ended at 124.14 to end the wave IV with circle. Hence, wave V with circle commenced from there and hit a record low of 75.31, however, the subsequent strong rebound signals this circle wave V has possibly ended there, hence gain to (indicated upside target at 122.00 and 125.00 had been met), the retreat from 125.86 suggests wave A of major correction has ended there and wave B correction back to 99.00, then 95.00 would be seen, however, reckon downside would be limited to 90.00, bring another rebound in wave C next year.
EUR/USD Analysis: Trades Above Significant Support
'The euro is expected to find further offers around 1.1000 and likely near the Monday high at 1.1023.' – Alexandria Arnold and Dennis Pettit, Bloomberg
Pair's Outlook
During the early hours of Monday's trading session the common European currency scored new heights against the US Dollar, as the currency exchange rate had touched the 1.0950 mark. The currency pair is being supported by the newly calculated weekly PP, which is located at the 1.0932 level. It is most likely that the currency rate will reach for the resistance at 1.0977 by the end of the day. At that level the 50.00% Fibonacci retracement level is located at. However, in the case of a change of the direction the pair might retreat to the 20-day SMA at 1.0873.
Traders' Sentiment
SWFX traders remain bearish, as 61% of open positions are short, and 60% of trader set up orders are to sell the Euro.
GBP/USD Analysis: On Route To Erasing Last Week’s Losses
'Altogether we remain constructive on GBP and remain long via a basket of USD, EUR and AUD. We remove EUR/GBP upside from our 2017 forecasts and expect GBP/USD to test 1.37 by year-end.' – Nomura (based on FXStreet)
Pair's Outlook
Even though the US inflation data disappointed on Friday, the Cable was still unable to close in the green zone, but did manage to negate all intraday losses. Trade remained relatively unchanged, with the consolidation trend also intact, thus, a positive development today is expected. The 1.30 mark is the trend's upper border, which is unlikely to be reached today, as no strong market movers are expected to emerge today. However, the nearest resistance, namely the weekly PP, is not much of an obstacle; therefore, more attention should be paid to the second supply area, formed by the weekly R1 and the upper Bollinger band circa 1.2985.
Traders' Sentiment
Market sentiment remains bullish, but now with bulls slightly outnumbering the bears, as 51% of all open positions are long.
USD/JPY Analysis: Sets Off With A Rally
'And unfortunately for yen bulls, the weaker yen hasn't led to a pickup in Japanese exports. Until this happens, the yen will likely continue to weaken.' – Marc Chandler, BBH (based on Market Watch)
Pair's Outlook
The USD/JPY currency pair appears to have topped out last week, with the 114.40 mark being the reversal point. Poor US fundamentals contributed to the U-turn, causing the Greenback to weaken further against the Yen. However, due to the pair opening with a bearish gap today, the Buck managed to regain some of its bullish momentum, paving its way towards erasing Friday's losses. Technical indicators support this possibility, but the 114.00 major level is still expected to be out of reach. Overall, this recovery is likely to be a minor setback in the US Dollar's bearish trend, as demand, represented by the 200-hour SMA, which caused the reversal, should not succeed again this week.
Traders' Sentiment
Today 63% of traders are bears (previously 65%), while all pending orders are equally divided between the buy and the sell ones.
Gold Analysis: Continues Higher
'U.S. data on Friday showed a smaller-than-expected 0.4 percent increase in April retail sales from the previous month, while a disappointing report on consumer prices raised concerns about the retail sector and the broader economy.' – Vijaykumar Vedala, Reuters
Pair's Outlook
On Monday morning the yellow metal continued to score gains against the US Dollar, as the bullion passed a significant resistance level. The commodity price surged to trade above the 100-day SMA, which is located at the 1,229.29 mark. Due to that fact the bullion has a large free range for a surge. The closest resistance level was the weekly R1, which is located at the 1,239.37 level. It is highly possible that the resistance will be reached during this week. However, smaller timeframe resistance levels might hold back the metal.
Traders' Sentiment
SWFX market sentiment remains almost neutral, as 52% of open positions are long. However, 64% of trader set up orders are to buy the metal.
US Consumer Prices And Retail Sales Rebound In April But Less Than Expected
'To some extent, this new weakness in price inflation is due to competitive pressures rather than weak demand, so the Fed can afford to discount it.' - Paul Ashworth, Capital Economics
Consumer prices in the United States advanced last month but less than analysts expected. The Labour Department reported on Friday that its CPI rose 0.2% in April, following the preceding month's drop of 0.3% but missing expectations for a 0.3% gain. Furthermore, the so-called core inflation rate climbed 0.1% last month, compared to the previous month's fall of 0.1%, whereas analysts anticipated an increase of 0.2%. However, both figures pointed to a tightening labour market and solid inflation growth, suggesting that the Federal Reserve will likely raise interest rates at its June meeting. April's inflation rebound was mainly attributable to the oil price rebound. Other data released by the Commerce Department showed retail sales rose 0.4% in April, following the prior month's upwardly revised gain of 0.1% and falling behind forecasts for a 0.6% increase. Meanwhile, core retail sales, which exclude volatile items, climbed 0.3%, unchanged from the preceding month's upwardly revised reading, while analysts anticipated a 0.5% climb. According to the Atlanta Fed, the economy is set to expand 3.6% in the Q2 of 2017.
New Zealand Retail Sales Rise More Than Expected In Q1 Of 2017
'The economy is looking quite normal verging on strong and in that sense it's at odds with a cash rate which is really well below any levels of normality.' - Craig Ebert, BNZ
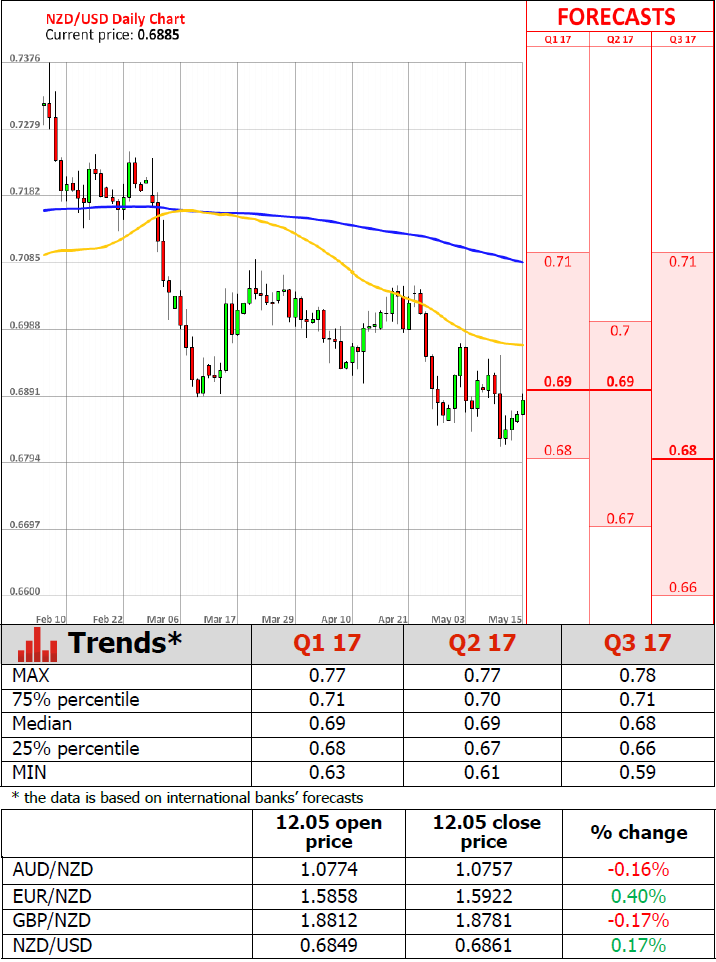
Retail sales in New Zealand rebounded sharply in the first quarter, beating analysts' expectations, amid higher car sales, official figures showed on Monday. Statistics New Zealand reported that retail sales volumes climbed 1.5% on a seasonally adjusted basis in the three-month period to March, up from a 0.6% gain in the preceding period, whereas analysts anticipated a slighter increase of 1.1%. The figures are set to please the Reserve Bank of New Zealand, which surprised markets at its last policy meeting, expressing concerns over the economy that performed stronger than expected over the past couple of months. However, analysts said that strong retail sales would not be enough to change the RBNZ's policy stance. The March quarter's sharp rebound was mainly driven by higher demand for cars. Back in the Q1 of 2017, sales of automobiles surged 5.9%, pointing to growing population and low car prices. On an annual basis, sales were up 4.6%, surpassing expectations for a 4.4% gain. After the release, the New Zealand rose from 0.6853 to 0.6870 against its US counterpart.
Trade Idea: EUR/JPY – Hold short entered at 124.00
EUR/JPY - 124.36
Recent wave: wave v of (C) ended at 94.12 and major correction in wave A has ended at 149.79
Trend: Near term up
Original strategy:
Sold at 124.00, Target: 122.20, Stop: 124.55
Position: - Short at 124.00
Target: - 122.20
Stop: - 124.55
New strategy :
Hold short entered at 124.00, Target: 122.20, Stop: 124.55
Position: - Short at 124.00
Target: - 122.20
Stop:- 124.55
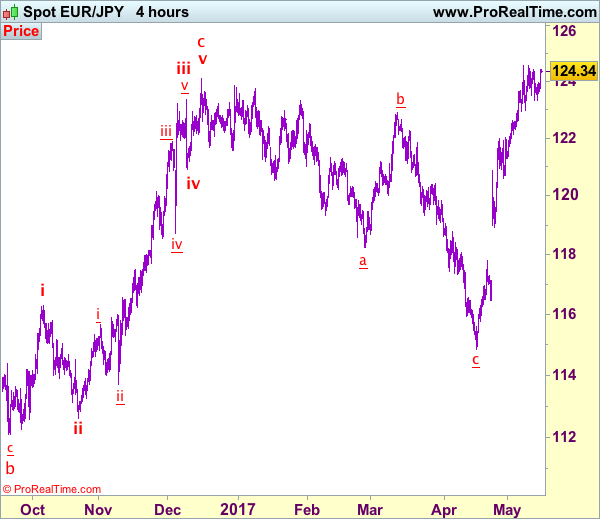
As the single currency has rebounded again after finding support at 123.53, suggesting caution on our near term bearishness and indicated resistance at 124.55 needs to hold to retain prospect of another retreat, below said support at 123.53 would bring a test of support at 122.92-98, break there would suggest a temporary top is possibly formed, bring further fall to 122.60 but break of 122.00-10 is needed to add credence to this view, bring retracement of recent upmove to 121.50 first.
In view of this, we are holding on to our short position entered at 124.00. Above said resistance at 124.55 would abort and signal recent upmove is still in progress and may extend further gain towards 125.00 level but loss of upward momentum should prevent sharp move beyond 125.40-50, risk from there is seen for another retreat later.
Our latest preferred count is that wave (ii) is ABC-X-ABC which ended at 123.33 and wave (iii) is unfolding with wave iii ended at 100.77, followed by wave iv at 111.57 and wave v as well as the wave (iii) has ended at 97.04, followed by wave (iv) at 111.43 and wave (v) has ended at 94.12 which is also the end of the larger degree v, this also implied the major wave (C) has also ended there, hence major correction has commenced from there with (A) leg unfolding in its lower degree wave c which has possibly ended at 145.69. Under this count, A-B-C wave (B) has commenced with A leg ended at 136.23, wave B at 143.79 and wave C has possibly ended at 149.79.
Our larger degree count is that the decline from 139.26 is wave (C) and is sub-divided into a diagonal triangle i-ii-iii-iv-v with wave i - 105.44, wave ii- 123.33, wave iii - 97.03, wave iv - 111.43, followed by the final wave v as well as the end of wave (C) at 94.12, this also mark the bottom of larger degree wave B. Under this count, major rise in wave C has commenced as an impulsive wave with minor wave III ended at 145.69, wave V is still in progress for further gain to 150.00. Having said that, this so-called wave V could well be the first leg of larger degree 5-waver wave C and this wave C should bring at least a retest of wave A top at 169.97 (July 2008).
Trade Idea: AUD/USD – Buy at 0.7300
AUD/USD – 0.7419
Recent wave: Wave 5 ended at 1.1081 and major correction has commenced for fall to 0.7000 and then towards 0.6500-10
Trend: Near term down
Original strategy :
Buy at 0.7300, Target: 0.7500, Stop: 0.7240
Position: -
Target: -
Stop: -
New strategy :
Buy at 0.7300, Target: 0.7500, Stop: 0.7240
Position: -
Target: -
Stop:-
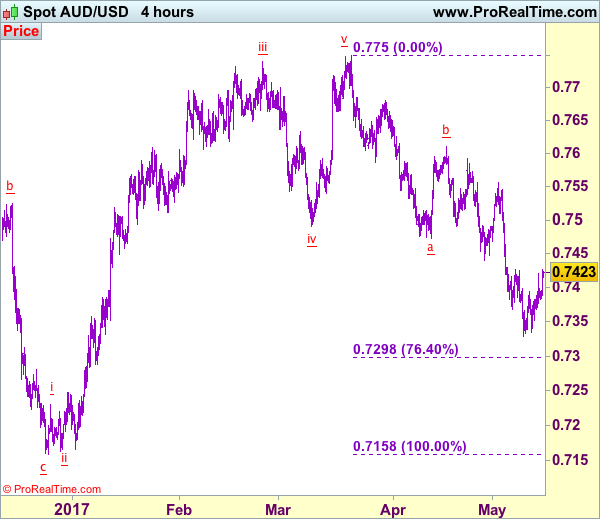
Although aussie has edged higher again and marginal gain from here cannot be ruled out, reckon previous support at 0.7440 would limit upside and bring another decline later, below said support at 0.7329 would extend one more fall to 0.7295-00 (76.4% retracement of 0.7158-0.7750), however, loss of downward momentum should prevent sharp fall below there and bring rebound later, above 0.7425-30 would bring subsequent gain to 0.7490-00 but break of 0.7510 is needed to signal low is formed, then test of resistance at 0.7556 would follow.
In view of this, we are inclined to turn long on next decline. Below 0.7245-50 would risk weakness to 0.7200-10, however, reckon previous support 0.7158 would contain downside and aussie may stage another strong rebound from there later this week.
On the 4-hour chart, the move from 0.8066 is the wave 5 with i: 0.8860, ii: 0.8315, wave iii is an extended move ended at 1.0183, iv: 0.9706 and wave v has ended at 1.1081 (also the top of entire wave 5). The subsequent selloff is the major correction which is unfolding as ABC-X-ABC and 2nd A leg has ended at 0.8848, followed by a-b-c wave B which ended at 0.9758, hence, 2nd C wave is now in progress and indicated downside target at 0.7000 and 0.6950 had been met, so further fall to 0.6710-20 cannot be ruled out.
Technical Outlook: Euro Remains Firm At The Beginning Of The Week And Holding Above The Mid-Point Of 1.1020/1.0838 Fall
The Euro remains firm at the beginning of the week and holding above the mid-point of 1.1020/1.0838 fall, following strong rally on Friday that neutralized threats of breaking below key support zone between 1.0850 and 1.0824.
Rising 20SMA contained pullback and is underpinning recovery rally which generated bullish signals on break above pivots at 1.0917/29 (10SMA / daily Tenkan-sen).
Technical studies on daily chart returned to full bullish setup and support further upside which may result on renewed attack at psychological 1.1000 barrier.
Weaker dollar on disappointing US data and rising tensions with North Korea may further inflate the single currency, together with overall positive sentiment in the Euro bloc after the victory of Emmanuel Macron in French presidential election.
Broken 10SMA offers immediate support at 1.0917, followed by 1.0900 level which should contain corrective dips and keep fresh near-term bullish structure intact.
Stronger bearish signal could be expected on extension below rising 20SMA (currently at 1.0870) which would re-expose pivotal supports at 1.0848 (Fibo 38.2% of 1.0568/1.1020 upleg), 1.0838 last week’s correction low) at 1.0824 (200SMA).
Res: 1.0951, 1.0977, 1.1000, 1.1020
Sup: 1.0917, 1.0900, 1.0870, 1.0848