Sample Category Title
Saudi Arabia And Russia Agree To Extend Oil Deal Into 2018
Oil prices surged earlier today, following reports that Saudi Arabia and Russia have agreed to extend November’s oil-output cut until March 2018, a 9-month extension from the 6 months widely discussed previously. Although they hinted at a longer-than-anticipated extension, they agreed to keep the quantity of the cuts the same as decided in November. With only 10 days left until the meeting between major producers in Vienna, we think that the near-term outlook of the precious liquid is to the upside. We believe that further optimistic comments from the various oil ministers regarding the prospect of an extension into 2018 is likely to keep oil prices supported heading into that meeting. In addition, any chatter that there can be deeper production cuts could lift prices further.
WTI edged north during the Asian day Monday, breaking above the resistance (now turned into support) barrier of 48.50 (S1) to hit the longer-term prior upside support line taken from the low of the 5th of April 2016. More optimistic comments ahead of the Vienna meeting could push it back above the aforementioned line. If so, we would expect the bulls to aim for the 49.90 (R1) resistance hurdle, where a decisive break is possible to open the way for our next resistance of 51.00 (R2).
As for the bigger picture though, we remain skeptical as to whether a major healthy uptrend can be established. Even if we get a better-than-anticipated deal in Vienna, continued increase in US production is likely to keep a lid on any gains oil prices may record in the aftermath of that meeting. Looking at the daily chart of WTI, we see the 51.50 – 55.00 range as the area where shale producers may be attracted to increase production.
Dollar slips after disappointing economic data
The US dollar slipped on Friday, following the release of the nation’s CPI and retail sales data for April. The figures were disappointing overall, with the core CPI rate surprisingly declining and the headline rate falling by more than expected. Meanwhile, both the headline and the core retail sales rates rose by less than anticipated, though last month’s figures were revised somewhat higher. As a result, the probability for a June rate hike declined to 74%, which in our view is still an elevated level considering that there are 4 weeks to go until that gathering.
Moving forward, we think that investors may pay extra attention to incoming US data. Encouraging numbers may be a reason for the hike probability to rebound again. However, considering it’s already at an elevated level, any upside reaction in USD may be relatively modest. On the other hand, further signs of softness in economic indicators could raise doubts as to whether the Committee will indeed act in June, and may thereby bring the greenback under renewed selling interest.
USD/CAD traded south during the early European morning Monday. However, the rate has been oscillating between 1.3645 (S1) and 1.3750 (R1) since the 5th of May and as such, we would consider the near-term outlook to be flat for now. Even if we see the rate breaking below 1.3645 (S1), as long as it remains above the key barrier of 1.3600 (S2), we prefer to maintain a flat stance. The 1.3600 (S2) territory acted as the upper bound of the larger wide range between that hurdle and the psychological zone of 1.3000, which contained the price action from September 2016 until April 2017. Therefore, there is still a decent probability for a rebound from near 1.3600 (S2).
Today’s highlights:
During the European day, the economic calendar is empty, with no major events or indicators due to be released. From the US, we will get the Empire State manufacturing and the NAHB housing market indices, both for May. We have one speaker on the agenda: ECB Executive Board member Peter Praet.
As for the rest of the week, on Tuesday, the main event will probably be the release of the UK CPI data for April. On Wednesday, we get the nation’s employment figures for March. On Thursday, during the Asian morning, Australia’s employment data for April are due out, while from the UK, we get retail sales data for April. Finally on Friday, Canada’s CPI data for April will be in focus.
WTI
Support: 48.50 (S1), 47.50 (S2), 46.00 (S3)
Resistance: 49.90 (R1), 51.00 (R2), 51.50 (R3)
USD/CAD
Support: 1.3645 (S1), 1.3600 (S2), 1.3530 (S3)
Resistance: 1.3750 (R1), 1.3790 (R2), 1.3850 (R3)
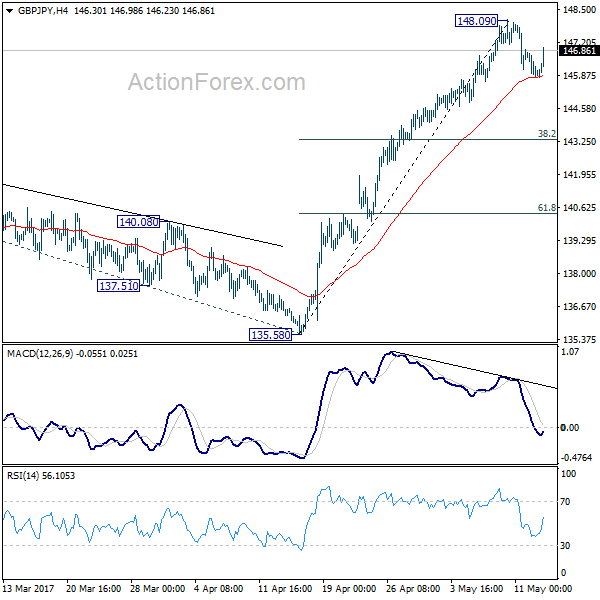
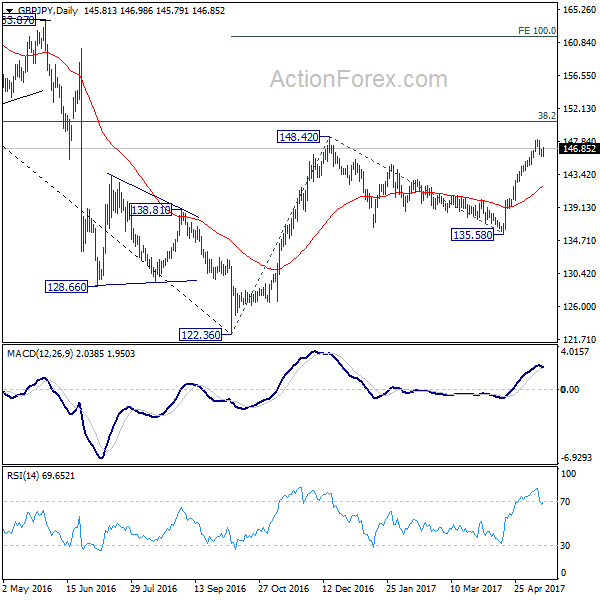
GBP/JPY Daily Outlook
Daily Pivots: (S1) 145.62; (P) 146.20; (R1) 146.61; More....
Intraday bias in GBP/JPY remains neutral for the moment. Consolidation from 148.09 could extend. But in case of deeper fall downside should be contained by 38.2% retracement of 135.58 to 148.09 at 143.31 and bring rise resumption. Break of 148.42 will target 150.42 long term fibonacci level first. Break there will pave the way to 100% projection of 122.36 to 148.42 from 135.58 at 161.64.
In the bigger picture, based on current momentum, rise from 122.36 bottom should be developing into a medium term move. Break of 38.2% retracement of 195.86 to 122.36 at 150.42 should pave the way to 61.8% retracement at 167.78. This will now be the favored case as long as 135.58 support holds.
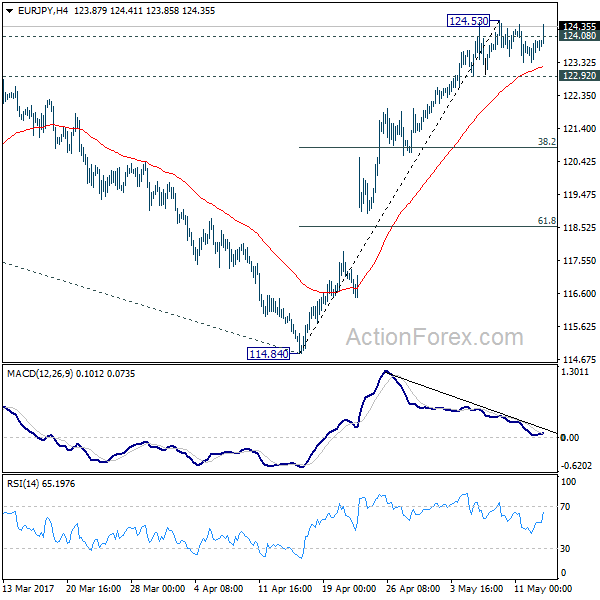
EUR/JPY Daily Outlook
Daily Pivots: (S1) 123.47; (P) 123.71; (R1) 124.12; More...
Intraday bias in EUR/JPY remains neutral for the moment as it's limited below 124.53. On the upside, break of 124.53 will extend rise from 114.84 and 109.03 to target 126.09 key resistance next. Break there will pave the way to 100% projection of 109.03 to 124.08 from 114.84 at 129.89. Nonetheless, considering bearish divergence condition in 4 hour MACD, a short term top could be in place. Break of 122.92 minor support will bring deeper pull back towards 38.2% retracement of 114.84 to 124.53 at 120.82.
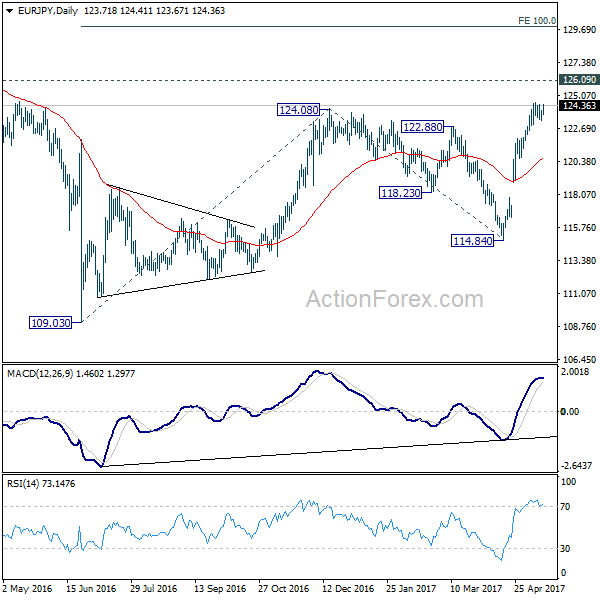
In the bigger picture, focus is back on 126.09 support turned resistance. Decisive break there will confirm completion of the down trend from 149.76. And in such case, rise from 109.20 is at the same degree and should target 141.04 resistance and above. Meanwhile, rejection from 126.09 and break of 114.84 will extend the fall from 149.76 through 109.20 low.
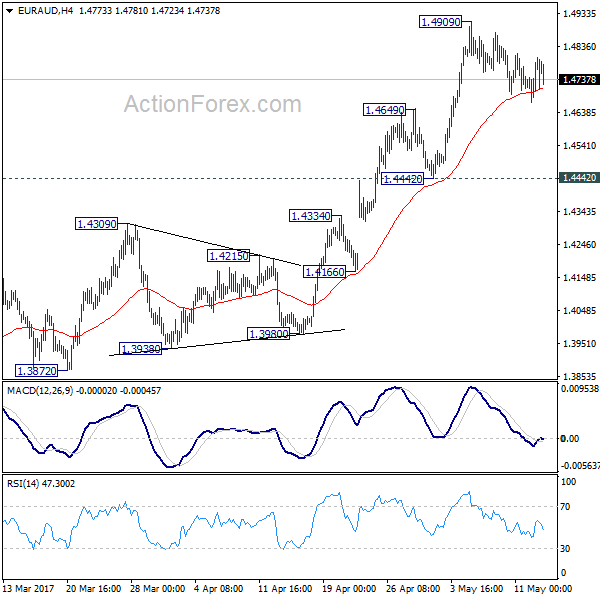
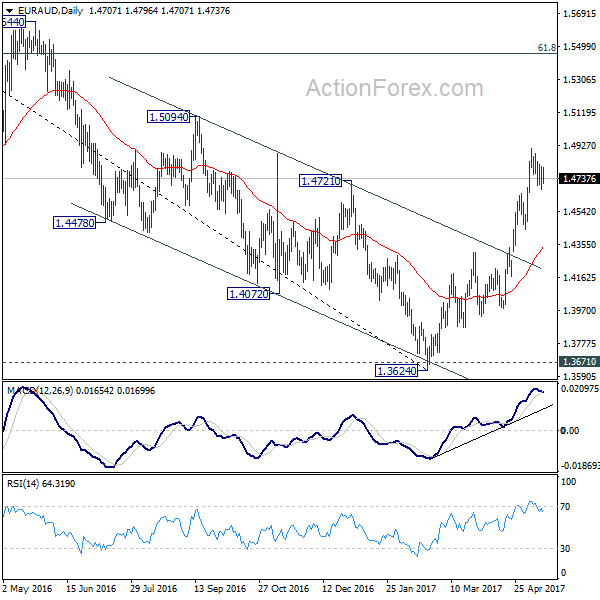
EUR/AUD Daily Outlook
Daily Pivots: (S1) 1.4705; (P) 1.4755; (R1) 1.4838; More...
Intraday bias in EUR/AUD remains neutral for consolidation below 1.4909 temporary top. More consolidations could be seen but downside should be contained by 1.4442/4649 support zone to bring rise resumption. Above 1.4909 will extend recent rally from 1.3624 to next medium term fibonacci level at 1.5455. Overall near term outlook is that whole correction from 1.6587 has completed at 1.3624 already after defending 1.3671 key support level.
In the bigger picture, price actions from 1.6587 medium term top are viewed as a corrective pattern. Such correction should be completed after defending 1.3671 key support. Rise from 1.3642 is now expected to target 61.8% retracement of 1.6587 to 1.3624 at 1.5455 and above. In any case, outlook will now stay cautiously bullish as long as 1.4309 resistance turned support holds.
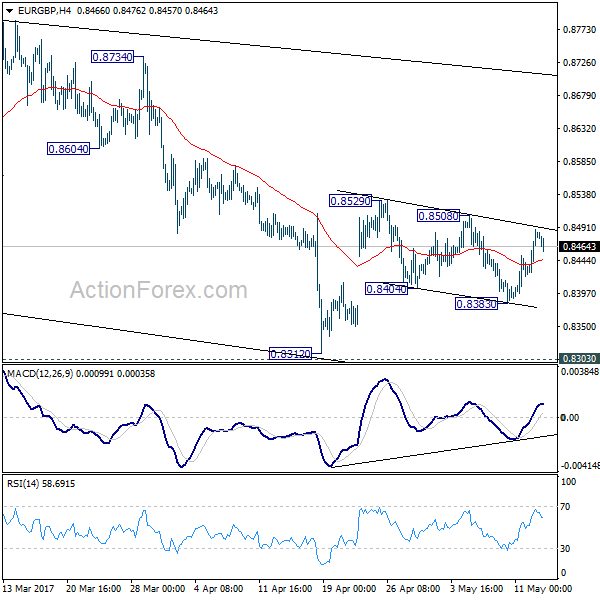
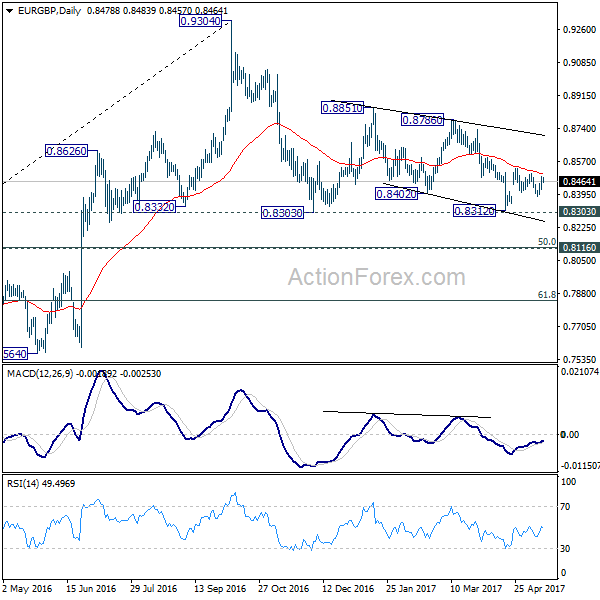
EUR/GBP Daily Outlook
Daily Pivots: (S1) 0.8441; (P) 0.8465; (R1) 0.8505; More...
Intraday bias in EUR/GBP remains neutral for the moment. The corrective structure of fall from 0.8529 to 0.8383 suggests that rebound from 0.8312 is still in progress. On the upside, break of 0.8508 will extend the rebound from 0.8312 to 0.8786 resistance next. Further break there will target 0.9304 high. On the downside, below 0.8383 will turn bias to the downside for 0.8303/8312 support zone instead. Overall, EUR/GBP is staying in the corrective pattern from 0.9304 which will extend for a while.
In the bigger picture, price actions from 0.9304 are viewed as a medium term corrective pattern. In case of deeper fall, we'd expect strong support from 0.8116 cluster support (50% retracement of 0.6935 to 0.9304 at 0.8120) to contain downside. Rise from 0.6935 (2015 low) will resume at a later stage to 0.9799 (2008 high). However, sustained break of 0.8116 could bring deeper decline to next key support level at 0.7564 before the correction completes.
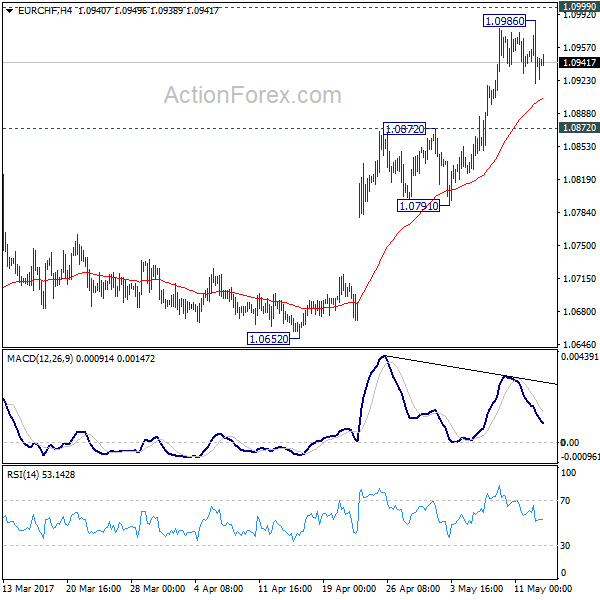
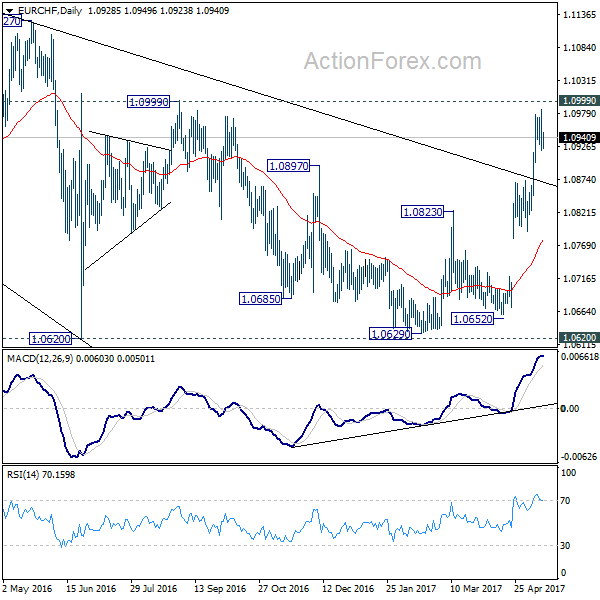
EUR/CHF Daily Outlook
Daily Pivots: (S1) 1.0912; (P) 1.0949; (R1) 1.0978; More...
Intraday bias in EUR/CHF remains neutral for consolidation first. Outlook is unchanged that corrective pattern from 1.1198 has completed already after defending 1.0653 fibonacci level. Downside of the current consolidation should be contained by 1.0791/0872 support zone to bring rise resumption. Firm break of 1.0999 resistance will pave the way for a retest on 1.1198 high.
In the bigger picture, the price actions from 1.1198 are seen as a corrective move. Current strong rebound is raising the chance that it's completed after defending 38.2% retracement of 0.9771 to 1.1198 at 1.0653. Decisive break of 1.0999 resistance will target a test on 1.1198 high. For now, this will be the preferred case as long as 1.0791 support holds.
EUR/USD Candlesticks and Ichimoku Analysis
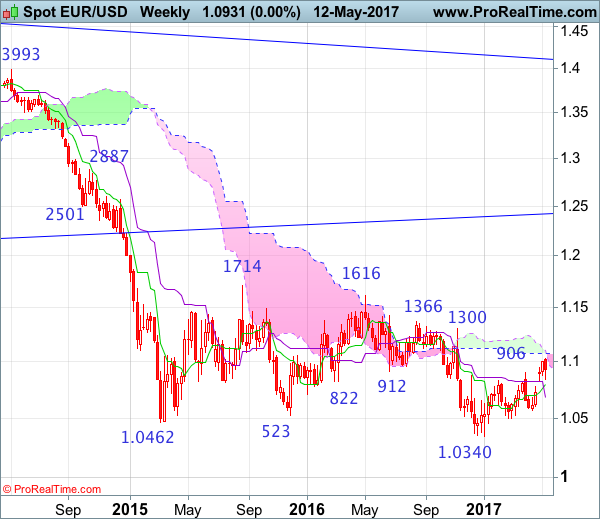
Weekly
• Last Candlesticks pattern: Shooting star
• Time of formation: 03 May 2016
• Trend bias: Down
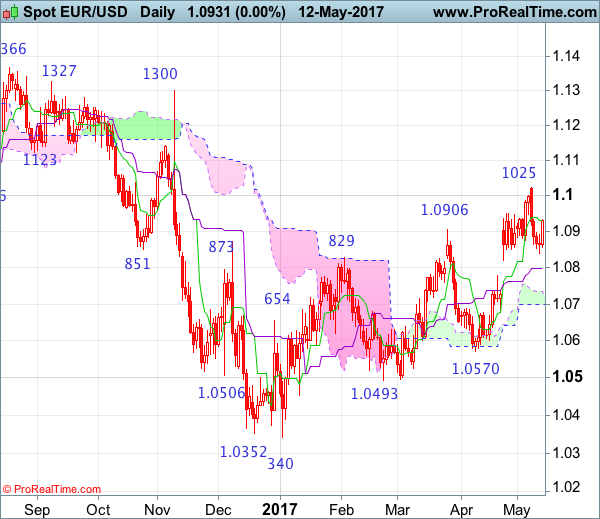
Daily
• Last Candlesticks pattern: Shooting star
• Time of formation: 3 May 2016
• Trend bias: Sideways
EUR/USD – 1.0946
The single currency retreated after rising to 1.1025 and consolidation below this level would be seen, however, reckon downside would be limited and the Kijun-Sen (now at 1.0798) and should attract renewed buying interest and bring another rise later, above said resistance at 1.1025 would add credence to our bullish view that the erratic rise from 1.0340 low is still in progress and upside bias remains for this move to extend further gain to 1.1050-60 and possibly towards 1.1100, however, reckon upside would be limited to 1.1125-30 (61.8% Fibonacci retracement of 1.1616-1.0340) and price should falter well below previous chart resistance at 1.1300, bring strong retreat later.
On the downside, whilst initial pullback to 1.0870-75 cannot be ruled out, reckon downside would be limited to the Kijun-Sen (now at 1.0798) and bring another rise later to aforesaid upside targets. Below said support at 1.0778 would defer and risk weakness to the lower Kumo (now at 1.0700) but only break there would signal a temporary top is formed, bring further fall to 1.0675 but a daily close below 1.0609 would signal recent rise from 1.0340 has ended, risk test of key support at 1.0570 first.
Recommendation: Buy at 1.0800 for 1.1000 with stop below 1.0700.
On the weekly chart, as the single currency has retreated after rising to 1.1025 last week and consolidation below this level would be seen and pullback to support at 1.0835-40 cannot be ruled out, however, reckon the Tenkan-Sen (now at 1.0798) would limit downside and bring another rise later, above said resistance at 1.1025 would extend recent rise from 1.0340 low for retracement of recent downtrend, hence further gain to the upper Kumo (now at 1.1070) but reckon upside would be limited to 1.1125-30 (61.8% Fibonacci retracement of 1.1616-1.0340) and 1.1200-10 would hold, price should falter well below strong resistance at 1.1366.
On the downside, expect pullback to be limited to support at 1.0839 and the Tenkan-Sen (now at 1.0798) should hold, bring another rise later. Only a drop below previous resistance at 1.0778 would abort and suggest top is formed instead, bring weakness to 1.0682-83 (current level of the Kijun-Sen and previous support). Below there would shift risk to the downside for further gall to 1.0570 support but only a weekly close below there would provide confirmation the aforesaid corrective rise from 1.0340 low has ended, then further decline towards key level at 1.0493 would follow.
Market Update – Asian Session: Sluggish China Economic Data Signals Possible Slowdown
Asia Mid-Session Market Update: Sluggish China economic data signals possible slowdown; North Korea launches ballistic missile that lands near Russia
Friday US Session Highlights
(US) APR ADVANCE RETAIL SALES M/M: 0.4% V 0.6%E; RETAIL SALES EX AUTO M/M: 0.3% V 0.5%E
(US) APR CPI M/M: 0.2% V 0.2%E; CPI EX FOOD AND ENERGY M/M: 0.1% V 0.2%E; CPI INDEX NSA: 244.524 V 244.610E; core unrounded m/m increase was just 0.07%; ex food and Energy Y/Y: 1.9% v 2.0%e
(CN) China PBoC Q1 Monetary Policy Implementation Report: Reiterates to maintain its prudent but neutral approach
JC Penny and Nordstrom keep pressure on retailers
GE hits 15-month low on downgrade; Tidewater files for Chapter 11
G7 highlights from weekend
G7 discussed cybersecurity including Friday attack
ECB's Weidmann (Germany): The strengthening economic development in the euro zone and the robust outlook make monetary policy normalization conceivable
German Fin Min Schaeuble: feeling more confident that euro zone members will come up with solution to dispute of reforms and debt by the next Euro Group meeting
US Treasury Sec Mnuchin: Preliminary talks with Mexico and Canada on NAFTA have been productive
Weekend US/EU Corporate Headlines
WHLR Announces Strategic Plan for Two Anchor Tenant Store Closures
ABE.ES Atlantia said to launch takeover bid for Abertis despite not having support from Abertis' major shareholder Criteria – FT
(DE) Chancellor Merkel's Christian Democrats (CDU) received 33% support in the North Rhine-Westphalia (NRW) elections
(US) House Speaker Paul Ryan: Conditions in place for tax reform by year-end, BAT seen as unlikely by G7
Key economic data:
(CN) CHINA APR INDUSTRIAL PRODUCTION Y/Y: 6.5% V 7.0%E; YTD Y/Y 6.7% V 6.9%E
(CN) CHINA APR RETAIL SALES Y/Y: 10.7% V 10.8%E; YTD Y/Y: 10.2% V 10.2%E
(CN) CHINA APR FIXED ASSETS EX RURAL YTD Y/Y: 8.9% V 9.1%E
(NZ) NEW ZEALAND MAR PERFORMANCE SERVICES INDEX:52.8 V 58.8 PRIOR
(AU) AUSTRALIA MAR HOME LOANS M/M: -0.5% V 0.0%E
(NZ) NEW ZEALAND Q1 RETAIL SALES (EX-INFLATION): 1.5% V 0.9%E
(JP) JAPAN APR PPI SERVICES (CGPI) M/M: 0.2% V -0.1%E; Y/Y: 2.1% V 1.8%E
(JP) Japan Mar Loans & Discounts Corp y/y: 3.2% v 3.4% prior
Asia Session Notable Observations, Speakers and Press
China
(CN) China President Xi pledges $124B (+$14.5B from prior) for new Silk Road as champion of globalization - (CN) PBOC Gov Zhou: greater use of local currencies under 'Belt and Road' initiative will help to reduce costs and increase financial stability
(CN) China President Xi: Belt and Road initiative needs to reject protectionism and avoid fragmentation
(CN) China National Bureau of Stats (NBS): Economic growth is still within a reasonable range
Korea
(KR) North Korea: Says test-fire of new ballistic rocket was “successful”; newly developed rocket is capable of carrying a large-size heavy nuclear warhead
Asian Equity Indices/Futures (00:30ET)
Nikkei -0.1%, Hang Seng +0.6%, Shanghai +0.3%, ASX200 -0.2%, Kospi +0.2%
Equity Futures: S&P500 +0.1%; Nasdaq +0.1%, Dax +0.2, FTSE100 +0.1%
FX ranges/Commodities/Fixed Income (00:30ET)
EUR 1.0935-1.0921; JPY 113.46-113.13; AUD 0.7403-0.73850; NZD 0.6879-0.6853; GBP 1.2903-1.2881
June Gold +0.3% at 1,224/oz; June Crude Oil +0.8% at $48.60/brl; July Copper flat at $2.52/lb
USD/CNY *(CN) PBOC SETS YUAN MID POINT AT 6.8852 V 6.8948 PRIOR (third straight firmer fix for the yuan, strongest fix for yuan since April 26th)
(CN) China PBoC skips reverse repo operations v skipped prior (2nd consecutive skip)
(KR) Bank of Korea sells KRW1.2T in 1-year monetary stabilization bonds at 1.44% v 1.49% prior
(KR) South Korea MoF sells 5-yr bonds at 1.925%
(SA) Saudi Oil Min Al-Falih: Russia and Saudi Arabia said to be in favor of extending OPEC deal for 9-months to March 2018; decision to be made May 25th - financial press
(MY) Malaysia sells MYR3.0B in 2027 bonds; avg yield 3.899%; bid-to-cover ratio 3.34x
Asia equities/Notables/movers
Australia
FXJ.AU Receives increased proposal from TPG worth A$1.20/share in cash, ~26% above prior proposal of A$0.95/share (implied value is A$2.76B, ~12% premium to prior close); +7.5%
FFT.AU Guides FY17 EBITDA loss A$6.0-9.0M; -25%
SGH.AU Received notice requiring production of documents from UK Serious Fraud Office in relation to Watchstone Group +9.5%
Hong Kong
2688.HK, ENN Energy and other sector names weaker on gas sector move, -9.2%
2018.HK Comments on claims by Gotham City Research: Says considers the report's suggestion "groundless" and "misleading", -5%
Japan
6502.JP Guides FY16/17 Net loss ¥950B v loss ¥483B y/y; Op ¥270B v loss ¥719B y/y; Rev ¥4.87T v ¥5.67T y/y; +3.8%
8604.JP Said to be in talks to sell a stake in real estate unit to Japan Post - financial press ; +0.5%
Forex Technical Analysis: EUR/USD, USD/JPY, GBP/USD
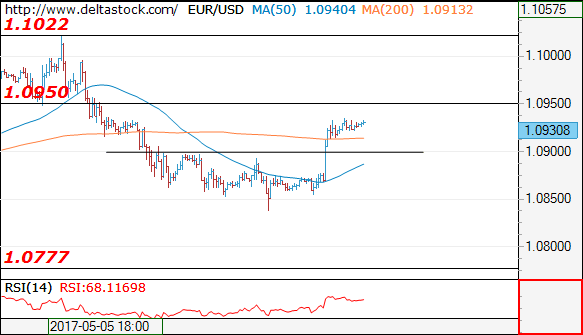
EUR/USD
Current level - 10930
The recent break through 1.0900 resistance signals a reversal of the slide at 1.0838 and the intraday bias is positive, for an attack of 1.0950 hurdle. A violation of the latter will challenge 1.1020 peak.
| Resistance | Support | ||
| intraday | intraweek | intraday | intraweek |
| 1.0950 | 1.1070 | 1.0900 | 1.0770 |
| 1.1020 | 1.1150 | 1.0835 | 1.0675 |
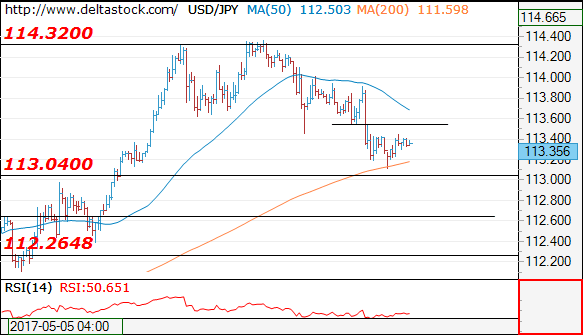
USD/JPY
Current level - 113.35
The recent slide has bottomed above 113.00 support zone and a break through the crucial high at 113.90 will show a renewal of the upmove towards 115.60 target mark. Minor intraday resistance lies at 113.50.
| Resistance | Support | ||
| intraday | intraweek | intraday | intraweek |
| 113.90 | 113.50 | 113.00 | 109.40 |
| 115.60 | 115.60 | 112.35 | 108.12 |
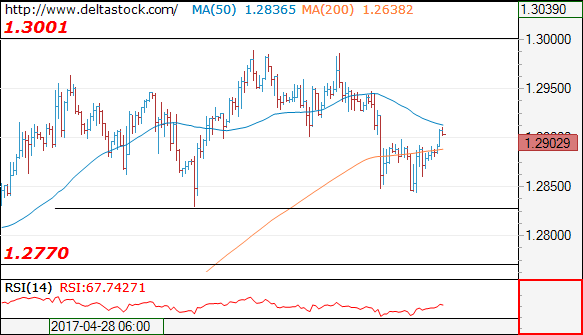
GBP/USD
Current level - 1.2903
The pair failed to break through 1.2830 crucial low and the intraday bias is neutral. Minor resistance lies at 1.2950.
| Resistance | Support | ||
| intraday | intraweek | intraday | intraweek |
| 1.2950 | 1.3120 | 1.2830 | 1.2770 |
| 1.3000 | 1.3500 | 1.2770 | 1.2610 |
US Dollar Slips On Soft Inflation Figures. Quiet Day Ahead
The US dollar fell sharply on Friday after data showed that consumer price index rose 0.2% on a month over month basis in April. This was a modest improvement following the 0.3% decline in March. Economists polled were expecting inflation to rise 0.3% instead.
Retail sales numbers were also soft, rising 0.4%, less than the forecasts of 0.6% increase. March's retail sales numbers were revised from -0.2% to 0.1%.
The US dollar was seen trading subdued on today's open. Economic data released so far showed China's industrial production rise 6.5%, less than the expected 7.0%, while retail sales rose 10.7%, slightly below forecasts of 10.8%.
Later in the day, the NY Fed's Empire State Manufacturing index is coming up with economists’ expecting the manufacturing activity in the New York area to rise to 7.2 after slipping to 5.2 the month before. Manufacturing activity in the New York area was seen weakening for the past two consecutive months.
EURUSD intraday analysis
EURUSD (1.0930): EURUSD brushed past the 1.0900 price level on Friday, and further gains are likely to come by if support is seen being established at 1.0900. This would potentially keep the upside target towards 1.1000 in sight. However, a continuation without a pullback could see EURUSD test 1.0950 where resistance could be formed. This would mark a pullback from the recent declines and could signal a continuation towards 1.0850 followed by 1.0750.
GBPUSD intraday analysis
GBPUSD (1.2905): The British pound gapped lower this morning, opening at 1.2801 with price posting strong gains, currently trading at 1.2899 and recovering the past losses. On the 4-hour chart, the test to 1.2800 comes as a retest of the upside break-out from the bullish flag pattern that emerged three weeks ago. With prices testing 1.2900 level, further upside could be seen coming but watch for the familiar resistance at 1.2988 - 1.2965.
XAUUSD intraday analysis
XAUUSD (1230.86): Gold prices have been posting a modest recovery for the past three days after the price fell to a two month low at 1214.24. The upside recovery could continue if gold posts a higher low on the 4-hour chart. The downside correction could see price retest the support at 1221.47 where a higher low could confirm the upside in price. Resistance is seen coming in at 1250.00, although a continuation to the upside could see further gains pushing gold prices to 1263.00 and 1274.00.