
Sample Category Title
USD/JPY Candlesticks and Ichimoku Analysis
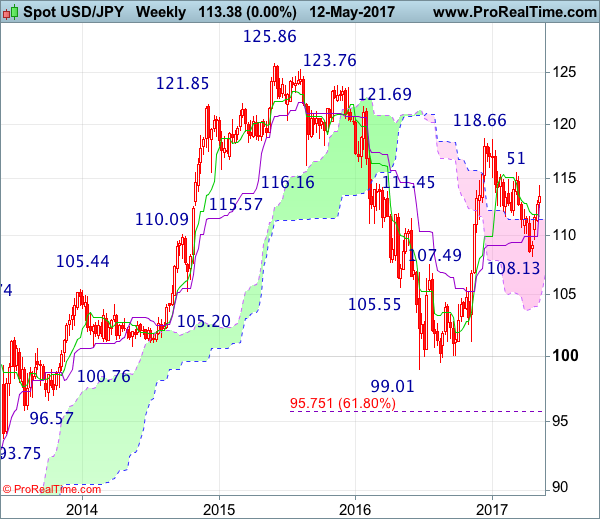
Weekly
• Last Candlesticks pattern: Marubozu
• Time of formation: 14 Nov 2016
• Trend bias: Down
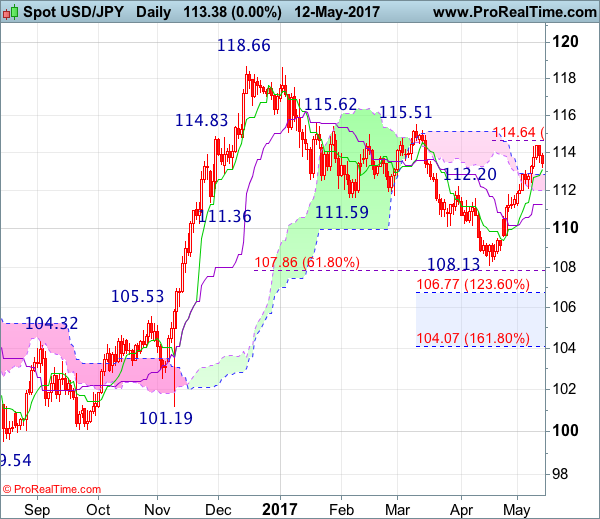
Daily
• Last Candlesticks pattern: Shooting star
• Time of formation: 15 Feb 2017
• Trend bias: Down
USD/JPY – 112.71
As the greenback has eased after meeting resistance at 114.37, suggesting consolidation below this level would be seen and pullback to the upper Kumo (now at 112.81) is likely, however, reckon downside would be limited to 111.70-75 and price should stay above the Kijun-Sen (now at 111.25) and bring another rise later, above said resistance at 114.37 would extend recent rise from 108.13 low to 114.60-65 (61.8% Fibonacci retracement of 118.66-108.13), then 115.00 but reckon upside would be limited to indicated key resistance at 115.51, bring retreat later.
On the downside, whilst initial pullback to the upper Kumo (now at 112.81) cannot be ruled out, reckon downside would be limited to 112.05-10 and renewed buying interest should emerge around 111.70 and the Kijun-Sen (now at 111.25) should hold, bring another rise later. Below 110.85-90 would suggest top is possibly formed, bring correction to 110.00 but support at 109.59 should remain intact, bring rebound later. Only a daily close below this support at 109.59 would confirm and bring weakness to 108.85-90 but break there is needed to signal the rebound from 108.13 has ended, then retest of this recent low would follow.
Recommendation : Buy at 111.70 for 113.70 with stop below 110.70.
On the weekly chart, although dollar edged higher to 114.37 last week, lack of follow through buying suggests initial consolidation below this level would be seen and pullback to 112.00-10 cannot be ruled out, however, reckon downside would be limited to 111.70-75 and bring another rise later, above said resistance at 114.37 would extend the rise from 108.13 to 114.60-65 (61.8% Fibonacci retracement of 118.66-108.13), however, reckon upside would be limited and price should falter well below resistance at 115.51. Looking ahead, only a break of 115.51 would retain bullishness and signal the entire correction from 118.66 has ended at 108.13), bring further rise to 119.50, then 120.00-10 but resistance at 121.69 should remain intact.
On the downside, expect pullback to be limited to 112.00-05 and the Tenkan-Sen (now at 111.25) should hold, bring another rise later. Below support at 111.21 would defer and suggest top is possibly formed, risk weakness to 110.45-50 but only break of indicated previous support at 109.59 would add credence to this view, bring further fall to previous resistance at 109.49. A drop below this level would provide confirmation, bring weakness to 108.80-85, break there would bring retest of 108.13 support, once this level is penetrated, this would revive bearishness an extend recent selloff from 118.66 to 107.85-90 (61.8% Fibonacci retracement of 101.19-118.66), then towards 107.00, however, reckon downside would be limited to 106.50-55 (61.8% Fibonacci retracement of 99.01-119.52) and previous resistance at 105.53 (now support) should remain intact.
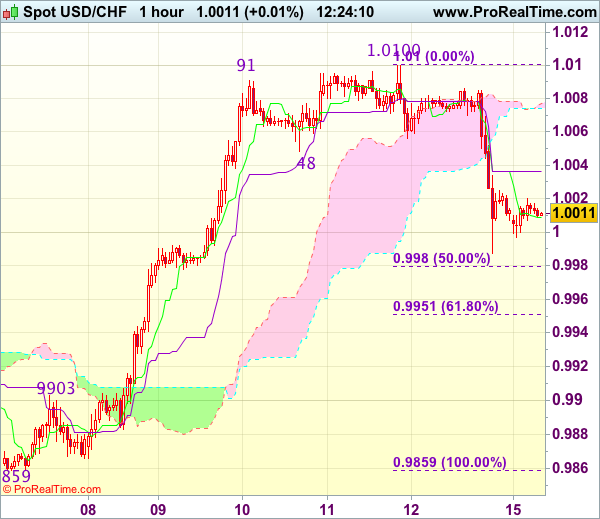
Trade Idea : USD/CHF – Stand aside
USD/CHF - 1.0005
Most recent candlesticks pattern : N/A
Trend : Near term up
Tenkan-Sen level : 1.0010
Kijun-Sen level : 1.0037
Ichimoku cloud top : 1.0078
Ichimoku cloud bottom : 1.0074
New strategy :
Stand aside
Position : -
Target : -
Stop : -
Friday’s selloff suggests a temporary top has possibly been formed at 1.0100 last week and consolidation with downside bias remains for retracement of recent rise towards 0.9980 (50% Fibonacci retracement of 0.9859-1.0100), break there would add credence to this view, bring further fall to 0.9950-55 (61.8% Fibonacci retracement) but price should stay well above previous resistance at 0.9903, bring rebound next week.
In view of this, would be prudent to stand aside in the meantime. Above 1.0045-50 would bring recovery to 1.0080-85, however, price should falter below strong resistance at 1.0100-8 and bring further consolidation later.
Trade Idea : GBP/USD – Hold short entered at 1.2900
GBP/USD - 1.2919
Most recent candlesticks pattern : N/A
Trend : Near term up
Tenkan-Sen level : 1.2900
Kijun-Sen level : 1.2882
Ichimoku cloud top : 1.2919
Ichimoku cloud bottom : 1.2894
Original strategy :
Sold at 1.2900, Target: 1.2800, Stop: 1.2935
Position : - Short at 1.2900
Target : - 1.2800
Stop : - 1.2935
New strategy :
Hold short entered at 1.2900, Target: 1.2800, Stop: 1.2935
Position : - Short at 1.2900
Target : - 1.2800
Stop : - 1.2935
As cable has rebounded again after finding strong support at 1.2844 on Friday, suggesting near term upside risk remains but as long as 1.2930 holds, further consolidation would take place and bearishness remains for another decline, below 1.2860 would bring retest of 1.2844 support but break there is needed to extend the fall from 1.2991 top to 1.2831 support, break there would bring subsequent weakness to 1.2805 and later towards 1.2770, however, reckon previous support at 1.2757 would hold from here.
In view of this, we are holding on to our short position entered at 1.2900. Above 1.2930 would risk test of 1.2950-60 but break there is needed to signal low is formed, bring another bounce towards 1.2988-91 resistance but break of 1.2999-00 (1.236 times projection of 1.2109-1.2616 measuring from 1.2365 and psychological resistance) is needed to revive bullishness.
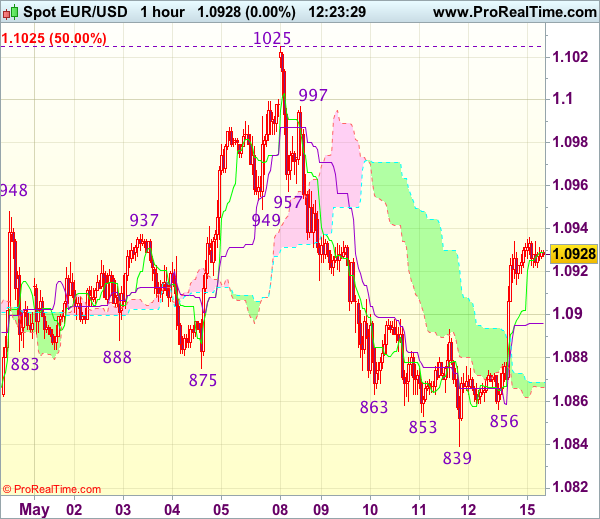
Trade Idea : EUR/USD – Sell at 1.0995
EUR/USD - 1.0936
Most recent candlesticks pattern : N/A
Trend : Near term down
Tenkan-Sen level : 1.0930
Kijun-Sen level : 1.0897
Ichimoku cloud top : 1.0869
Ichimoku cloud bottom : 1.0866
Original strategy :
Sell at 1.0980, Target: 1.0860, Stop: 1.1015
Position : -
Target : -
Stop : -
New strategy :
Sell at 1.0995, Target: 1.0880, Stop: 1.1030
Position : -
Target : -
Stop : -
Euro has staged a strong rebound after falling to 1.0839, suggesting consolidation above this level would be seen and near term upside risk remains for further gain to 1.0960, however, if our view that top has been formed at 1.1025 is correct, upside would be limited and resistance at 1.0997 should hold, bring another decline later. Below 1.0895-00 would bring weakness to 1.0855-60 but break there is needed to retain bearishness an extend the fall from 1.1025 top to 1.0821, then 1.0795-00 later.
In view of this, we are still looking to sell euro but at a higher level as 1.0997 resistance should limit upside. Only break of said resistance at 1.1025 would abort and signal early upmove has resumed instead, bring further gain to 1.1050-55 and later 1.1075-80 before prospect of another retreat.
Trade Idea : USD/JPY – Buy at 112.70
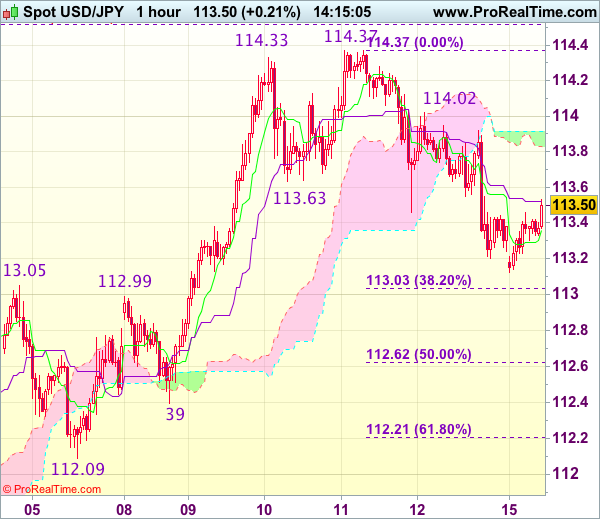
USD/JPY - 113.39
Most recent candlesticks pattern : N/A
Trend : Near term up
Tenkan-Sen level : 113.30
Kijun-Sen level : 113.52
Ichimoku cloud top : 113.92
Ichimoku cloud bottom : 113.83
New strategy :
Buy at 112.70, Target: 113.80, Stop: 112.35
Position : -
Target : -
Stop : -
As the greenback dropped last Friday’s on dollar’s broad-based weakness, suggesting temporary top has been formed at 114.37 last week and near term downside risk remains for a stronger correction of recent rise to 113.00-05, however, 112.60-65 (50% Fibonacci retracement of 110.87-114.37) should limit downside and bring rebound later, above 113.60-65 would bring test of 114.00-05 but break of latter level is needed to signal the pullback from 114.37 has ended, bring retest of this level later.
In view of this, we are inclined to buy dollar on next decline but one should exit on such rebound as 114.37 resistance should cap upside. Below support at 112.39 would risk further weakness to 112.20-25 (61.8% Fibonacci retracement of 110.87-114.37) but still reckon previous support at 112.09 would hold from here.
Europe Seen Higher As Oil Spikes On Output News
- Markets boosted by Chinese stimulus plans and oil rally;
- Chinese data disappoints but consumer spending remains strong;
- Oil rallies as Russia and Saudi energy ministers support output cut extension;
- Traders look for signs of 'upside news on growth or inflation' in this week's UK data.
European equity markets are expected to open a little higher on Monday, tracking gains throughout most of Asia and buoyed by gains in oil.
We've seen moderate gains throughout most of Asia overnight, with the exception of Japan where earlier advances in the yen appear to have weighed on the index. While reports over the weekend of a global cyberattack and another missile launch from North Korea may have prompted some risk aversion this morning, it seems the prospect of substantial infrastructure spending from China and its commitment to free trade is taking priority.
Even the softer than expected figures from China overnight are being overlooked, with retail sales, industrial production and fixed asset investment figures all falling short of expectations. Double digit growth in consumer spending remains a positive of the data, given the efforts to move away from a reliance on investment and exports.
Oil prices are up more than 1.5% in early trade on Monday, boosted by reports over the weekend that energy ministers from Russia and Saudi Arabia support extending production cuts by another nine months to the end of the first quarter of next year. The two countries – which are responsible for around a fifth of total daily output – are crucial to the success of the cut and I would now expect other participating nations to get behind the extension as well.
Of course, with the US taking full advantage of higher prices and increasing output rapidly at the same time, attempts to rebalance the oil market have been more difficult than anticipated. With any extension likely to keep prices elevated, it will be interesting to see whether the US can continue to ramp up production on the same scale as it has in recent months. If so, compliance with any new cut and the rebalancing efforts will be severely tested with both Russia and Saudi Arabia not wanting to lose market share in key markets.
It's likely to be another relatively quiet week on the data side, with the UK being a particular focus in Europe. Inflation numbers on Tuesday will be followed by the latest labour market figures on Wednesday and retail sales on Thursday, as traders look for evidence of the economy or prices rising faster than expected, given that, in the words of the Bank of England, 'some MPC members would need relatively little upside news on growth or inflation to consider voting for tighter policy'. Should we see signs of this in the coming days, it could offer a boost for sterling as it moves back above 1.29 against the dollar again, with the focus very much on 1.30.
AUD Forecast Unclear Ahead Of Consumer Sentiment Data
Key Points:
- Weak technical bias could see a ranging phase occur.
- Fundamentals likely to be more important as we move ahead.
- Consumer Sentiment data likely to be the key risk event.
The AUDUSD was all over the show last week which now begs the question, where is it off to in the week to come? Due to this, it's worth taking a look at exactly what happened and how this has positioned the pair for what's coming down the line fundamentally. However, we should also take a look at the technical forecast to try gauge whether the bulls or bears are going to be in command moving forward.
Starting with lasts week's performance, the Aussie Dollar had a fairly torrid few sessions of trading as it initially sank sharply before correcting as the week came to an end. This initial bearishness was a symptom of the 0.1% contraction in the Australian Retail Sales figure which revived the only recently allayed fears of a recession. The subsequent reversal stemmed primarily from some weaker US data, including the softer than expected Core CPI result of only 0.1% and a Core Retail Sales figure of 0.3%. Overall, the two swings largely offset one another and the pair closed only fractionally lower at 0.7384.
On the technical front, the AUD remained bound by its narrowing wedge last week but it is now equidistant from either constraint which leaves its technical outlook somewhat uncertain. Nevertheless, the EMA bias and the Parabolic SAR reading continue to favour the downside which means we are now poised to see more losses. This bearish outlook is only reinforced by the long wick on Friday's candle which seems to suggest that the bulls are fairly thin on the ground.
As for what lies ahead on the news front, the Australian Consumer Sentiment data will be worth monitoring this week as it could generate a much larger move than is typical of the release. This is primarily due to the fact that it is the first reaction we have to the recently presented federal budget which has had a mixed reception in the online commentary space. If we have a solid uptick in the sentiment result, we could see the pair hold onto the prior few session's gains as they are currently in danger of being eroded. However, also keep half an eye on the Aussie Unemployment Rate, even though it's expected to remain flat at 5.9%.
Ultimately, the relatively weak technical bias and the unclear fundamental outlook make the AUD a risky bet moving ahead. Ideally, we would need to see the pair move closer to the constraints of its wedge before we can forecast a strong reversal which likely means a ranging phase should take hold this week. As a result, we don't expect to see price action break out of the 0.7420 – 0.7367 levels this week unless we see some major fundamental upsets.
Cable Likely To Remain Bearish In The Week Ahead
Key Points:
- Cable likely to remain bearish in the coming session.
- Support at 1.2830 will be relatively critical.
- Technical factors currently suggesting a corrective move ahead.
The Cable had a week in the red as the pair experienced a sentiment swing towards the greenback following the release of a range of stronger U.S. economic data. In addition, the Bank of England also impacted the Cable's prospects following the release of the latest MPC statement that proved to be significantly more dovish than expected. Subsequently, the pair continued to slip lower during the trading week and closed the final session out around the 1.2883 mark. Subsequently, we take a look at what occurred last week with a view to discovering some insight for the coming session.
The Cable provided a relatively poor performance last week as the currency reacted to a range of stronger U.S economic data as well as a relatively dovish central bank. In particular, the U.S. JOLTS figures sent the pair reeling, as did the surprisingly strong Unemployment Claims result at 236k. However, it was largely the Bank of England and their dovish outlook on interest rates that did the pair the most damage. The decision was always going to be to keep the official bank rate on hold at 0.25%, but the dovish rhetoric was largely unexpected and saw the Cable give up around 60 pips just from the central bank's statement. Subsequently, the pair closed the trading week out around the 1.2883 mark.
Looking ahead, the Cable is in for an exceedingly busy week with the primary focus to fall upon the UK CPI and Core Retail Sales data. In fact, the CPI figures are likely to be very closely watched because of the building inflation that has been evident within the UK economy. Subsequently, this is likely to inform on potential action from the Bank of England incoming MPC meetings. Additionally, the Core Retail Sales figures could also prove illuminating given that they are a good gauge of consumer spending and demand. The forecast has the benchmark rising to 1.0% but we could potentially see a slight uptick in that result. On the U.S. side of the ditch, watch out for the Philly Fed Manufacturing Index, estimated to come in at 19.8.
From the technical perspective, the pair's recent decline has relieved some pressure from the overbought RSI and Stochastic Oscillator's. However, the trend is still downward in nature and the 1.2830 support zone could be challenged in the coming week. Subsequently, our bias is bearish given that we are no longer forming higher highs.Support is currently in place for the pair at 1.2830, 1.2754, and 1.2625. Resistance exists on the upside at 1.2986, 1.3121, and 1.3335.
Ultimately, the UK CPI figures are likely to set the fundamental trend for the pair in the week ahead. However, even a strong result will need to contend with the various technical indicators which are all suggesting that the coming week could prove relatively negative for the pair.
European Open Briefing: Asian Stock Markets Had A Solid Performance
Global Markets:
- Asian stock markets: Nikkei down 0.20 %, Shanghai Composite gained 0.30 %, Hang Seng rose 0.70 %, ASX 200 lost 0.10 %
- Commodities: Gold at $1230 (+0.20 %), Silver at $16.52 (+0.70 %), WTI Oil at $48.65 (+1.70 %), Brent Oil at $51.70 (+1.70 %)
- Rates: US 10-year yield at 2.33, UK 10-year yield at 1.10, German 10-year yield at 0.39
News & Data
- China Industrial Production 6.5 % vs 7.1 % expected
- China Retail Sales 10.7 % vs 10.6 % expected
- China Fixed Asset Investment 8.9 % vs 9.1 % expected
- New Zealand Retail Sales q/q 1.5 % vs 1.1 % expected
- New Zealand Core Retail Sales q/q 1.2 % vs 0.9 % expected
- Japan PPI m/m 0.2 % vs -0.1 % expected
- Japan PPI y/y 2.1 % vs 1.8 % expected
- Australia Home Loans -0.5 % vs 0.1 % expected
- PBOC sets USD/CNY central rate at 6.8852 (vs. Friday at 6.8948)
- Russia's Novak: Russia And Saudi Agree Output Cuts Need to Be Extended Until March 2018
CFTC Positioning Data:
- EUR long 22K vs 2K short last week. Longs increased by 24K
- GBP short 47K vs 81K short last week. Shorts trimmed by 34K
- JPY short 36K vs 30K short last week. Shorts increased by 6K
- CHF short 15K vs 18K short last week. Shorts trimmed by 3K
- CAD short 86K vs 48K short. Shorts increased by 38K
- AUD long 26K vs 43K long. Longs cut 17K
- NZD short 11K vs 12K short last week. Shorts trimmed by 1K
Markets Update:
Markets did not react to the news about another North Korean missile test. Asian stock markets had a solid performance overall, and commodity currencies rose overnight, indicating that risk appetite remains intact for now.
EUR/USD opened in Asia around 1.0930, unchanged from Friday's close. The currency rose on Friday on rumours that the ECB might signal the end of its ultra-loose monetary policy this summer. However, those are still only rumours. EUR/USD faces resistance at 1.0950, followed by 1.10.
USD/JPY recovered slightly overnight. Resistance is now seen at the former support area between 113.70 and 113.80. Key support is noted at 113. Should USD/JPY break below it, further losses towards 112.20 seem likely.
AUD/USD traded in a 0.7385-0.74 range overnight. Resistance at 0.7420/25 has proven to be strong. A clear break above it would then signal a move towards 0.75 though.
Upcoming Events:
- 10:00 BST – Italian CPI
- 13:30 BST – US NY Empire State Manufacturing Index
- 15:00 BST – US NAHB Housing Market Index
The Week Ahead:
Tuesday, May 16th
- 02:30 BST – RBA Meeting Minutes
- 07:45 BST – French CPI
- 09:00 BST – Italian GDP
- 09:30 BST – UK GDP
- 10:00 BST – German ZEW Economic Sentiment
- 10:00 BST – Euro Zone GDP
- 10:00 BST – Euro Zone ZEW Economic Sentiment
- 13:30 BST – US Housing Starts
- 13:30 BST – US Building Permits
- 14:15 BST – US Industrial Production
- 14:15 BST – US Manufacturing Production
Wednesday, May 17th
- 01:30 BST – Australian Westpac Consumer Sentiment
- 09:30 BST – UK Claimant Count Change
- 09:30 BST – UK Unemployment Rate
- 10:00 BST – Euro Zone CPI
- 15:30 BST – US Crude Oil Inventories
Thursday, May 18th
- 00:50 BST – Japanese GDP
- 02:30 BST – Australian Unemployment Rate
- 02:30 BST – Australian Employment Change
- 09:30 BST – UK Retail Sales
- 13:30 BST – US Philadelphia Fed Manufacturing Index
- 15:00 BST – US CB Leading Index
- 18:00 BST – ECB President Draghi speaks
Friday, May 19th
- 07:00 BST – German PPI
- 09:00 BST – Euro Zone Current Account
- 13:30 BST – Canadian CPI
- 13:30 BST – Canadian Retail Sales
- 15:00 BST – Euro Zone Consumer Confidence
Aussie Trading A Tad Higher In The Morning Session
For the 24 hours to 23:00 GMT, the AUD rose 0.3% against the USD and closed at 0.7393 on Friday.
LME Copper prices declined 1.1% or $60.5/MT to $5520.0/MT. Aluminium prices declined 0.4% or $7.0/MT to $1880.0/MT.
In the Asian session, at GMT0300, the pair is trading at 0.7395, with the AUD trading slightly higher against the USD from Friday's close.
Early morning data revealed that Australia's seasonally adjusted home loan approvals unexpectedly eased 0.5% in March, compared to a revised fall of 0.8% in the previous month, while markets were anticipating for a flat reading.
Elsewhere, in China, Australia's largest trading partner, industrial production rose less-than-anticipated by 6.5% YoY in April, compared to an advance of 7.6% in the previous month. Markets participants had envisaged industrial production to rise 7.0%. Moreover, the nation's retail sales climbed less-than-anticipated by 10.7% on an annual basis in April, compared to market consensus for an advance of 10.8%. In the prior month, retail sales had risen 10.9%.
The pair is expected to find support at 0.7368, and a fall through could take it to the next support level of 0.7340. The pair is expected to find its first resistance at 0.7422, and a rise through could take it to the next resistance level of 0.7448.
Looking ahead, investors will look forward to minutes of the Reserve Bank of Australia's (RBA) latest meeting, scheduled to release in the early hours of tomorrow.
The currency pair is trading above its 20 Hr and 50 Hr moving averages.
