Sample Category Title
Greenback Slides As US Data Disappoints
Lacklustre US data puts investors on their toes
The last batch of US data came on the soft side and called into question the actual Fed’s rate path. Indeed, inflationary pressures eased for a third month a row in April with headline CPI printing at 2.2% and the core one, which excludes the most volatile components, moving below the 2% threshold to 1.9%.
April’s retail sales were also weaker than expected as the main measure missed the median forecast of 0.6%m/m to print at 0.4%. Core retail sales rose 0.3% m/m versus 0.5% expected and 0.3% in the previous.Even though the data may just signal a temporary slowdown of the US economy, it definitely ruled out a strong economic rebound in economic activity.
With President Trump’s reforms failing to materialise and weaker than expected inflation, the market is readjusting expectations for the pace of monetary tightening. The entire US treasury yield curve shifted lower on Friday and dragged the greenback down. The dollar index is down 0.66% since Friday and continued to move south on Monday morning.
The single currency and the Swiss franc partially erased last week’s losses and rose 0.75% and 0.83% respectively over the last two trading days. With the June rate hike already priced-in and assuming that Trump’s fiscal plan gets delayed further, we believe that the risk is mostly on the downside for the dollar for now.
SNB’s massive intervention continues
During the French Presidential elections, it was clear that the Swiss National Bank was selling franc to prevent any safe haven effect. Uncertainties regarding the outcome (at least before the first round) drove the Swiss institution to intervene massively.
The Swiss currency is now back on the US Treasury watch of currency manipulators and the Finance Ministry declared that the Central Bank is only trying to limit the overvaluation from the franc and not gain a competitive advantage, which is - in the end - the same thing. It is becoming tougher for the SNB to convince markets about the exact nature of its intervention.
The Swiss foreign exchanges are now larger than the Swiss GBP and today’s total sight deposits have largely increased by 2 billion CHF. We continue to be bullish on the CHF as upside pressures on the currency should continue. Datawise, the trade balance is still largely positive and is even increasing.
Next week, export data for April will be released and they are expected to print at a great + 2.5% m/m (out of inflation) while imports should continue to decline. It is clear that the Swiss economy resists well, which leaves some room for the SNB to intervene.
China see marginal data weakness
Data from China came in on the softer side but after a significantly strong 1Q print. However, there are further indications that growth in China will continue to moderate. Chinese retail sales rose to 10.7% y/y against 10.8% expected, indicating that consumption remains solid. Fixed asset investment increased 8.9% y/y against 9.1% expected while industrial production slipped to 6.5% y/y against 7.0% expected.
Overall, these reads are consistent weaker trade data and softer April manufacturing PMI. While fixed asset growth fell marginally due to weak manufacturing investment, the number remains supportive.
Clearly efforts by China's central regulatory agencies and local governments to tighten policy are working. We view the current slowdown as managed decelerations to combat worries in shadow banking, real estate and local debt financing rather than the start of a broader fall in economic condition. China's Premier Li has continued to state that China will further put into place conservative monetary policy to lower financial risk as the highest priority. Interestingly, this is counter to what we are hearing from the US, where the Trump administration is attempting to hyper-accelerate the US economy with pro-growth policy (despite solid growth and full employment).
We remain optimistic on the China story and see key opportunities in Asian assets. On the FX side we are constructive on EM Asia against JPY as lower interest rates, higher growth, less protectionism risk and general positive risk-taking environments will support the currencies. USDJPY might have peaked failing to break 114.38 on three occasions; suggesting marginal downside corrections; however, JPY has further weakness against regional peers (THB, INR, IDR and KRW).
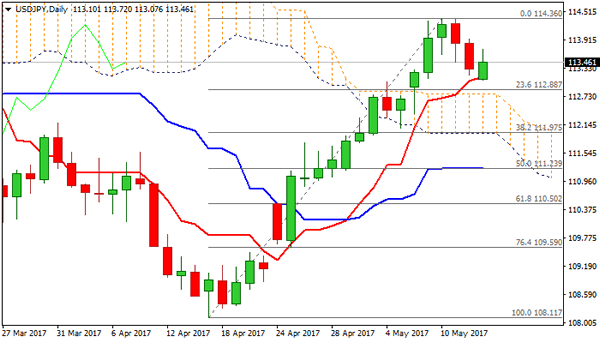
Technical Outlook: USDJPY – Bullish Bias Above 100 SMA/Daily Cloud
Strong two-day pullback from double upside rejection at 114.36 found support at 113.07, being contained by rising daily Tenkan-sen and kept intact key supports at 112.95/78 (100SMA /daily cloud top).
Fresh recovery rally on Monday was so far capped by Fibo barrier at 113.75, but immediate downside risk has been sidelined.
Overall bullish bias is expected to keep focus at the upside while the price holds above 100SMA/daily cloud top supports, with break and close above 113.75 (Fibo 76.4% of 115.49/108.11) seen as supportive factor for renewed attempts above 114.00 barrier and re-test of pivotal barrier at 114.36 (10/11 May peaks).
Conversely, increased risk of stronger correction of 108.11/114.36 rally could be expected on violation of 112.95/79 pivots.
Res: 113.75, 113.93, 114.36, 114.87
Sup: 113.31, 113.07, 112.95, 112.79
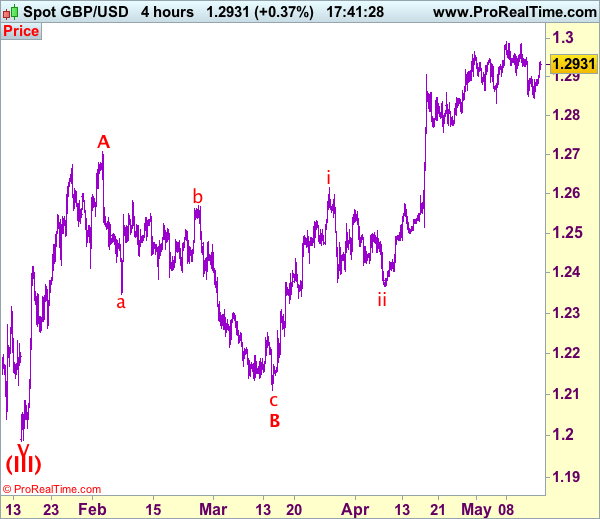
Trade Idea: GBP/USD – Stopped profit and stand aside
GBP/USD – 1.2932
Recent wave: Wave V of larger degree wave (III) has ended at 1.1986 and major correction has commenced from there for gain to 1.3000 and 1.3140-50
Trend: Near term up
Original strategy :
Sold at 1.2955, stopped at 1.2910
Position: - Short at 1.2955
Target: -
Stop: - 1.2910
New strategy :
Stand aside
Position: -
Target: -
Stop:-
Although cable fell marginally to 1.2844, the subsequent stronger-than-expected rebound dampened our bearishness (our short position entered at 1.2955 stopped profit at 1.2910) and near term upside risk remains for test of resistance at 1.2949, however, a sustained breach above there is needed to signal the retreat from 1.2991 has ended, bring retest of this level, break there would extend recent upmove to 1.3040-50 but overbought condition should limit upside to 1.3075-80 and price should falter below 1.3100. We are keeping our view that the wave c as well as larger degree wave B has ended at 1.2109, hence impulsive wave C has commenced from there with wave i of C ended at 1.2616, follow by a correction to 1.2365 (end of wave ii) and wave iii rally is unfolding.
Our preferred count on the daily chart is that cable's rebound from 1.3500 (wave (A) trough) is unfolding as a wave (B) with A ended at 1.7043, followed by triangle wave B and wave C as well as wave (B) has ended at 1.7192, the subsequent selloff is the larger degree wave (C) which is still unfolding with minor wave (III) of larger degree wave 3 ended at 1.1986, hence wave (IV) correction is in progress which could either be a triangle wave (IV) of a complex formation but upside should be limited to 1.3500 and price should falter well below 1.4000, bring another decline in wave (V) of 3 for weakness to 1.1500, then 1.1200.
On the downside, expect pullback to be limited to 1.2890-00 and said support at 1.2844 should remain intact, bring another rebound. Only a break of 1.2844 would revive near term bearishness and signal a temporary top has been formed at 1.2991 earlier, bring retracement of recent rise to 1.2770-75 but previous support at 1.2757 should hold from here.
Europe Seen Higher As Oil Spikes On Output News
European equity markets are expected to open a little higher on Monday, tracking gains throughout most of Asia and buoyed by gains in oil.
Markets boosted by Chinese stimulus plans and oil rally
We've seen moderate gains throughout most of Asia overnight, with the exception of Japan where earlier advances in the yen appear to have weighed on the index. While reports over the weekend of a global cyberattack and another missile launch from North Korea may have prompted some risk aversion this morning, it seems the prospect of substantial infrastructure spending from China and its commitment to free trade is taking priority.
Should we look past the US Q1 soft patch?
Even the softer than expected figures from China overnight are being overlooked, with retail sales, industrial production and fixed asset investment figures all falling short of expectations. Double digit growth in consumer spending remains a positive of the data, given the efforts to move away from a reliance on investment and exports.
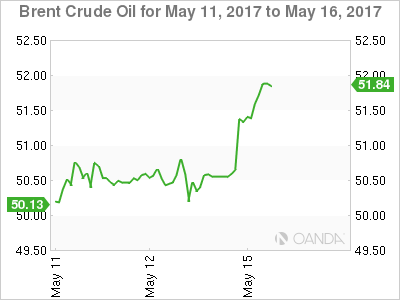
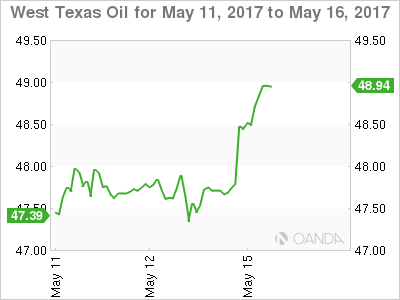
Oil rallies as Russia and Saudi energy ministers support output cut extension
Oil prices are up more than 1.5% in early trade on Monday, boosted by reports over the weekend that energy ministers from Russia and Saudi Arabia support extending production cuts by another nine months to the end of the first quarter of next year.
The two countries – which are responsible for around a fifth of total daily output – are crucial to the success of the cut and I would now expect other participating nations to get behind the extension as well.
Week Ahead Dollar Looking to Regain Momentum
Of course, with the US taking full advantage of higher prices and increasing output rapidly at the same time, attempts to rebalance the oil market have been more difficult than anticipated. With any extension likely to keep prices elevated, it will be interesting to see whether the US can continue to ramp up production on the same scale as it has in recent months. If so, compliance with any new cut and the rebalancing efforts will be severely tested with both Russia and Saudi Arabia not wanting to lose market share in key markets.
Traders look for signs of 'upside news on growth or inflation' in this week's UK data
It's likely to be another relatively quiet week on the data side, with the UK being a particular focus in Europe. Inflation numbers on Tuesday will be followed by the latest labour market figures on Wednesday and retail sales on Thursday, as traders look for evidence of the economy or prices rising faster than expected, given that, in the words of the Bank of England, 'some MPC members would need relatively little upside news on growth or inflation to consider voting for tighter policy'. Should we see signs of this in the coming days, it could offer a boost for sterling as it moves back above 1.29 against the dollar again, with the focus very much on 1.30.
Recap of the BoJ Summary of Opinions – April 2017
The Bank of Japan published last Wednesday, its outlook on the summary of opinions presented at the April 26, 27 monetary policy meeting. The report revealed that BoJ policymakers were cautious on the inflation outlook amid uncertainty in wage growth and weak retail sales.
According to the report, some BoJ officials wanted the central bank to maintain its quantitative easing program in an effort to overcome deflation and to push consumer prices to the central bank's inflation target of 2%.
However, some members also disagreed with this view, noting that the central bank should cut QE purchases while it can without causing too much disturbance in the markets.
BoJ policy makers remain optimistic on inflation
At the April 26 - 27 monetary policy meeting, the Bank of Japan left interest rates unchanged at -0.10% and noted that it remained optimistic of reaching the inflation target of 2% by 2018. The central bank had however lowered the medium term inflation outlook.
A BoJ policy maker was optimistic on inflation noting that the annual inflation rate less fresh food will rise towards the central bank's 2% target rate at a gradual pace. The policy maker said that the upward price pressures in commodity prices would contribute to an increase in consumer prices.
However, the official said that it would "take some time" for inflation to accelerate.
Similar views were echoed by other policy makers who repeated the official line that despite sluggish growth in consumer prices, inflation could accelerate on the back of a continued expansion in the economy and a widening output gap.
BoJ officials said that there was no reason to change the bank's outlook for inflation in the longer term and that they will continue to monitor the price developments accordingly.
While a majority of policy makers remained optimistic on inflation, some members expressed their doubts. One official said that it was difficult to expect inflation to rise sharply during the period.
BoJ governor addresses the parliament
The Bank of Japan's governor Kuroda appeared before the Parliament last week where he remained upbeat on the course of monetary policy. Here are some key points that the BoJ governor spoke about.
On the exchange rate:
On the exchange rate, the BoJ governor told lawmakers about the benefits of a weaker yen for the economy and that he was not worried on the current declines in the exchange rate. "The weak yen has had positive effects on capital investment and employment by increasing profits at export-oriented companies," Kuroda said, although cautioning that a weaker exchange rate puts pressure on household purchasing power while also making imports more expensive.
On the risks of policy tightening:
Kuroda also had some views on a premature exit from the central bank's massive QQE program. He told Japanese lawmakers that a premature exit from the central bank's ultra easy monetary policy could push the central bank into the "red." When pressed by lawmakers whether the central bank will post losses, the BoJ Governor said: "Based on that scenario, that is true." The condition being the BoJ hiking the short term deposit rates while reducing the government bonds and holding them to maturity.
On exchange rate and exports:
The Governor also spoke about the exchange rate and exports and countered the view that Japan preferred a weaker exchange rate to boost exports. Kuroda told lawmakers that as far as trade between U.S. and Japan was concerned, the exchange rate doesn't lead to a sharp increase in the economic growth rate through boosting exports.
Kuroda said this was more applicable to countries such as Germany and South Korea (two other countries that were named by the Trump administration for manipulating the exchange rate to gain a competitive edge in global trade).
The BoJ's summary of opinions and the comments by the BoJ governor evoked mixed responses as the initial optimism that came off the upgraded economic forecasts during the April meeting are starting to fade on the back of renewed doubts among policy makers.
Up ahead, the quarterly GDP numbers from Japan will be released on Thursday.
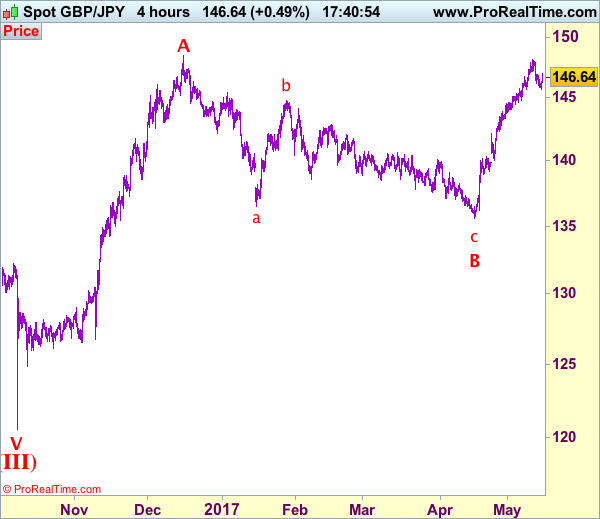
Trade Idea: GBP/JPY – Buy at 144.50
GBP/JPY - 146.70
Recent wave: Medium term low formed at 120.50 and (A)-(B)-(C) major correction has commenced with (A) leg ended at 148.45, hence wave (B) is unfolding for retreat to 131.00-10.
Trend: Near term up
Original strategy:
Buy at 144.50, Target: 146.70, Stop: 143.90
Position: -
Target: -
Stop: -
New strategy :
Buy at 144.50, Target: 146.70, Stop: 143.90
Position: -
Target: -
Stop:-
Although sterling has rebounded after finding support at 145.70 last week and gain to 147.00-10 cannot be ruled out, reckon upside would be limited to 147.75-80 and bring further consolidation below recent high of 148.10, bring another corrective fall later. Below 146.00 would bring test of support at 145.70, break there would bring retracement of recent rise to 145.10-20, however, reckon downside would be limited to 144.40-50 and bring another rise later, above 147.75-80 would signal the pullback from 148.10 has ended, bring retest of this level, break there would extend recent upmove from 135.60 to previous chart resistance at 148.45, then towards 148.90-00 but overbought condition should prevent sharp move beyond 149.50, bring retreat later.
In view of this, would not chase this rise here and would be prudent to buy sterling on subsequent pullback as 144.50-60 should limit downside, bring another rise later. Below said support at 144.00-10 would abort and suggest a temporary top is formed instead, bring correction to 143.50-60 but reckon 143.10-15 would hold from here, bring another rise later.
Our preferred count is that larger degree wave V with circle is unfolding from 251.12 with wave (I) 219.34, (II): 241.38 and wave (III) is subdivided into 1: 192.60, 2: 215.89 (23 Jul 2008) and wave 3 ended at 118.87 earlier in 2009. The correction from there to 162.60 is wave 4 which itself is a double three and is labeled as first a-b-c ended at 151.53, followed by wave x at 139.03, 2nd a ended at 162.60, 2nd b at 146.75 and 2nd c leg of wave 4 ended at 163.00. Therefore, the decline from 163.00 to 116.85 is now treated as wave 5 which also marked the end of larger degree wave (III), hence wave (IV) major correction has commenced for retracement of the wave (III) from 241.38 and upside target at 183.95-00 (50% Fibonacci retracement of the wave (II) from 241.38) had been met, a drop below 160.00 would suggest wave (IV) has ended at 195.85, bring decline in wave (V) for initial weakness to 130 (already met) and 120.
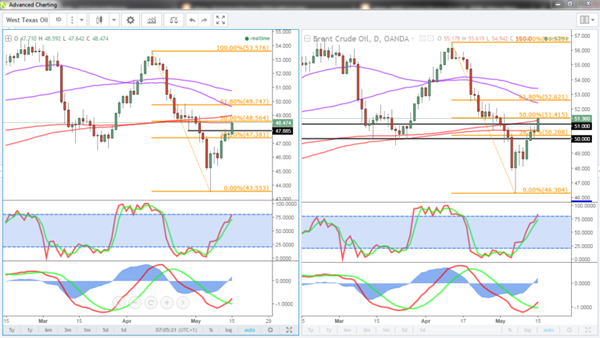
Saudi Arabia And Russia To Do Whatever It Takes
Markets get caught out as the Energy Ministers Saudi Arabia and Russia announce they will extend the OPEC-led output cuts by nine months to March 2018.
In shades of the ECB's Mario Draghi, the energy ministers of Saudi Arabia and Russia announced, in Beijing no less, that they had agreed to do 'whatever it takes' to reduce global oil stockpiles to five-year averages this morning. Taking the big bazooka of the wall, they jointly announced that the OPEC-led production deal would be extended by nine months until March 2018. Also, they hoped that additional producers would join them in cutting when the extension begins in June.
Although the actual meeting for OPEC and NOPEC isn't scheduled until May 25th, the timing of this announcement from the largest producer and the largest exporter (25% of global production between them), was a complete surprise and probably a testament to two things. How worried they are about the rise of U.S. shale's increase, now at 9.3 million barrels per day (BPD), and it's very detrimental effect on their national finances. And two, their determination to take the bull by the horns and set their oil price marker down early. It is perhaps most significant from the Russian side as it took them a tardy three months to even get near their paltry cut allocation of 300,000 BPD this year. Clearly, reality is biting and neither country likes what it sees in the future should the status quo continue.
Both Brent and WTI shot up over 1.60% immediately after the statement and on a spot basis, continue to trade near their day's highs at 51.35 and 48.50 as I write. When cooler heads later in the day look a bit harder, they will probably notice that even extending the deal in its present form will only keep the lights on in reality. With the rise of U.S. shale, Nigeria and Libyan production, the supply deficit globally is only at 200,000 BPD. Hardly likely to bring a cold sweat to oil bears. OPEC's forecasts still rely on global growth increasing to pick up the slack. Nevertheless, the cynic in me aside, the intent is most certainly there, and this should imply firm oil prices into the European session. Looking at the technicals…
Brent
Brent spot has initial resistance at 51.50, its day's high with significant resistance at the 52.50 regions.
It has broken its 200-day moving average at 51.23, which is initial support, with the day's low at 50.50 behind that. A close above the 51.23 this evening would be constructive technically.
WTI
WTI spot's high today at 48.60 is initial resistance. The key level is just above at 49.00 which is a double top and the 200-day moving average. A close above here could imply a test of 50.00 and the 100-day moving average at 51.00.
Support is at the days low around 47.65 and then 47.10.
Summary
Whether this is an act of desperation or a new found solidarity between the two big dogs of global oil, what cannot be doubted is the intent. And that appears to clearly be to make sure crude stays above 50 dollars a barrel. It has created some very constructive price action in both contracts from a technical perspective. Whether this will have longevity into the 2nd half of 2017 will be a story for another day.
Daily Technical Analysis: EURUSD, GBPUSD, USDJPY, USDCHF
EURUSD
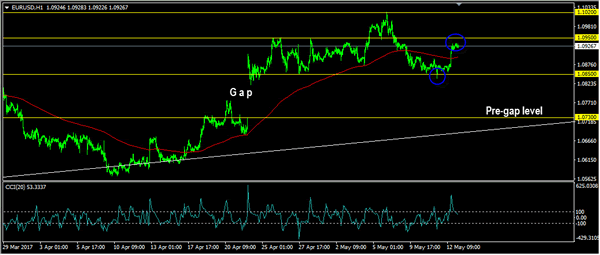
The EURUSD attempted to push lower last week slipped below 1.0850 key support but closed higher at 1.0931. The bias is bullish in nearest term testing 1.0950. A clear break above that area would expose 1.1020 region. Immediate support is seen around 1.0900. A clear break below that area could lead price to neutral zone in nearest term retesting 1.0850 key support which remains a good place to buy with a tight stop loss as a clear break and daily close below that area would expose the pre-gap level at 1.0730. Overall I remain neutral.
GBPUSD
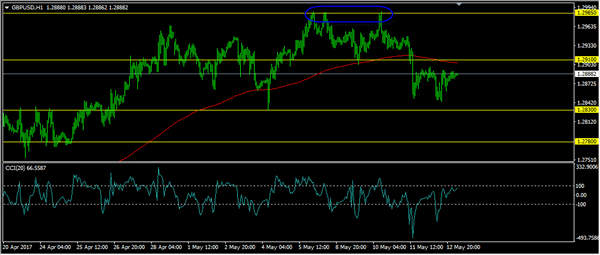
The GBPUSD had a bearish momentum last week bottomed at 1.2844 after formed a triple top formation as you can see on my H1 chart below. The bias is bearish in nearest term testing 1.2830. A clear break and daily close below that area would expose 1.2780 which is a good place to buy with a tight stop loss. Overall I remain bullish. Immediate resistance is seen around 1.2910. A clear break above that area could lead price to neutral zone in nearest term retesting 1.2985 region.
USDJPY
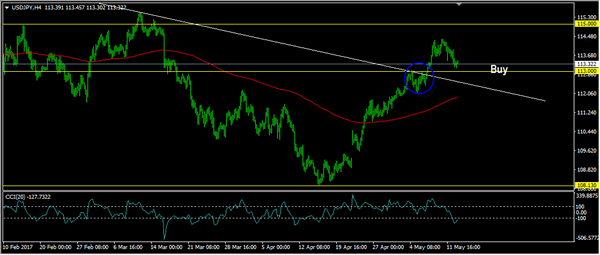
The USDJPY attempted to push higher last week topped at 114.36 but closed lower at 113.34. The bias is neutral in nearest term probably with a little bearish bias testing 113.00 area which is a good place to buy with a tight stop loss targeting 115.00. Immediate resistance is seen around 113.50. A clear break above that area could trigger further bullish pressure testing 114.00/35 area. Overall I still prefer a bullish scenario but a clear break and daily close back below 113.00 would activate my wait and see mode as direction would become unclear.
USDCHF
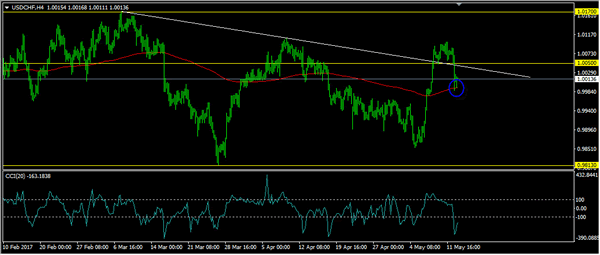
The USDCHF had a bullish momentum last week slipped above the trend line resistance but closed back below the trend line resistance as you can see on my H4 chart below. The H4 EMA 200 (located around 0.9990) still provides a good support so far. The bias is neutral in nearest term. Immediate resistance is seen around 1.0050. A clear break above that area could trigger further bullish pressure testing 1.0085 or higher. On the downside, a clear break below 0.9990 would expose 0.9950/00 region. Overall I remain neutral.
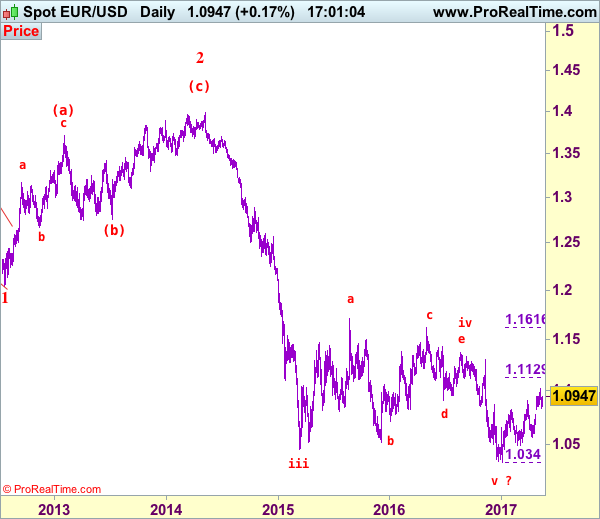
EUR/USD Elliott Wave Analysis
EUR/USD – 1.0952
EUR/USD: Wave (c) of 2 ended at 1.3993 and wave 3 of III has commenced for weakness to 1.0411 (1.236 of wave 1), then 1.0000.
As the single currency retreated after meeting resistance at 1.1025 last week, suggesting consolidation below this level would be seen and pullback to 1.0820-25 cannot be ruled out, however, reckon downside would be limited to previous resistance at 1.0778 and bring another rise later, above said resistance at would extend the erratic rise from 1.0340 (tentatively wave v of larger defer wave 3) low to 1.1050 but reckon upside would be limited to 1.1125-30 (61.8% Fibonacci retracement of 1.1616-1.0340) and price should falter well below strong resistance at 1.1300, bring retreat later.
Our preferred count on the daily chart remains that a wave (II) from 1.2329 ended at 1.5145 with A-leg ended at 1.4720, followed by wave B at 1.2457, the wave C from there was also a 3 legged move and is labeled as (a): 1.3739, (b): 1.2885, the wave iii of the 5-waver (c) from 1.2885 has ended at 1.4339 and wave iv is a triangle ended at 1.3878 and wave v formed a top at 1.5145. The decline from there is a 5-waver (C) with minor wave (i) of I of (C) ended at 1.4218 with wave (ii) ended at 1.4580, wave (iii) ended at 1.3267 and wave (iv) ended at 1.3692 and wave (v) ended at 1.1876, this is also the low of wave I of (C) and wave II ended at 1.4940, hence wave III is now in progress with a diagonal wave 1 ended at 1.2042, the breach of previous support at 1.1876 (wave I trough) adds credence to our view that the wave 2 has ended at 1.3993, wave 3 has commenced for further weakness to 1.0411, then towards 1.0000.
On the downside, although initial pullback to 1.0820-25 cannot be ruled out, reckon previous resistance at 1.0778 (now support) would limit downside and bring another rise later. A daily close below previous resistance at 1.0778 would defer and risk weakness to 1.0735-40, break there would signal top is formed, bring test of support at 1.0678-82 first but downside should be limited to 1.0602 support and key level at 1.0570 should remain intact.
Recommendation: Buy at 1.0780 for 1.0980 with stop below 1.0680.
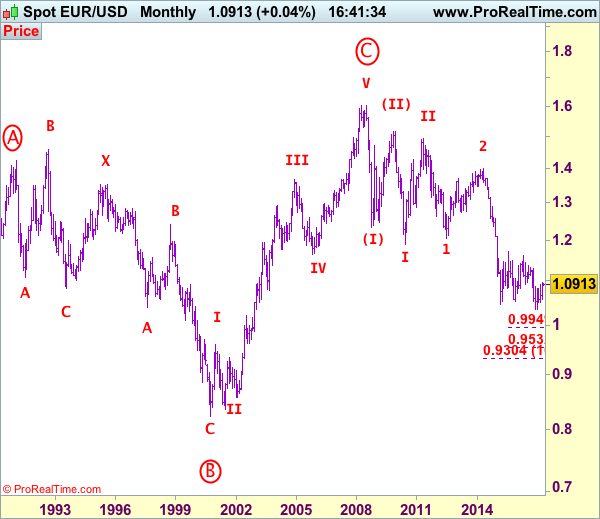
Euro's long-term uptrend started from 0.8228 (26 Oct 2000) with an impulsive structure. The rise from 0.8228 to 0.9593 (5 Jan 2001) is labeled as wave I, the retreat to 0.8352 (6 Jul 2001) is wave II and the rally to 1.3670 (31 Dec 2004) is wave III. Wave IV from there ended at 1.1640 (15 Nov 2005), the subsequent upmove to 1.6040 (July 15, 2008) is treated as wave V, the major selloff from the record high of 1.6040 to 1.2329 (October 27, 2008) signals a reversal has taken place with (I) leg ended at 1.2329 and once (II) ended at 1.5145, wave (III) itself is an extended move with I: 1.1876 and complex wave II ended at 1.4902, wave III has commenced with wave 1 and 2 ended at 1.2042 and 1.3993 respectively, wave 3 of III is now unfolding for weakness towards parity.
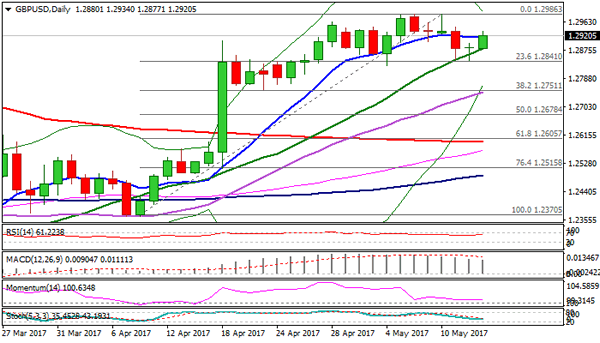
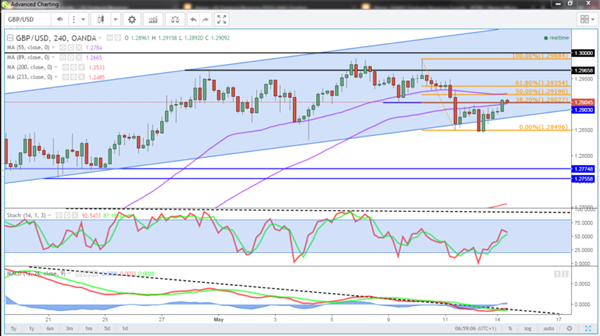
Technical Outlook: Cable – Fresh Rally Sidelines Downside Risk, UK Data Due This Week May Provide Firmer Direction Signal
Cable regained traction and bounced on Monday after completing Morning Doji Star reversal pattern. Three day pullback that followed repeated rejection at psychological 1.3000 barrier, found footstep above pivotal support at 1.2830 (04 May low) and subsequent bullish acceleration sidelined growing downside risk seen on loss of 1.2830 trigger. Fresh rally that broke above pivotal barrier at 1.2914 (10SMA) brings daily MA's back to full bullish configuration and turns near-term focus towards 1.3000 barrier. Additional support was provided by bullish near-term studies, as Monday's rally surged through thick hourly cloud (spanned between 1.2888 and 1.2917) which now acts as initial support. However, larger picture shows the pair in extended directionless mode, entrenched within 1.2840 and 1.3000 range, with break of either range boundary required to generate fresh direction signal. The pair is eyeing release of a batch of UK data due in coming days for clearer signals. UK CPI data are due on Tuesday and inflation is expected to pick up in April, according to the forecast for annualized CPI at 2.6% compared to 2.3% in March. UK jobs data are due on Wednesday with unemployment expected to stay unchanged at 4.7% in April, but jobless claims are forecasted to fall significantly (5.0K in Apr vs 25.5K in Mar) and Average earnings seen increasing in March, according to the forecast at 2.4% vs 2.3% in Feb. Figures at or above forecasted level would provide fresh support to sterling for final push through 1.3000 pivot, while alternative scenario sees increased downside risk for deeper pullback on downbeat UK data.
Res: 1.2946; 1.2986; 1.3000; 1.3032
Sup: 1.2914; 1.2877; 1.2843; 1.2830