Sample Category Title
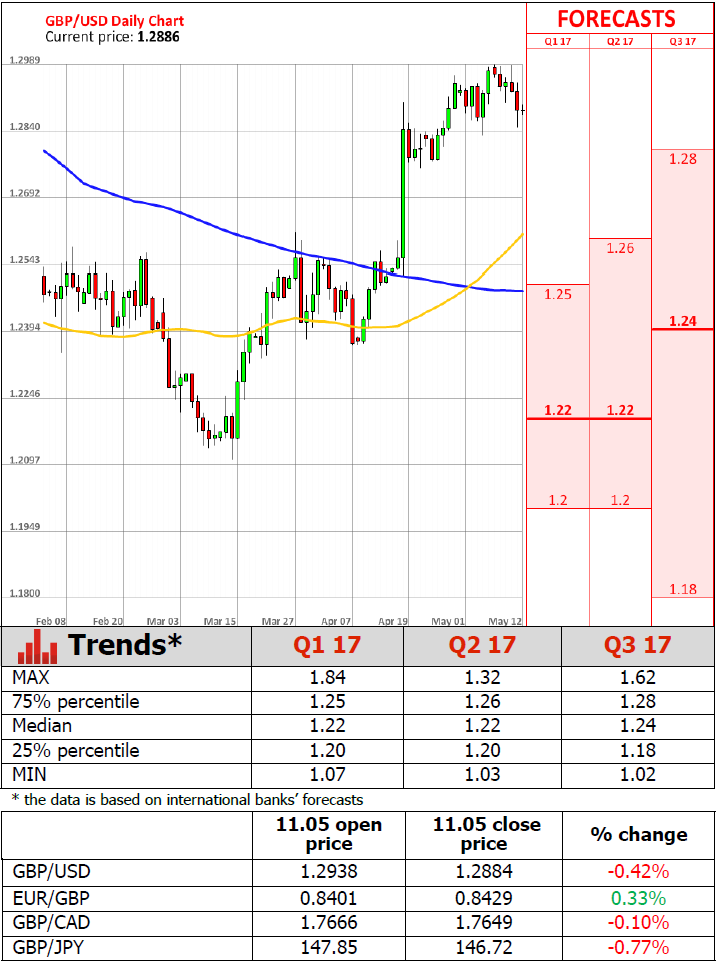
GBP/USD Analysis: Continues To Consolidate
'Altogether we remain constructive on GBP and remain long via a basket of USD, EUR and AUD. We remove EUR/GBP upside from our 2017 forecasts and expect GBP/USD to test 1.37 by year-end.' – Nomura (based on FXStreet)
Pair's Outlook
The GBP/USD currency pair underwent another decline on Thursday, driven mostly by weak fundamental data from the UK. However, the decline helped to prolong the consolidation trend, which began three weeks ago. It is yet uncertain whether the 1.28 or the 1.2850 level is the trend's lower boundary, but the 1.30 mark is representing the upper one. As a result, the Cable still has room for another leg down, despite being supported by the weekly S1 and the 20-day SMA demand cluster just under today's opening price. Meanwhile, technical indicators keep insisting that a positive development is due, but that is possible only if the US inflation data disappoints today.
Traders' Sentiment
Traders retain a neutral outlook, with 51% of all open positions still being short. The number of sell orders inched up from 51 to 56%.
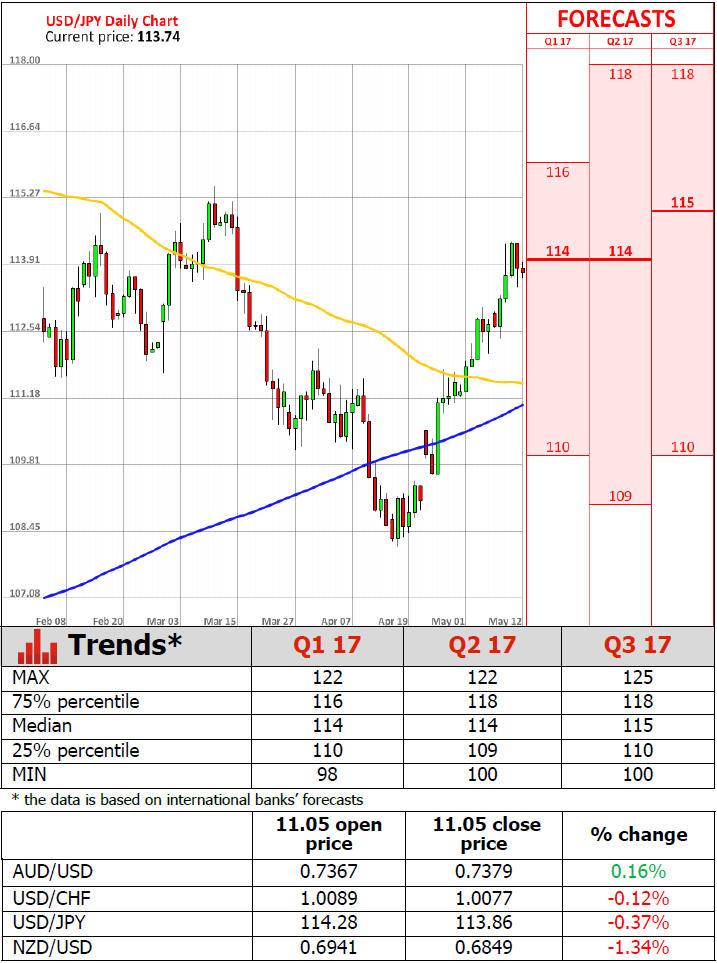
USD/JPY Analysis: Muted Ahead Of Inflation Data
'And unfortunately for yen bulls, the weaker yen hasn't led to a pickup in Japanese exports. Until this happens, the yen will likely continue to weaken.' – Marc Chandler, BBH (based on Market Watch)
Pair's Outlook
Despite strong second class US fundamentals yesterday, the Greenback failed to outperform the Yen, due to a drop in yields and stocks. Consequently, the exchange rate fell back under the 114.00 major level, while also putting the second support level, namely the weekly R1, to the test. Downside risks persist today as well, with key inflation data eyed. Disappointment could lead to another significant drop, with the main target being the 113.00 handle, where the 100-day SMA and the monthly R1 rest. On the other hand, technical indicators imply the USD/JPY pair is to edge higher again, in which case the 114.40 mark is still likely to limit the possible gains.
Traders' Sentiment
Traders' sentiment remains bearish at 65%, whereas 55% of all pending orders are to purchase the Buck (previously 51%).
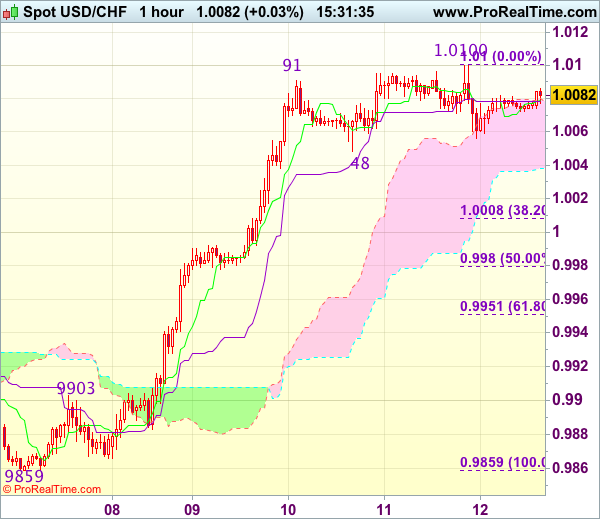
Trade Idea : USD/CHF – Buy at 1.0015
USD/CHF - 1.0077
Most recent candlesticks pattern : N/A
Trend : Near term up
Tenkan-Sen level : 1.0079
Kijun-Sen level : 1.0078
Ichimoku cloud top : 1.0079
Ichimoku cloud bottom : 1.0039
Original strategy :
Buy at 1.0015, Target: 1.0115, Stop: 0.9980
Position : -
Target : -
Stop : -
New strategy :
Buy at 1.0015, Target: 1.0115, Stop: 0.9980
Position : -
Target : -
Stop : -
Dollar’s retreat after marginal rise to 1.0100 yesterday suggests minor consolidation below this level would be seen and pullback to support at 1.0048 cannot be ruled out, however, reckon downside would be limited to 1.0005-10 (38.2% Fibonacci retracement of 0.9859-1.0100) and bring another rise later, above said resistance at 1.0100 would extend recent rise to previous resistance at 1.0108, break there would confirm and extend rise to 1.0130 and then 1.0150-55.
In view of this, would not chase this rise here and we are looking to buy dollar on pullback as 1.0000-10 should limit downside. Below 0.9980 (50% Fibonacci retracement of 0.9859-1.0100) would defer and suggest top is possibly formed but break of previous resistance at 0.9957 is needed to signal top is formed, bring further fall to 0.9920-25, however, previous resistance at 0.9903 should remain intact.
Technical Outlook: Cable Remains In Red After BoE, US Data In Focus
Cable remains at the back foot on Friday after BoE's minutes and weaker than expected UK disappointed traders. The pair is holding just above Thursday's low at 1.2847, being under pressure on weak near-term technicals and rising downside risk after multiple rejection ahead of psychological 1.3000 barrier.
Break below 20SMA at 1.2862, would open 1.2830 (04 May trough), loss of which would generate stronger bearish signal and expose pivotal support at 1.2751 (Fibo 38.2% of 1.2370/1.2986 upleg).
US CPI and Retail Sales data, due later today, are in focus for firmer direction signals, as forecasts are positive and releases at/above would boost the greenback and send pound into deeper correction.
Res: 1.2911, 1.2946, 1.2986, 1.3000
Sup: 1.2847, 1.2830, 1.2770, 1.2750
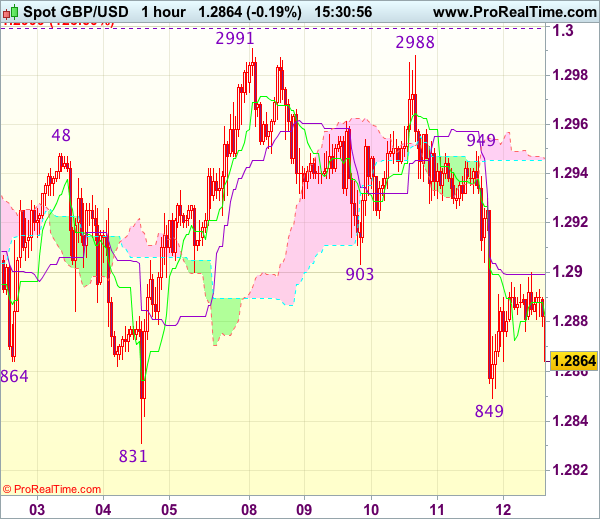
Trade Idea : GBP/USD – Hold short entered at 1.2900
GBP/USD - 1.2863
Most recent candlesticks pattern : N/A
Trend : Near term up
Tenkan-Sen level : 1.2877
Kijun-Sen level : 1.2899
Ichimoku cloud top : 1.2946
Ichimoku cloud bottom : 1.2946
Original strategy :
Sold at 1.2900, Target: 1.2800, Stop: 1.2935
Position : - Short at 1.2900
Target : - 1.2800
Stop : - 1.2935
New strategy :
Hold short entered at 1.2900, Target: 1.2800, Stop: 1.2935
Position : - Short at 1.2900
Target : - 1.2800
Stop : - 1.2935
As cable has remained under pressure after dropping sharply yesterday, adding credence to our bearish view that top is formed at 1.2991 earlier and consolidation with downside bias remains for further fall to 1.2831 support, break there would provide confirmation and extend the fall from 1.2991 top to 1.2805 and later towards 1.2770 but reckon previous support at 1.2757 would hold from here.
In view of this, we are holding on to our short position entered at 1.2900Above 1.2925-30 would risk test of 1.2950-60 but break there is needed to signal low is formed, bring another bounce towards 1.2988-91 resistance but break of 1.2999-00 (1.236 times projection of 1.2109-1.2616 measuring from 1.2365 and psychological resistance) is needed to revive bullishness.
BoE Leaves Its Bank Rate At 0.25%, Maintains Bond Purchases At £435B
'The medium-term inflation forecast is lower and that's why markets have taken it as dovish.' — Alan Clarke, Scotiabank
At its latest policy meeting, the Bank of England's Monetary Policy Committee voted by a majority of 7-1 to leave the bank rate at 0.25%, with Kristin Forbes being the only one favouring an immediate hike in rates on the back of an uptick in pipeline inflation pressures that, in her opinion, has pushed the CPI to somewhat uncomfortable levels. Overall, the 'no move' came as no surprise, as the vast majority of economists were not expecting to see any change in the monetary policy. In the report, the BoE said that sustainability of the current loose policy would to a great extent depend on inflation expectations holding steady. Despite that, some of the MPC members commented they would give up their dovish stance relatively soon should they see any signs of an upside momentum establishing in GDP or inflation. In the meantime, the British Central Bank also decided to maintain its government bond-purchase programme at £435B, while holding corporate bond-buying plans at up to £10B. Furthermore, there also were some alterations to the Bank's UK economic forecasts, with officials slashing their 2017 growth outlook to 1.9% from 2%.
US Producer Prices Increase Above Expectations In April
'April's PPI report underlined this with a strong set of data that suggests that input costs are rising at the fastest rate in five years.' - Michael Shaoul, Marketfield Asset Management
The seasonally adjusted Producer Price Index for final demand rose more than expected in April, official data showed on Thursday. According to the Bureau of Labour Statistics, US producer prices rose 0.5% for the month of April, following the preceding month's 0.1% decline and surpassing analysts' expectations for a 0.2% hike. On a yearly basis, the Producer Price Index posted a gain of 2.5% in the reported month, the strongest increase since February 2012, compared to 2.3% registered in March. A 0.4% advance in prices for final demand services caused over 60% of the rise in the final demand PPI. That climb was mainly driven by higher costs of investment advice, dealing, securities brokerage and related services. Furthermore, the report showed prices for goods and food rose 0.5% and 0.9% respectively, while energy prices climbed 0.8%, supported by a 3.9% jump in the gasoline cost. In the meantime, the so-called core PPI, which excludes volatile items, showed a monthly advance of 0.4% and a 1.9% gain year-over-year with both readings going beyond economists' forecasts.
Trade Idea : EUR/USD – Sell at 1.0955
EUR/USD - 1.0860
Most recent candlesticks pattern : N/A
Trend : Near term down
Tenkan-Sen level : 1.0865
Kijun-Sen level : 1.0866
Ichimoku cloud top : 1.0894
Ichimoku cloud bottom : 1.0874
Original strategy :
Sell at 1.0955, Target: 1.0840, Stop: 1.0990
Position : -
Target : -
Stop : -
New strategy :
Sell at 1.0955, Target: 1.0840, Stop: 1.0990
Position : -
Target : -
Stop : -
Euro’s recovery after falling briefly to 1.0839 yesterday suggests consolidation above this level would be seen and corrective bounce to 1.0895-00 is likely, however, reckon upside would be limited to 1.0930-35 and renewed selling interest should emerge around 1.0955-60, bring another decline later. A break of said support at 1.0839 would extend the fall from 1.1025 top for at least a strong retracement of early upmove towards 1.0800 but reckon 1.0770-75 would hold from here.
In view of this, we are looking to sell euro on recovery as 1.0955-60 should limit upside. Above 1.0970 would defer and risk a stronger rebound but a break above resistance at 1.0997 is needed to signal pullback from 1.1025 has ended, bring retest of this level later.
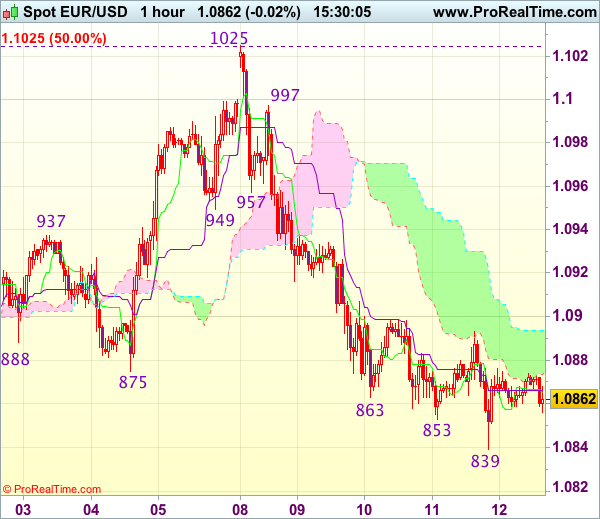
Technical Outlook: EURUSD – Downside Remains At Risk While 10 SMA Caps Recovery Attempts
Double long-legged Doji candles of past two days signal that bear-leg from 1.1020 peak may be losing traction, as fall was contained by rising 20SMA at 1.0838, which underpins today's action after forming bull-cross with 200SMA.
Another supportive factor could be reversal of slow stochastic from oversold zone, however, recovery attempts were so far capped by hourly cloud base (cloud is spanned between 1.0870 and 1.0892).
The pair needs to break above 10SMA (currently at 1.0906) to signal stronger recovery and sideline existing downside risk.
Otherwise, fresh attempts lower could be expected after consolidation, with extension below 200SMA (1.0824) to threaten of filling the gap of 24 Apr and open way for further downside.
The pair on track for weekly close in red and forming weekly bearish engulfing pattern that is seen as strong bearish signal.
Res: 1.0870, 1.0892, 1.0906, 1.0932
Sup: 1.0852, 1.0838, 1.0824, 1.0794
US Dollar Looking Weaker Into Friday’s Close
Economic data from the US continued to remain robust with the initial jobless claims declining to 236,000 for the week ending May 6 while the producer prices rose 0.5% on the month. The markets will be looking to today's consumer price index data. The US dollar was seen rather muted as the US dollar index struggled near the 95.50 resistance level.
In the UK, the Bank of England's monetary policy meeting saw no chance to interest rates and asset purchase. In the inflation forecasts, the central bank expected inflation to overshoot the central bank's target rate and remain around 2.7% this year while growth is expected to show a 0.4% increase in the second quarter.
The British pound was trading weaker on the day with the BoE's meeting and the weak economic numbers released earlier that showed a contraction in manufacturing, construction, and industrial output.
Looking ahead, FOMC members Harker and Evans are due to speak later today while the U.S. will be reporting the monthly CPI and retail sales numbers.
EURUSD intraday analysis
EURUSD (1.0866): EURUSD formed another doji yesterday posting a new one-month low at 1.0838. The price action indicates that the momentum is likely to be slowing and we could expect to see some upside retracement today. 1.0900 remains the key resistance level to the upside
Price action as remained steady near the support level of 1.0863 - 1.0854 and we could expect to see prices bounce off to the upside in the near term. However, resistance is likely to form at 1.0900 - 1.0950. This level also sits close to the 38.2 and 61.8% Fibonacci levels measuring the current decline. A reversal on this pullback will signal a continuation to the downside.
GBPUSD intraday analysis
GBPUSD (1.2885): The British pound slipped yesterday following a weak set of construction, manufacturing and industrial production numbers with the Bank of England's meeting offering little support for the British pound.
However, the GBPUSD looks resilient, and unless we see a close below 1.2800, there is a scope of prices to remain consolidating at the current levels.
Furthermore, the reversal just below 1.3000 handle without the level being tested correctly infers that there is a risk of prices pulling back higher to test this level. For the moment, after the break down below 1.2900, GBPUSD is seen pushing back higher, and an intraday close above this level will signal that prices will consolidate within 1.2900 and 1.2965 levels.
USDJPY intraday analysis
USDJPY (113.74): The US dollar closed on a bearish note yesterday which comes after five straight days of gains. This possibly hints at a short-term correction in prices which could see a test towards 112.50 - 112.875 support level.
On the 4-hour chart, price action has been consolidating near the resistance level of 114.00 - 113.78 region with the previous 4-hour session closing in a doji. A bearish close on the current 4-hour session after the doji could signal a correction towards 112.875 - 112.50 level which could be a strong support level and marks a short-term correction in prices.