Sample Category Title
US Uncertainties To Take Center Stage, WTI Bounces Back
Do not get carried away by oil's dead cat bounce
After falling as much as 20% in the second half of April, crude oil is making a comeback as the West Texas Intermediate bounced back at around $48 a barrel, up roughly 3% over the week. After the decision of OPEC and its allies to cut supply back in November last year, investors entered into a wait-and-see mode and took their time to assess the effectiveness of the OPEC decision. The market's enthusiasm was only short-lived but the WTI stabilised at between $48 and $55, during the first quarter at least.
It is quite clear that OPEC is always a trifle late. A few years ago the Cartel, realising that the US shale industry could jeopardise its dominant position in the oil business, tried to nip them in the bud by flooding the market with cheap oil. This move stopped any new investments in upstream exploration and killed the momentum of the US shale industry. However, the move came quite late as North America's frackers were already too efficient and were able to lower their break-even price well below $50 a barrel.
The problem now, is that OPEC countries are struggling with cheap oil prices, even though their breakeven prices are much lower (around $20 a barrel for Saudi Arabia, for example), as they need a higher price to balance their state budgets. To lift prices, OPEC trimmed production last year and members are currently discussing to extend the cut. Unfortunately for OPEC and its allies, the US shale industry, which does not participate to the cut, is the primary beneficiary of those production cuts. Indeed, the higher the price, the higher the number of profitable US wells.
Against such a backdrop of supply glut and subdued demand, we believe that the recovery in oil prices is quite limited, especially given the current set-up. The cartel has to cut production more aggressively and for longer if it wants to lift prices substantially. Only in the latter case, may we see WTI above $55 a barrel, but again, the primary beneficiary will be the US shale industry.
Focus is back on uncertainties in the US
Just when the President Trump-trade was gaining traction on the congressional passage of the Healthcare bill, new uncertainty threatens to derail the driver. Trump's poor-timing firing of FBI head James Comey has unleased fresh unease within the administration and will challenge his enacting critical pro-growth tax reform. Interestingly, the US and China trade deal reached overnight failed to gather much market positive reaction. At this point markets are unconcerned as volatility continues to contract. However, given the overstretched valuation it would not take much to shift investors' sentiment bearish.
This trigger and with a pause on scheduled risk events (UK parliamentary elections anticipating a landside Conservative victory and Fed 25bp rate hike fully priced in), sustained low volatility will further push investors into yield chasing, powering the already robust carry trade. We see upside for EM growth outlook above 4.5%, so a bit of support from commodity prices will give EM another strong bound. For today, US economic data will further support USD buying. Recent US data has been surprisingly solid followed by hawkish Fed comments and has pushed US yields higher. Markets expect headline CPI to increase by 0.2% m/m in April, which converts into annual inflation of 2.3%. Excluding energy and food prices, we think core CPI inflation will ease back to 0.2% m/m and annual 2.0% (flowing a fall for -0.1% in March).
We suspect that the reversal of inflation decline will keep pressure on the Fed to hike two or possibly three times in 2017. Given this scenario, we believe the market is still underpriced and should give short-end rates a boost. Higher front-end yield also equates in our mind to earlier discussions on strategies for reducing the Fed balance sheet (indirect tightening).
Retails sales will also be released, after slowing in 1Q February and the March headline fell 0.2% m/m consecutively, driven by weak sales in the auto sector. However, rebound in ISM non-manufacturing indicates that we should see a bounce. We anticipate that April headline retail sales will increase 0.6%. In addition, the markets will get business inventories and University of Michigan consumer sentiment.
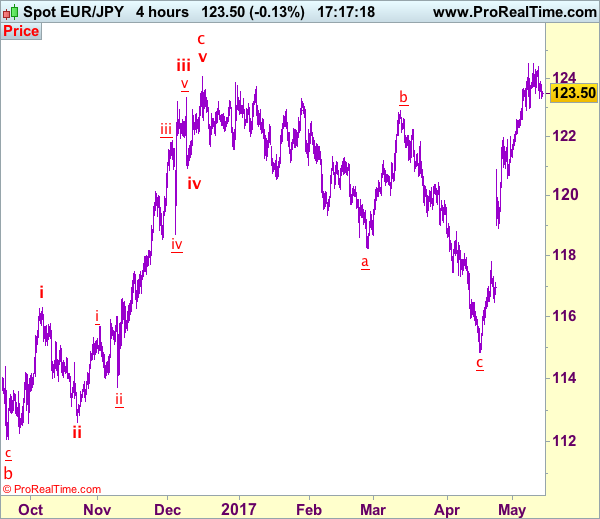
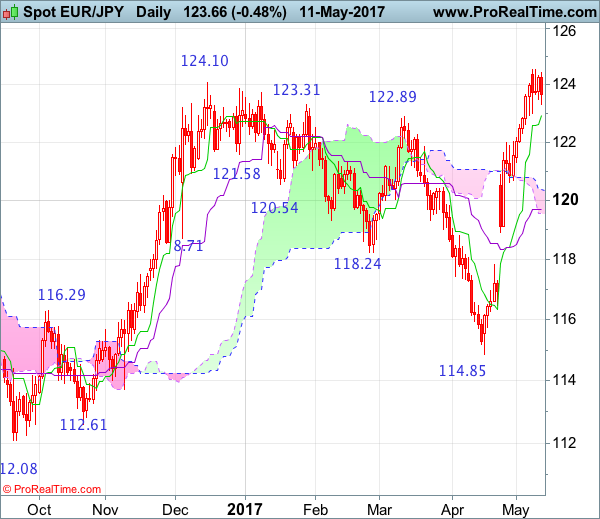
Trade Idea: EUR/JPY – Hold short entered at 124.00
EUR/JPY - 123.54
Recent wave: wave v of (C) ended at 94.12 and major correction in wave A has ended at 149.79
Trend: Near term up
Original strategy:
Sold at 124.00, Target: 122.20, Stop: 124.55
Position: - Short at 124.00
Target: - 122.20
Stop: - 124.55
New strategy :
Hold short entered at 124.00, Target: 122.20, Stop: 124.55
Position: - Short at 124.00
Target: - 122.20
Stop:- 124.55
As the single currency has retreated again after faltering below indicated resistance at 124.55, retaining our view that further consolidation would take place and as long as said resistance holds, mild downside bias remains for a test of support at 122.92-98, break there would suggest a temporary top is possibly formed, bring further fall to 122.60 but break of 122.00-10 is needed to add credence to this view, bring retracement of recent upmove to 121.50 first.
In view of this, we are holding on to our short position entered at 124.00. Above said resistance at 124.55 would abort and signal recent upmove is still in progress and may extend further gain towards 125.00 level but loss of upward momentum should prevent sharp move beyond 125.40-50, risk from there is seen for another retreat later.
Our latest preferred count is that wave (ii) is ABC-X-ABC which ended at 123.33 and wave (iii) is unfolding with wave iii ended at 100.77, followed by wave iv at 111.57 and wave v as well as the wave (iii) has ended at 97.04, followed by wave (iv) at 111.43 and wave (v) has ended at 94.12 which is also the end of the larger degree v, this also implied the major wave (C) has also ended there, hence major correction has commenced from there with (A) leg unfolding in its lower degree wave c which has possibly ended at 145.69. Under this count, A-B-C wave (B) has commenced with A leg ended at 136.23, wave B at 143.79 and wave C has possibly ended at 149.79.
Our larger degree count is that the decline from 139.26 is wave (C) and is sub-divided into a diagonal triangle i-ii-iii-iv-v with wave i - 105.44, wave ii- 123.33, wave iii - 97.03, wave iv - 111.43, followed by the final wave v as well as the end of wave (C) at 94.12, this also mark the bottom of larger degree wave B. Under this count, major rise in wave C has commenced as an impulsive wave with minor wave III ended at 145.69, wave V is still in progress for further gain to 150.00. Having said that, this so-called wave V could well be the first leg of larger degree 5-waver wave C and this wave C should bring at least a retest of wave A top at 169.97 (July 2008).
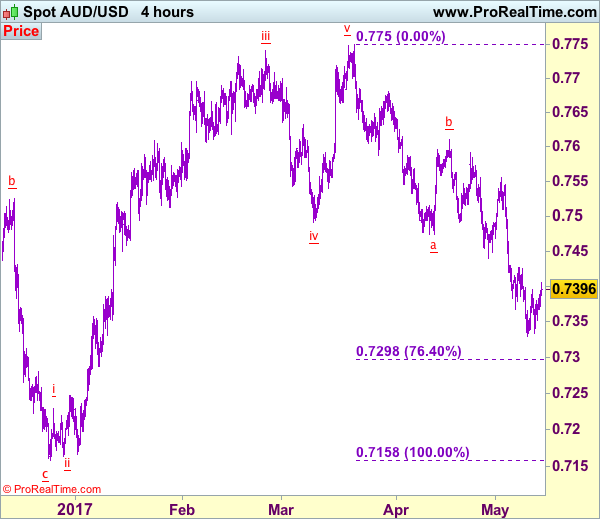
Trade Idea: AUD/USD – Buy at 0.7300
AUD/USD – 0.7395
Recent wave: Wave 5 ended at 1.1081 and major correction has commenced for fall to 0.7000 and then towards 0.6500-10
Trend: Near term down
Original strategy :
Buy at 0.7300, Target: 0.7500, Stop: 0.7240
Position: -
Target: -
Stop: -
New strategy :
Buy at 0.7300, Target: 0.7500, Stop: 0.7240
Position: -
Target: -
Stop:-
Although aussie has rebounded again after holding above support at 0.7329 (this week’s low) and minor consolidation above this level would be seen, reckon 0.7425-30 would limit upside and bring another decline later, below said support at 0.7329 would extend one more fall to 0.7295-00 (76.4% retracement of 0.7158-0.7750), however, loss of downward momentum should prevent sharp fall below there and bring rebound later, above 0.7425-30 would bring subsequent gain to 0.7490-00 but break of 0.7510 is needed to signal low is formed, then test of resistance at 0.7556 would follow.
In view of this, we are inclined to turn long on next decline. Below 0.7245-50 would risk weakness to 0.7200-10, however, reckon previous support 0.7158 would contain downside and aussie may stage another strong rebound from there later this week.
On the 4-hour chart, the move from 0.8066 is the wave 5 with i: 0.8860, ii: 0.8315, wave iii is an extended move ended at 1.0183, iv: 0.9706 and wave v has ended at 1.1081 (also the top of entire wave 5). The subsequent selloff is the major correction which is unfolding as ABC-X-ABC and 2nd A leg has ended at 0.8848, followed by a-b-c wave B which ended at 0.9758, hence, 2nd C wave is now in progress and indicated downside target at 0.7000 and 0.6950 had been met, so further fall to 0.6710-20 cannot be ruled out.
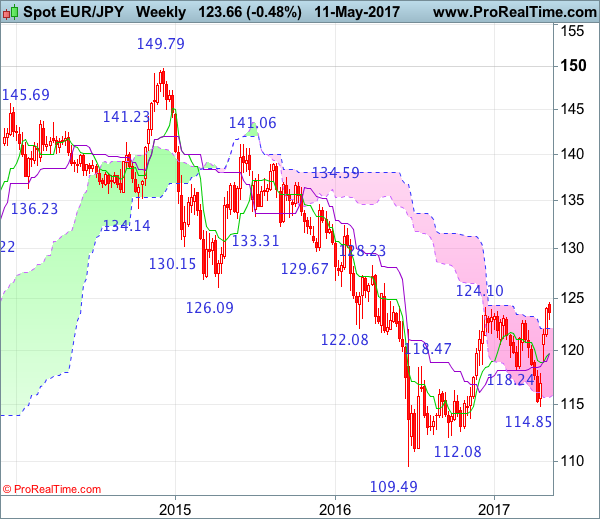
EUR/JPY Candlesticks and Ichimoku Analysis
Weekly
• Last Candlesticks pattern: Hammer
• Time of formation: 19 Sep 2016
• Trend bias: Down
Daily
• Last Candlesticks pattern: Doji
• Time of formation: 28 Mar 2017
• Trend bias: Near term up
EUR/JPY – 123.12
As the single currency has eased after rising to 124.55 late last week, suggesting minor consolidation below this level would be seen and pullback to 122.95-00 cannot be ruled out, however, reckon downside would be limited to 122.30-35 and bring another rise later, above said resistance at 124.55 would extend early upmove from 109.49 low for headway to 125.00 and then 125.25-30 (50% Fibonacci retracement of 141.06-109.49) but reckon upside would be limited to 125.90-00, risk from there is seen for a retreat to take place soon due to overbought condition.
On the downside, whilst initial pullback to 122.90-00 cannot be ruled out, reckon downside would be limited to 122.30-35 and bring another upmove later to aforesaid upside targets. Below previous resistance at 121.98 would defer and suggest a temporary top is possibly formed, risk correction to 121.35-40 and then 121.00, however, reckon support at 120.60 would contain weakness and bring another rise later. Only a drop below support at 120.60 would confirm top formation, bring correction of recent upmove to 120.00 but downside should be limited to the Kijun-Sen (now at 119.70) and price should stay well above indicated support at 118.92, bring rebound later.
Recommendation: Buy at 122.00 for 124.50 with stop below 121.00.
On the weekly chart, the single currency has maintained a firm undertone after breaking previous resistance at 124.10 last week, adding credence to our view that the erratic rise from 109.49 has resumed, hence bullishness remains for this move to bring retracement of medium term downtrend to 124.85-90 (38.2% Fibonacci retracement of 149.79-109.49), then 125.25-30 (50% Fibonacci retracement of 141.06-109.49) but reckon upside would be limited to 126.00 and 126.45-50 would hold from here, bring retreat later.
On the downside, although initial pullback to the upper Kumo (now at 122.04) cannot be ruled out, reckon downside would be limited to 121.50 and bring another rise. Only below support at 120.60 would defer and risk weakness to 120.00 but reckon the Tenkan-Sen (now at 119.70) would limit downside and support at 118.92 should hold, bring another rebound later. A drop below 118.92 would shift risk to downside for further fall to 118.00, however, downside should be limited to previous resistance at 117.82 and bring rebound later. A weekly close below 117.82 would suggest first leg of rebound from 114.85 has ended, bring weakness to 117.00 but price should stay above 116.20-25, bring another rebound later.
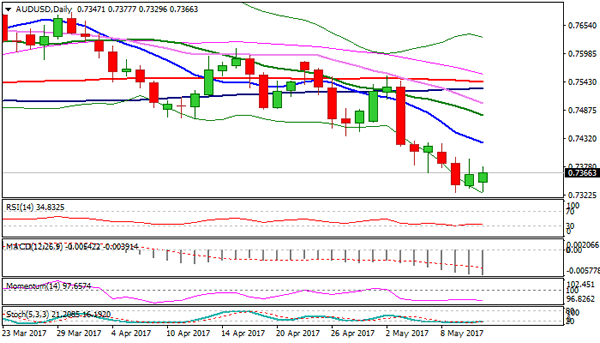
Technical Outlook: AUDUSD May Extend Recovery On Break Above Falling 10SMA
The Aussie remains constructive on Friday and probes above three-day congestion top at 0.7396. Bullish closes of past two day signal that immediate downside risk is sidelined, as broader bears found support at 0.7329 (weekly cloud base). The first pivot lies at 0.7416 (falling 10SMA/Fibo 38.2% of 0.7554/0.7327 downleg), firm break of which would signal stronger correction of 0.7554/0.7327 downleg . Next obstacle lies at 0.7440 (50% retracement), ahead of 0.7467 (Fibo 61.8% retracement, reinforced by falling 20SMA) which is expected to cap recovery before larger bears resume for renewed attack at weekly cloud base pivot.
Res: 0.7416, 0.7440, 0.7467, 0.7500
Sup: 0.7364, 0.7329, 0.7298, 0.7250
Eyes On US Retail Sales And CPI Releases
Friday May 12th will see the release of a set of crucial US data for April at 13:30 BST; retail sales, retail sales excluding autos, CPI and core CPI. Please be aware that it will likely affect USD and USD crosses along with commodities.
The dollar index has rebounded over the past four trading sessions after hitting a low 6-month low of 98.40. Gold prices saw a rebound on Thursday, and has now touched a three-day high of $1228.98 on Friday during early European session.
US retail sales (MoM) saw a downtrend over the past three months mainly caused by the decline in auto and petroleum sales. The consensus for the April figure is an optimistic forecast of 0.6%. However, sales in April for the two automobile tycoons, Ford and GM, saw a further falling of 7.1% and 5.8% respectively. The declines will likely weigh on the upcoming data. US retail sales outlook seems to be a bit gloomy before auto sales see a recovery.
Retail sales excluding autos (MoM) also saw a downtrend over the past three months with the reading for March falling into zero growth, not seen since August 2016.
US CPI (YoY) has seen a healthy upswing since August 2015; staying above the Fed’s 2% target since December 2016. Core CPI (YoY) has been oscillating steadily in the range between 2.1% – 2.3% since January 2016.
On Thursday, the Bank of England (BoE) announced that; interest rates remain unchanged at 0.25% and the asset purchase programme also remains unchanged at £435 billion which are both in line with market expectations. The BoE sees inflation to be above their 2% target for the next three years due to weak GBP. Consumption will continue to experience a slowdown; however, this will be balanced by rising trade and investment. Wage growth is expected to be quicker in 2018.
The BoE forecasts interest rates are likely to remain at the current level until late 2019. However, monetary policy may need to be tightened more than the markets expect over the next three years. The BoE also predicts the Brexit process to be smooth.
The BoE holds a positive outlook on inflation and economy, however, it seems to be overly optimistic about the Brexit negotiation process. The EU is unlikely to make the process easy for the UK, to avoid encouraging other member states leaving following Brexit.
GBP/USD fell from 1.2940 after the UK data was released, holding above the significant support line at 1.2900. This support level was breached following the BoE announcement with GBP/USD hitting a 1-week low of 1.2848.
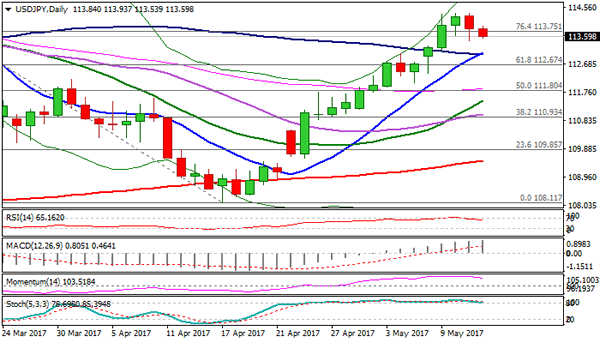
Technical Outlook: USDJPY – Risk Of Deeper Pullback Remains In Play
The USDJPY pair remains in red in early Friday's trading and pressures Thursday's low at 113.44, where Fibo 38.2% of 112.07/114.36 upleg offered temporary support.
Pullback from double-rejection at 114.36, triggered by profit-taking, may extend on weakening near-term studies as thick hourly cloud capped recovery attempts and maintains pressure.
Loss of 113.46 handle would expose next strong supports at 113.05 (rising daily Tenkan-sen and 10/100 SMA bull-cross) and 112.79 (daily cloud top), loss of which would signal stronger correction The notion is supported by reversal of daily RSI/slow stochastic from overbought territory.
Res: 113.93, 114.10, 114.36, 114.87
Sup: 113.44, 113.05, 112.79, 112.38
USD/CAD Candlesticks and Ichimoku Analysis
Weekly
• Last Candlesticks pattern: Bullish engulfing
• Time of formation: 02 May 2016
• Trend bias: Up
Daily
• Last Candlesticks pattern: Hammer
• Time of formation: 19 Oct 2016
• Trend bias: Up
USD/CAD – 1.3694
As the greenback has eased after rising to 1.3794 late last week, suggesting consolidation below this level would be seen, however, reckon downside would be limited to support at 1.3643 and bring another rise later, above said resistance at 1.3794 would extend recent upmove from 1.2461 low for further gain to 1.3835-40 (61.8% Fibonacci retracement of 1.4690-1.2461) and possibly towards 1.3900-10, however, near term overbought condition should prevent sharp move beyond 1.3950 and price should falter below psychological resistance at 1.4000, risk from there is seen for a retreat later.
On the downside, expect pullback to be limited to support at 1.3643 and bring another rise later to aforesaid upside targets. Below 1.3600-10 would defer and risk correction to 1.3550-60 but break of support at 1.3530 is needed to signal a temporary top is formed, bring test of the Kijun-Sen (now at 1.3509), a daily close below there would suggest recent rise has ended instead, risk deeper correction to 1.3490-00, then 1.3450-55 but price should stay well above support at 1.3411, bring a strong rebound later.
Recommendation: Hold long entered at 1.3650 for 1.3850 with stop below 1.3550.
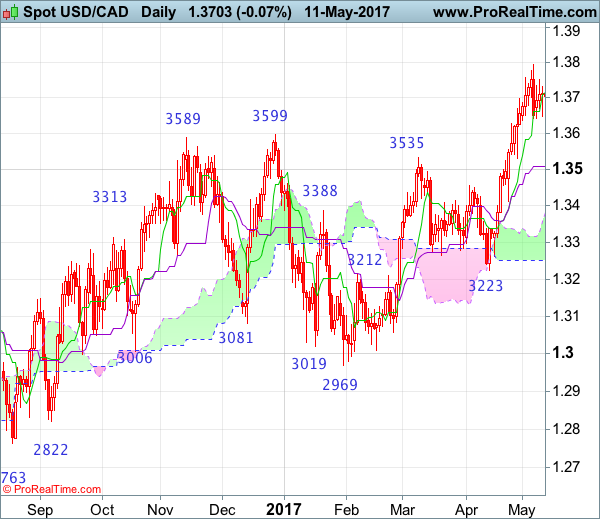
On the weekly chart, as the greenback has maintained a firm undertone after breaking above previous resistance at 1.3599, adding credence to our bullish view that the erratic upmove from 1.2461 (2016 low) is still in progress and bullishness remains for this move to extend headway to 1.3835-40 (61.8% Fibonacci retracement of 1.4690-1.2461) and then 1.3900 but overbought condition should prevent sharp move beyond psychological resistance at 1.4000, risk from there has increased for a retreat to take place.
On the downside, although initial pullback to 1.3645-50 cannot be ruled out, reckon downside would be limited to previous resistance at 1.3599 (now support) and bring another rise later. Only below the upper Kumo (now at 1.3576) would defer and risk test of the Tenkan-Sen (now at 1.3509), break there would defer and suggest top is possibly formed, risk weakness to 1.3450, then test of support at 1.3411 but reckon the Kijun-Sen (now at 1.3382) would limit downside and bring another rise later. In the event the pair drops below the Kijun-Sen, this would suggest top is formed instead, bring weakness to 1.3300, then 1.3260-65 but reckon support at 1.3223 would remain intact.
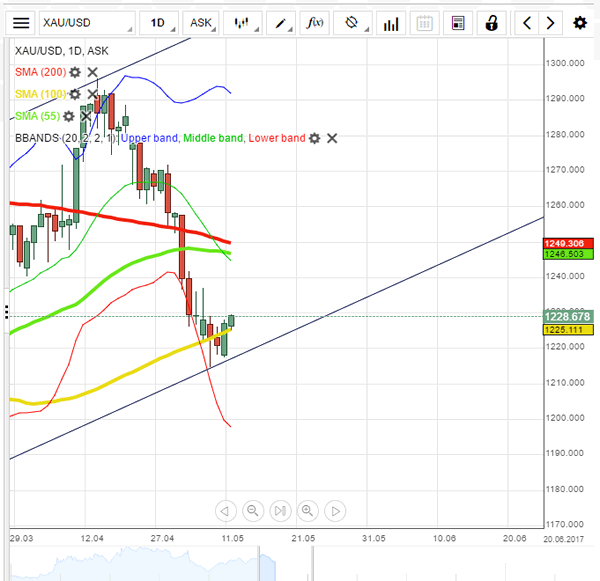
Gold Analysis: Approaches 1,230 Mark
'Whatever Trump says is important and is affecting the markets and may influence gold prices for the short-term.' – Barnabas Gan, OCBC (based on Reuters)
Pair's Outlook
On Friday morning the yellow metal's price moved higher, as it was attempting to break the resistance, which is put up by the 100-day SMA. The SMA on Friday morning was located at the 1,228.32 level. As the SMA has kept the rate lower for the past three trading session, a break of it would release the piled up bullish momentum, which can be observed also in the SWFX market sentiment. The resulting surge could result in the commodity price reaching the weekly PP at 1,242.06, which is the closest resistance level above the mentioned simple moving average.
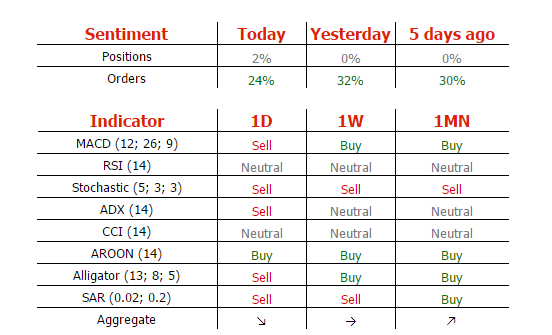
Traders' Sentiment
SWFX traders are almost neutral, as 51% of open positions are long. Meanwhile, 62% of trader set up orders are to buy the metal.
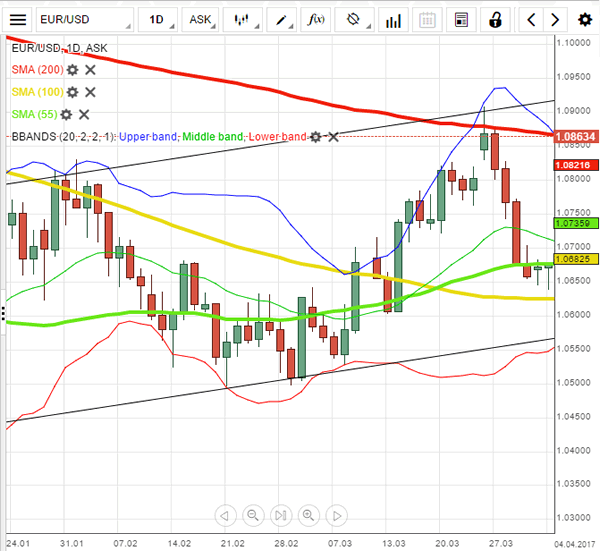
EUR/USD Analysis: Finds Support Against Buck
'Until there is a stronger move down, the chart is now neutral.' – Al Brooks, Brooks Price Action (based on investing.com)
Pair's Outlook
After touching the 1.0840 mark on Thursday the EUR/USD currency exchange rate began a surge, which lasted into the morning hours of Friday's trading. On the daily chart it can be observed that the support for the rebound was provided by the 20-day SMA, which on Friday was already located at the 1.0855 level. Due to that it is highly possible that the currency exchange rate will once more move into the resistance put up by the weekly S1, which is located at the 1.0916 level.
Traders' Sentiment
SWFX traders have slightly decreased their bearish positions, as 59% of open positions are short on Friday, compared to 60% previously. Meanwhile, trader set up sell order proportion has decreased from 65% to 57%.