Sample Category Title
Kiwi Dollar May Have Found This Year’s Low
Key Points:
- Two key patterns are nearing their ends.
- Near-term consolidation looks likely.
- A breakout could be on the horizon.
A number of chart patterns are all nearing their endgame for the Kiwi Dollar which could mean that we have some interesting trading ahead. Notably, we could see both some decent buying and selling pressure before the month is done and, following this, we could even have a change in the long-term trend.
First and foremost, the two key patterns influencing the NZD at the moment are the long-term ABC wave the more recent falling wedge structure. Combined, they indicate that we can expect to see the pair move higher in the immediate future before reversing once again to retest the bottom of the wedge and the long-term declining trend line. Importantly, such a movement would be in line with a number of other technical readings, including the Parabolic SAR and EMA bias.
Nevertheless, this narrowing price action could really just be the start of our story and the real trading opportunity looks as though it is going to come in the wake of the wedge's completion. Specifically, the ending of both an ABC wave and a falling wedge around the same time should mean that we have a bullish breakout on our hands which could reverse the long-term trend and usher in another tranche of gains for the embattled Kiwi Dollar.
If this occurs, gains are likely to be substantial, potentially extending all the way back to last year's highs. Of course, this would largely be in line with much of the fundamental bias which is becoming bullish given the general recovery of dairy prices and the plunging unemployment rate in NZ. Both of these factors are likely to see inflation rise moving forward which could put pressure on the RBNZ to re-evaluate its historically low interest rates.
Regardless, in the near-term, we are forecasting a modest uptick in buying pressure that should be capped around the 0.6910 mark by the 38.2% Fibonacci level and the ABC wave. The following rebound is also worth taking into consideration as it could be this year's low should the aforementioned breakout take place.
Dollar’s Next Hurdles
A bull market is like a great trader. The good days are solid and consistent, while the bad days are rare and the losses minimal. We explore the USD below. In response to rising questions about metals from Premium subscribers with regards to our gold and silver trades, a special charts alert has just been posted and sent to members about Ashraf's view on gold, backed by 7 technical arguments.
That's how the US dollar and S&P 500 are performing at the moment. A shudder hit both early in US trading, but it came after days of gains and by late trading, the dip was minimized.
On the day, the yen was the top performer while the New Zealand dollar lagged. The Asia-Pacific calendar winds down with a quiet calendar but US CPI and retail sales are out later.
The Fed is helping to keep a constant bid under the dollar. Comments from NY Fed's Dudley didn't get much attention because he was speaking in Mumbai but he provided the clearest evidence yet that the Fed is committed to a June hike. He said the recovery continues apace, which is seemingly innocuous but in the context of the Fed fund futures market pricing in a greater-than 90% chance of a hike, it's a tacit endorsement, particularly from one of the FOMC's more cautious members.
As has been shown over the last 6 months, everything can change and the swiftest means for that is via economic data. As we noted earlier in the week, the quiet calendar helped the US dollar drift. That changes Friday when CPI and retail sales are released at the same time.
At some point the market (and the Fed) will lose patience with the inability of hard data to catch up with soft numbers. The retail sales control group is expected to rise 0.4% and it will need to at least come close or some second thoughts will creep in.
There is likely more leeway on inflation but beyond the June FOMC, Yellen will need to see a sustained upturn if gradual hikes are to continue.
But even if the numbers are soft, it's proven tough to hold US dollar shorts. The slump on last week's non-farm payrolls was wiped out by Monday and given the strength of the USD market, we can't rule out a repeat.
Aussie Trading Higher In The Morning Session
For the 24 hours to 23:00 GMT, the AUD rose 0.22% against the USD and closed at 0.7371.
LME Copper prices rose 1.2% or $68.5/MT to $5580.5/MT. Aluminium prices rose 0.9% or $17.0/MT to $1887.0/MT.
In the Asian session, at GMT0300, the pair is trading at 0.7379, with the AUD trading 0.11% higher against the USD from yesterday’s close.
The pair is expected to find support at 0.7347, and a fall through could take it to the next support level of 0.7314. The pair is expected to find its first resistance at 0.7400, and a rise through could take it to the next resistance level of 0.7420.
Moving ahead, Reserve Bank of Australia’s (RBA) May meeting minutes along with Australia’s unemployment rate and Westpac consumer confidence data, slated to release next week, will be on investors’ radar.
The currency pair is trading above its 20 Hr and 50 Hr moving averages.

European Commission Lifted Euro-Zone’s Growth Forecast For 2017
For the 24 hours to 23:00 GMT, the EUR marginally declined against the USD and closed at 1.0862.
Yesterday, the European Commission (EU), in its quarterly economic forecasts report, slightly upgraded Euro-zone's economic growth forecast to 1.7% for 2017, from 1.6% estimated earlier in February. However, the Commission left the region's growth predictions for 2018 unchanged.
On the data front, Germany's wholesale price index climbed 0.3% on a monthly basis in April. In the prior month, the index had registered a flat reading.
In the US, data indicated that the number of Americans filing for fresh jobless claims unexpectedly dropped to a level of 236.0K in the week ended 06 May 2017, pointing to a tightening in the labour market. Market participants were anticipating initial jobless claims to rise to a level of 245.0K, compared to a level of 238.0K in the previous week. Additionally, the nation's producer prices climbed more-than-anticipated by 0.5% on a monthly basis in April, compared to a fall of 0.1% in the prior month. Markets were anticipating producer price to rise 0.2%.
In the Asian session, at GMT0300, the pair is trading at 1.0871, with the EUR trading 0.08% higher against the USD from yesterday's close.
The pair is expected to find support at 1.0842, and a fall through could take it to the next support level of 1.0812. The pair is expected to find its first resistance at 1.0897, and a rise through could take it to the next resistance level of 1.0922.
Trading trends in the Euro today is expected to be determined by the release of the Euro-zone's industrial production for March and Germany's flash 1Q GDP data, due in a few hours. Moreover, in the US, consumer price index and advance retail sales, both for April coupled with Michigan consumer sentiment index for May, will garner significant amount of market attention.
The currency pair is showing convergence with its 20 Hr and 50 Hr moving averages.

Bank Of England Left Interest Rates Unchanged, Lowered 2017 Growth Forecast
For the 24 hours to 23:00 GMT, the GBP declined 0.32% against the USD and closed at 1.2888, after the Bank of England (BoE) trimmed Britain’s 2017 economic growth outlook.
The BoE, at its latest monetary policy meeting, opted to keep its interest rates steady at a record low level of 0.25%, with one member, Kristen Forbes, again voting in favour of an immediate rate hike. Further, the BoE lowered its growth forecast for this year to 1.9% from 2.0%, while raised it for 2018 to 1.7% from 1.6%. Moreover, the bank revised up its inflation forecast, expecting inflation to peak at just below 3.0% in the fourth quarter. In a post meeting statement, the BoE Governor, Mark Carney, warned of a sharper-than-expected squeeze on household income, while also suggested that the central bank could raise rates more sharply than expected if Brexit talks go smoothly and the economy remains stable.
Prior to the monetary policy meeting, the Pound fell against the USD after the latest economic data indicated that the UK economy slowed sharply in the first quarter.
Britain’s industrial production dropped more-than-expected by 0.5% on a monthly basis in March, dropping for a third consecutive month and compared to market expectations for a drop of 0.4%. Industrial production had fallen by a revised 0.8% in the prior month. Further, the nation’s manufacturing production eased 0.6% MoM in March, more than market expectations for a drop of 0.2%. In the prior month, manufacturing production had dropped by a revised 0.3%. Also, construction output unexpectedly eased 0.7% MoM in March, defying market expectations for an advance of 0.4%. In the previous month, construction output had registered a revised drop of 1.3%. Moreover, the nation’s total trade deficit widened more-than-expected to a level of £4.9 billion in March, compared to a revised deficit of £2.7 billion in the previous month.
In other economic news, leading think tanker, NIESR estimated that UK’s gross domestic product (GDP) advanced 0.2% in the three months to April 2017, whereas investors had envisaged for a rise of 0.4%. In the January-March 2017 period, NIESR estimated GDP had climbed by a revised 0.3%.
In the Asian session, at GMT0300, the pair is trading at 1.2884, with the GBP trading slightly lower against the USD from yesterday’s close.
The pair is expected to find support at 1.2838, and a fall through could take it to the next support level of 1.2792. The pair is expected to find its first resistance at 1.2939, and a rise through could take it to the next resistance level of 1.2994.
The currency pair is showing convergence with its 20 Hr moving average and trading below its 50 Hr moving average.

Japanese Yen Trading Higher This Morning
For the 24 hours to 23:00 GMT, the USD declined 0.48% against the JPY and closed at 113.76.
In economic news, data revealed that Japan’s Eco-Watchers survey for the current situation index rose to a level of 48.1 in April, higher than market expectations for an advance to a level of 47.8. The index had registered a reading of 47.4 in the prior month. Further, the nation’s Eco-Watchers survey for the future outlook index climbed more-than-estimated to a level of 48.8 in April, compared to market expectations of a rise to a level of 48.2. In the previous month, the index had recorded a reading of 48.1.
In the Asian session, at GMT0300, the pair is trading at 113.65, with the USD trading 0.1% lower against the JPY from yesterday’s close.
The pair is expected to find support at 113.30, and a fall through could take it to the next support level of 112.96. The pair is expected to find its first resistance at 114.13, and a rise through could take it to the next resistance level of 114.62.
Next week, market participants focus on Japan’s GDP 1Q data, industrial production and tertiary industry index data, will be eyed by investors.
The currency pair is trading below its 20 Hr and 50 Hr moving averages.

Switzerland’s Consumer Price Inflation Advanced As Expected In April
For the 24 hours to 23:00 GMT, the USD declined 0.13% against the CHF and closed at 1.0077.
Macroeconomic data showed that Switzerland's consumer price index advanced 0.2% MoM in April, meeting market expectations and compared to a similar rise in the prior month.
In the Asian session, at GMT0300, the pair is trading at 1.0074, with the USD trading a tad lower against the CHF from yesterday's close.
The pair is expected to find support at 1.0052, and a fall through could take it to the next support level of 1.0031. The pair is expected to find its first resistance at 1.0097, and a rise through could take it to the next resistance level of 1.0121.
The currency pair is showing convergence with its 20 Hr and 50 Hr moving averages.

Canada’s New House Price Index Climbed In March
For the 24 hours to 23:00 GMT, the USD rose 0.2% against the CAD and closed at 1.3703.
On the macro front, Canada's new housing price index registered a rise of 0.2% on a monthly basis in March, in line with market expectations. In the previous month, the index had advanced 0.4%.
In the Asian session, at GMT0300, the pair is trading at 1.3698, with the USD trading marginally lower against the CAD from yesterday's close.
The pair is expected to find support at 1.3659, and a fall through could take it to the next support level of 1.3621. The pair is expected to find its first resistance at 1.3753, and a rise through could take it to the next resistance level of 1.3809.
The currency pair is showing convergence with its 20 Hr and 50 Hr moving averages.

EUR/USD Daily Outlook
Daily Pivots: (S1) 1.0834; (P) 1.0864 (R1) 1.0889; More....
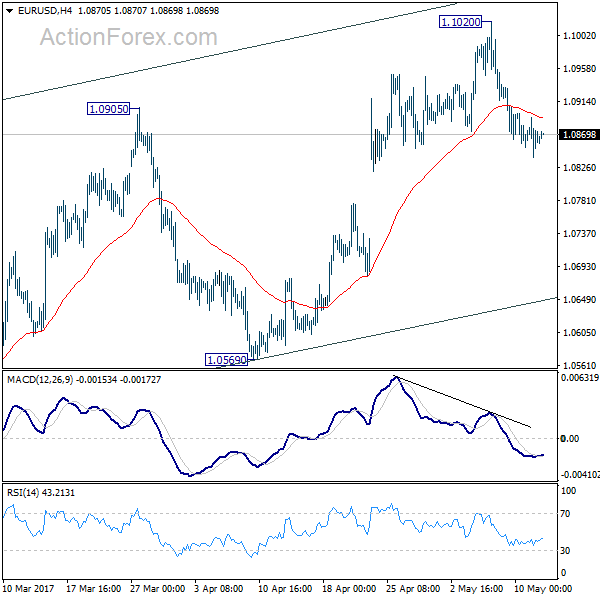
Intraday bias in EUR/USD stays mildly on the downside for the moment. The decline from 1.1020 short term top would extend to 55 day EMA (now at 1.0760) first. As noted before, rise from 1.0339 is seen as a corrective move. Break of 55 day EMA will affirm the case that such correction is completed and bring deeper decline to 1.0569 for confirmation. However, above 1.1020 will extend such corrective rise instead.
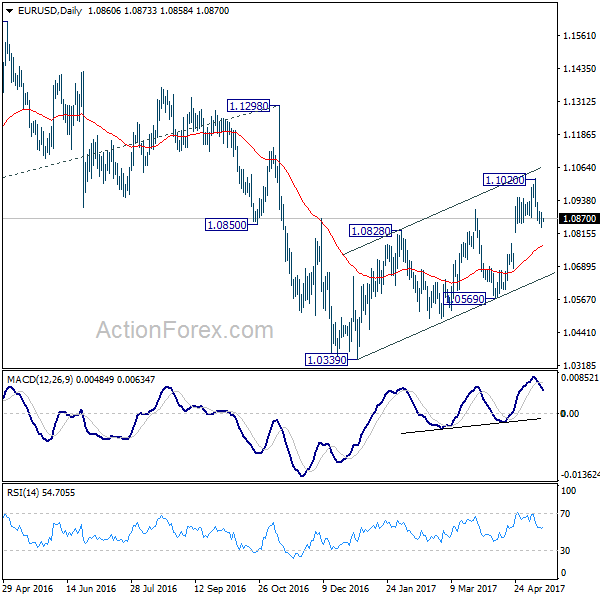
In the bigger picture, as long as 1.1298 key resistance holds, whole down trend from 1.6039 (2008 high) is still expected to continue. Break of 1.0339 low will send EUR/USD through parity to 61.8% projection of 1.3993 to 1.0461 from 1.1298 at 0.9115. However, considering bullish convergence condition in weekly MACD, break of 1.1298 will indicate long term reversal.
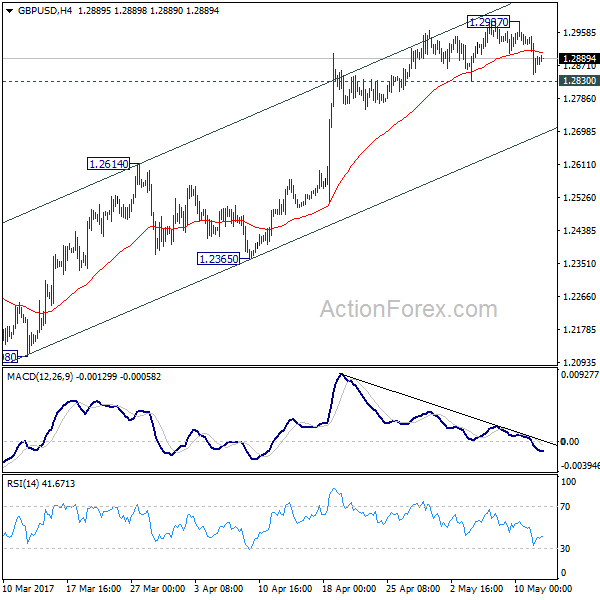
GBP/USD Daily Outlook
Daily Pivots: (S1) 1.2840; (P) 1.2894; (R1) 1.2940; More...
Intraday bias in GBP/USD remains neutral for the moment. Another rise cannot be ruled out, but upside momentum is clearly weak with bearish divergence condition in 4 hour MACD. Also, current rally is seen as part of the corrective pattern from 1.1946. Hence, even in case of another rally, we'll look for reverse signal above 1.2987. Meanwhile, break of 1.2830 support will indicate short term topping. In such case, intraday bias will be turned back to the downside for 1.2614 support.
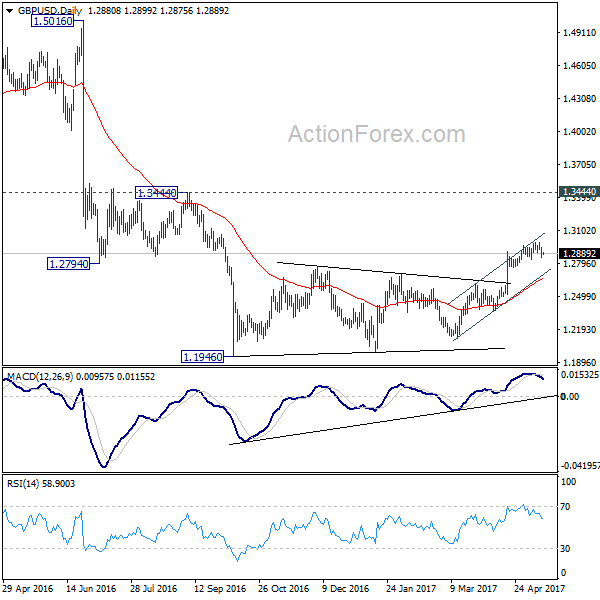
In the bigger picture, fall from 1.7190 is seen as part of the down trend from 2.1161. There is no sign of medium term reversal yet. Sustained trading below 61.8% projection of 2.1161 to 1.3503 from 1.7190 at 1.2457 will target 100% projection at 0.9532. Overall, break of 1.3444 resistance is needed to confirm medium term bottoming. Otherwise, outlook will remain bearish.